Chipmaker Pulls Back to Key Supportive Trendline
Lam Research Corporation (NASDAQ: LRCX) stock has struggled recently, shedding 16.6% in the last week alone. The shares have seen some volatility since their April-June rally peaked at a June 30 record high of $438.50. LRCX was last seen down 2.3% at $267.22 today, though it still boasts a roughly 56% year-to-date lead. Plus, the recent pullback has found support at the 80-day moving average, a trendline with historically bullish implications.
Per Schaeffer's Senior Quantitative Analyst Rocky White, LRCX has traded within 0.75 times the 200-day moving average's 20-day average true range (ATR) after spending at least 80% of the previous two weeks and 80% of the prior 42 trading sessions above the trendline. This setup has occurred five other times over the last decade, after which the stock was higher one month later 80% of the time, averaging a 6.9% gain.
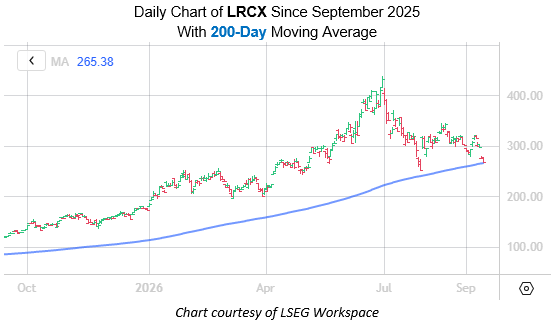
Furthermore, LRCX's 14-day Relative Strength Index (RSI) of 28.7 sits in "oversold" territory, which often precedes a short-term bounce.
Mentioned In This Article
Latest News
| Oct-24 | |
| Oct-24 | |
| Oct-23 | |
| Oct-23 | |
| Oct-23 | |
| Oct-23 | |
| Oct-23 | |
| Oct-23 | |
| Oct-22 | |
| Oct-22 | |
| Oct-22 | |
| Oct-22 | |
| Oct-22 | |
| Oct-22 | |
| Oct-22 |
