An Investor's Earnings Almanac For Q4
Subscribers to The Contrarian Edge received this commentary on Saturday, Oct. 101.
Did you know, that after 208 years, The Farmer’s Almanac will cease printing after 2026? It’s a sad day for fans of printed periodicals and almanacs, tools of a bygone era now seen as a nostalgic remnant of old school journalism. The internet has done many great things, but rendering physical copies obsolete is not one of them.
With the final earnings season of 2026 is upon us, we’re dialing it back to 1818. In almanac style, we compiled – and will continue to track as earnings season progresses – all of the pertinent information you might need about quarterly reports and their impact on markets. Consider it a throwback prospectus periodical on quarterly reports.
You can’t run from the History major; first we’re going to go over some historical stats:
Moving it forward, here’s some context for the current season.
Chapter 1: Bank on …Nothing
Banks are the Ricky Henderson of earnings season. They lead things off, usually get on base, and can set up future success or failure depending on their actions.
This year, Bank of America Corp (NYSE:BAC), Morgan Stanley (NYSE:MS), and Goldman Sachs Group Inc (NYSE:GS) all stumble into earnings with 14-Day Relative Strength Indexes (RSI) of 30 or less. That’s what bonds at 24-year highs will do to bank stocks.
Here’s the post-earnings history tables of those three names.
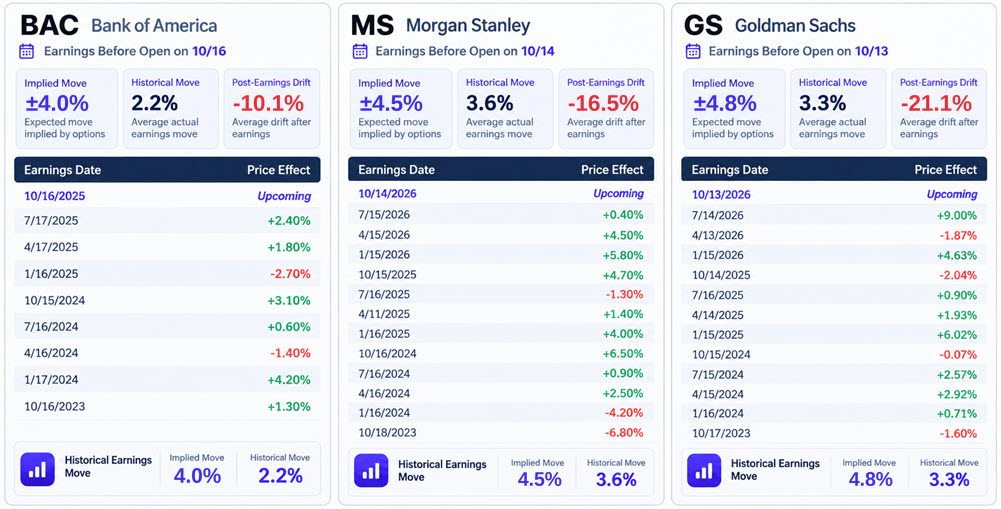
MS has quite the positive post-earnings history, and the highest average move of the three. BAC has the smallest implied move for next week and the smallest average return, at 2.2%. They’ll also be reporting last of the bunch, on Oct. 16. Blue chipper GS is fresh off a 9% post-earnings bull gap from July. The stock has a finished higher after earnings after eight of the last 12 reports and has the largest implied move at 4.6%.
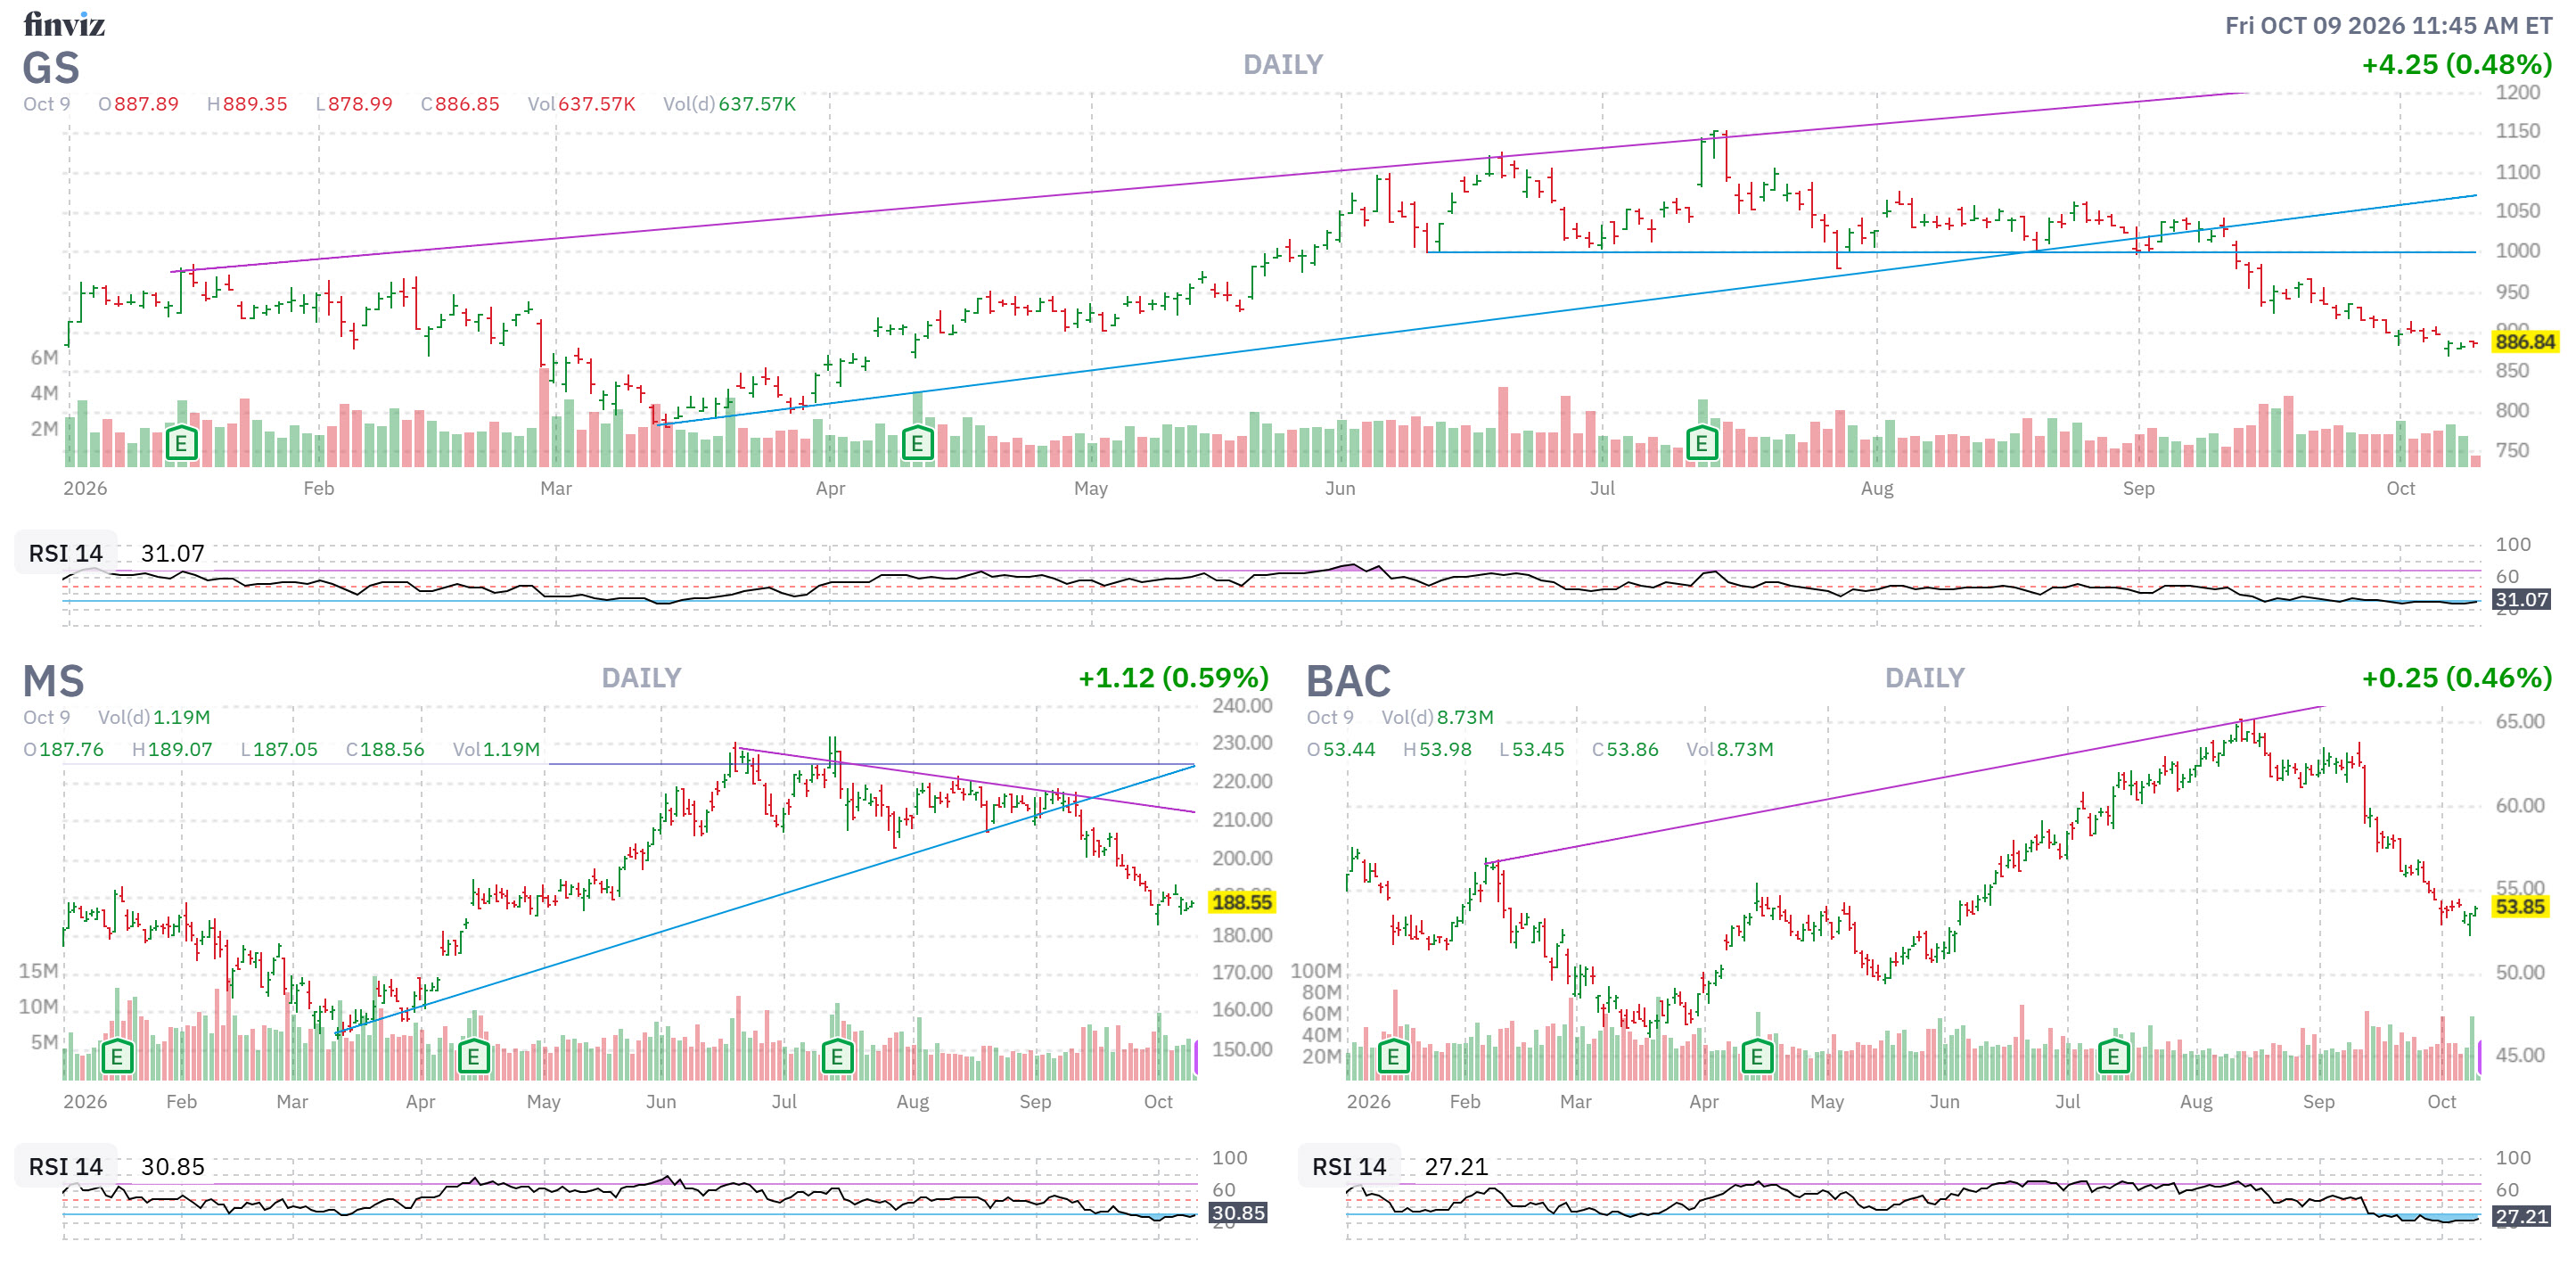
The bank stock charts all look like one another. Right now, they’re all in correction territory off summer peaks and below a confluence of major moving average. If you want a silver lining, there’s a sliver of consolidation around these multi-month lows right now.
There’s some differentiation in the options pits. Both BAC and MS show 10-day, buy-to-open call/put volume ratios of 3.67 and 2.24, in the respective percentiles of 99% and 84%. Goldman Sachs, on the other hand, has a 10-day BTC put/call ratio of 0.98, indicating a slight skew toward puts. But remember: implied volatilities are ramped up ahead of earnings, making premium a pricey play at the moment.
One way forward for options is a post-earnings volatility crush, and some historical data. Per Market Chameleon, GS averages a two-week post-earning return of 1.6%, with a 75%-win rate, going back two years. Bank of America’s two-week return sits at 0.7%, with a 67% positivity rate. Morgan Stanley’s return over the same timeframe is -0.7%.
All of these historical data points set up the question: will an upbeat lagging indicator (a bank’s' solid quarterly report) be enough to offset crummy market conditions? Given the rather lackluster historical earnings signals, the ‘buy dip’ notion with bank stocks may seem tempting, but given the broader market backdrop, it might be best to sit and wait.
Chapter 2: Aluminum (Stock) Foil
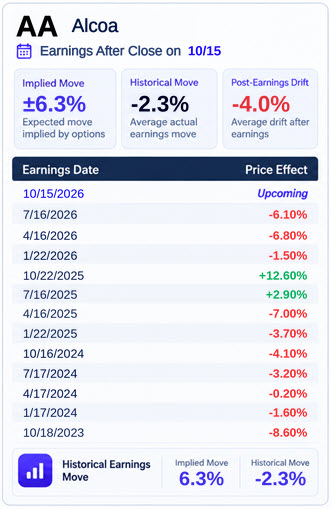
Aluminum staple Alcoa Corp (NYSE:AA) is another name to flag for next week. AA has a rather shaky post-earnings history, finishing higher only twice after the last 12 reports. The average loss of 2.3% is greatly offset by the 12.6% post-earnings pop from October of last year but also note the two straight reports of post-earnings selloffs.
This time around, the options market is pricing in a 6.3% move.
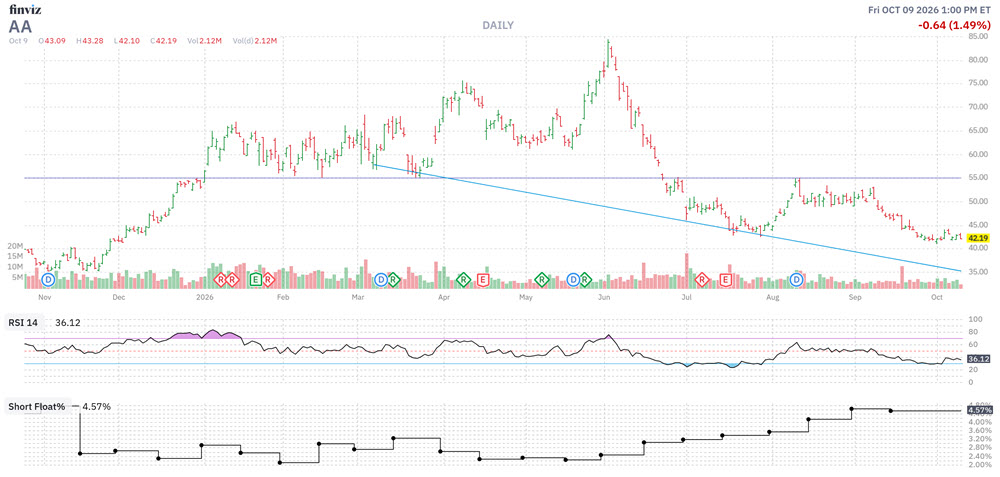
AA is down 20% in 2026 and just received a price-target cut to $50 from $52. Watch $40 as a floor, while $35 is the 52-week lows from October 10, 2025. With short interest up nearly 10% in the most recent reporting period and the 12 million shares sold short accounting for 4.5% of Alcoa’s total available float, there’s a modest short squeeze situation to monitor as well.
Chapter 3: ASML: The Semiconductor Sherpa
Click Here to view the rest on Schaeffer’s Substack!
Mentioned In This Article
Latest News
| 39 min | |
| 48 min | |
| 57 min | |
| 58 min | |
| 1 hour | |
| 1 hour | |
| 1 hour | |
| 1 hour | |
| 1 hour | |
| 1 hour | |
| 2 hours | |
| 2 hours | |
| 2 hours | |
| 2 hours | |
| 2 hours |
