Q3 Earnings Season Preview: Revenue Beats Lag, Multi-Sector Momentum Holds
We get into the heart of the Q3 earnings season this week, with more than 250 companies reporting results, including 73 S&P 500 members. By the end of this week, we will have seen Q3 results from 118 S&P 500 members, or almost a quarter of the index’s total membership.
We are off to a bit of a mixed start in the Q3 reporting cycle, with the growth pace and the revenue-beat percentage tracking modestly lower relative to the recent past. That said, the sample of results from the 9% of S&P 500 members that have reported is heavily weighted toward the Finance sector, and these initial mixed trends may shift as we head into the heart of the earnings season in the days ahead.
This week’s line-up of earnings releases is comprised of a fairly representative cohort of bellwether operators from a broad mix of sectors and industries, including two of the Mag 7 players, Meta Platforms and Tesla, and several other Tech players like Netflix, Texas Instruments, IBM, Spotify, and others. We will get results from air carriers (United, American, Southwest), railroad operators (CSX, Union Pacific), credit card issuers (American Express, Capital One, Synchrony), and many other blue chips like Procter & Gamble, GM, AT&T, Halliburton, and others.
We will have a definitive sense of how good or otherwise the Q3 earnings season has been by the end of this week.
Looking at overall expectations for the quarter, combining the actual results from the 45 S&P 500 members that have reported already with estimates for the still-to-come companies, Q3 earnings are currently expected to increase by +24.6% from the same period last year on +11.7% higher revenues, the 8th straight quarter of double-digit earnings growth for the index.
The Tech sector remains a major growth contributor, but momentum is broad-based, with 14 of the 16 Zacks sectors on track for positive earnings growth in Q3. Importantly, the revisions trend remains positive and broad-based, highlighting a steadily improving outlook.
The quarterly chart below details actual results alongside Q3 2026 growth expectations and forward projections.
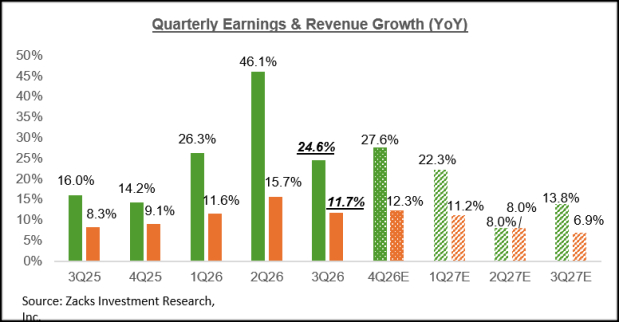
Image Source: Zacks Investment Research
As noted earlier, the revisions trend has been positive, sustaining the favorable trend in place for almost a year. Estimates for Q3 increased after the quarter got underway, and we are seeing a similar trend at play for 2026 Q4 estimates, as the chart below shows.
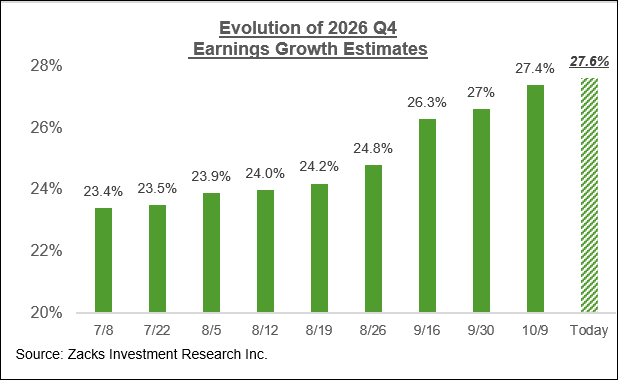
Image Source: Zacks Investment Research
This positive revisions behavior is not a new development; it extends a tailwind that has been building for nearly a year. The positive revisions were at first concentrated in Technology and, more recently, Energy, following Middle East supply disruptions. However, for 2026 Q4 and also what we saw for Q3, the constructive estimate revisions have broadened significantly, rising across 7 of the 16 Zacks sectors—including Aerospace, Construction, Industrials, Finance, and Transportation alongside Tech and Energy.
On the negative side, Q4 estimates remain under pressure for these 8 sectors – Conglomerates, Autos, Basic Materials, Consumer Staples, Consumer Discretionary, Medical, Business Services, and Retail. It is important to note that estimates for full-year 2027 have also been trending higher.
Sector Focus: Broad-Based Strength
Q3 earnings are expected to be above the year-earlier level for 14 of the 16 Zacks sectors, with 5 sectors expected to enjoy double-digit growth. The Conglomerates and Consumer Staples sectors are the only ones expected to have lower earnings in Q3 relative to the same period last year.
The 5 sectors expected to enjoy double-digit earnings growth in Q3 are Aerospace (up +160.5%), Energy (+122.2%), Tech (+43.7%), Basic Materials (+29.5%), Transportation (+9.6%), and Industrial Products (+13.5%).
Q3 earnings growth for the S&P 500 index drops to +20.1% from +24.6% once the Energy sector’s contribution is excluded from the index. Excluding the Tech sector, Q3 earnings growth for the rest of the index drops to +14.4%.
For the Finance sector, which has dominated the reporting docket thus far, Q3 earnings are expected to be up +7.3% from the same period last year on +6.3% higher revenues.
With Meta META and Tesla TSLA on deck to report results this week, it is useful to take a look at expectations for the Mag 7 group as a whole. The expectation is that Q3 earnings for the Mag 7 will increase by +20.9% on +22.8% higher revenues, as the chart below shows.
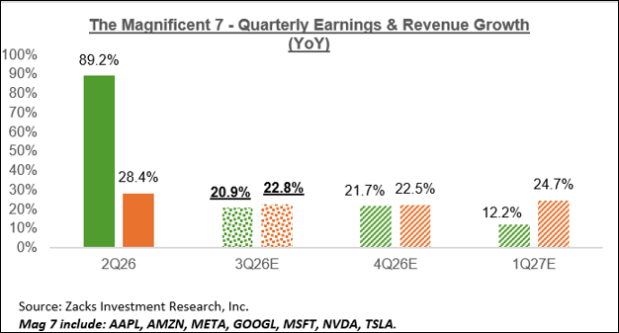
Image Source: Zacks Investment Research
Excluding the Mag 7 group’s contribution, Q3 earnings for the rest of the index would actually modestly improve to +25.8% (from +24.6%).
The chart below shows quarterly earnings and revenue growth expectations for the Tech sector as a whole.
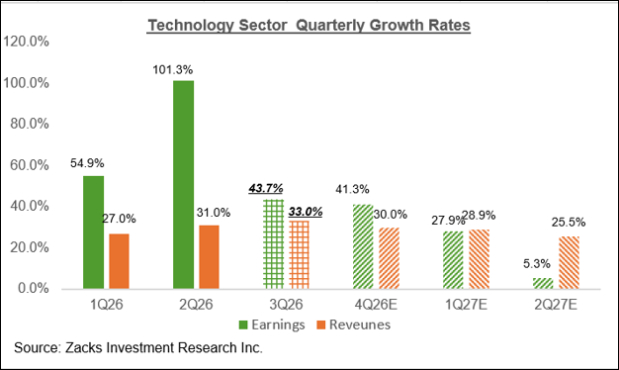
Image Source: Zacks Investment Research
The Q3 earnings and revenue growth rate drops to +21.1% from +43.7% once the substantial contributions from Nvidia NVDA, Micron MU, and Alphabet GOOGL are excluded, as the chart below shows.
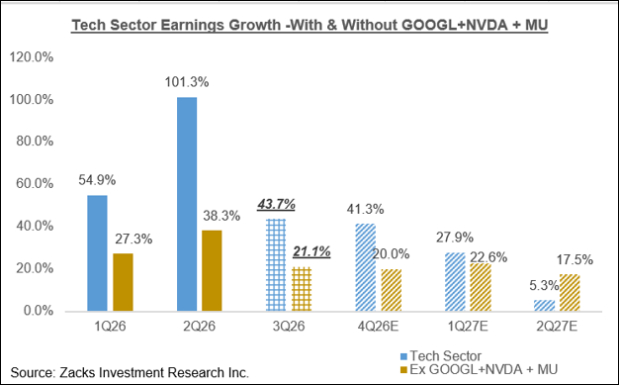
Image Source: Zacks Investment Research
Q3 Earnings Season Scorecard
Through Friday, October 16th, we have seen Q3 results from 45 S&P 500 members, or 9% of the index’s total membership. Total earnings for these companies are up +46.3% from the same period last year on +13.9% higher revenues, with 82.2% beating EPS estimates and 62.2% beating revenue estimates.
The comparison charts below show the earnings and revenue growth rates for these companies compared to other recent periods.

Image Source: Zacks Investment Research
The very strong earnings and revenue growth pace for this group of 45 S&P 500 members is mostly due to Micron, whose Q3 earnings increased +1075.7% from the year-earlier level. Excluding Micron, Q3 earnings for the remaining 44 index members that have reported would be up +10.4%.
The chart below shows the Q3 earnings growth pace for the companies that have reported, with and without Micron, across recent periods.
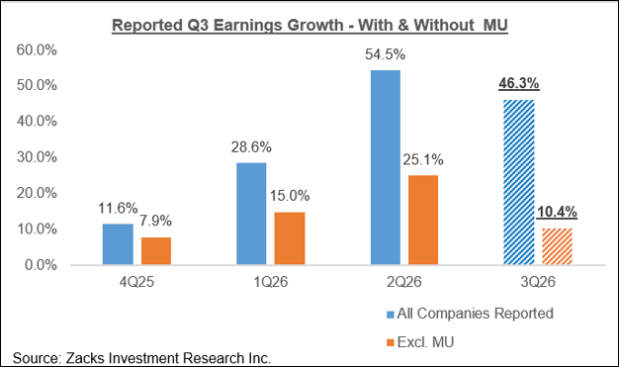
Image Source: Zacks Investment Research
The comparison charts below show the Q3 EPS and revenue beats percentages for these companies compared to other recent periods.

Image Source: Zacks Investment Research
For the Finance sector, we now have Q3 results from 44.3% of the sector’s market capitalization in the S&P 500 index. Total earnings for these Finance sector companies are up +10.6% from the same period last year on +8.6% higher revenues, with 80% beating EPS estimates and 50% beating revenue estimates.
The comparison charts below put the Q3 earnings and revenue growth rates in a historical context.
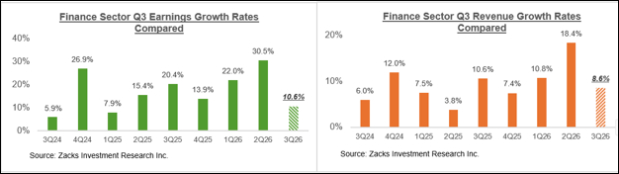
Image Source: Zacks Investment Research
The comparison charts below show the Q3 EPS and revenue beats percentages in a historical context.
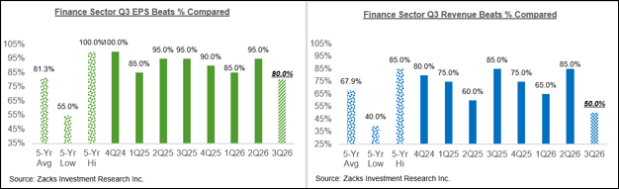
Image Source: Zacks Investment Research
As you can see above, not only are the growth rates tracking below other recent periods, but Finance sector companies also seem to be struggling to beat consensus EPS and revenue estimates.
The Earnings Big Picture
The chart below shows the aggregate growth picture for the S&P 500 index on a calendar year basis.
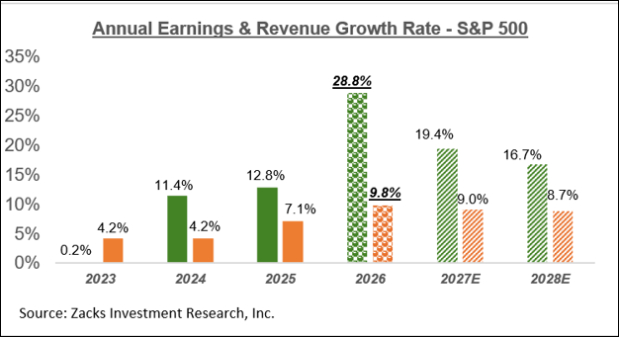
Image Source: Zacks Investment Research
As we noted earlier, estimates for full-year 2027 are experiencing the same positive and broad-based revisions trend that we noted earlier in the context of 2026 Q4.
For a detailed view of the evolving earnings picture, please check out our weekly Earnings Trends report here >>>> Broad-Based Growth Meets Banks Caution: The Evolving Q3 Earnings Picture
Want the latest recommendations from Zacks Investment Research? Today, you can download 7 Best Stocks for the Next 30 Days. Click to get this free report
Micron Technology, Inc. (MU): Free Stock Analysis Report
NVIDIA Corporation (NVDA): Free Stock Analysis Report
Tesla, Inc. (TSLA): Free Stock Analysis Report
Alphabet Inc. (GOOGL): Free Stock Analysis Report
Meta Platforms, Inc. (META): Free Stock Analysis Report
This article originally published on Zacks Investment Research (zacks.com).
Mentioned In This Article
Latest News
| 8 min | |
| 36 min | |
| 52 min | |
| 1 hour | |
| 1 hour | |
| 1 hour |
Dow Jones Futures: S&P 500, Nasdaq Break Key Levels As CoreWeave, Dell Dive; Tesla, SpaceX, Meta Loom
META
Investor's Business Daily
|
| 1 hour | |
| 1 hour | |
| 1 hour | |
| 2 hours | |
| 2 hours | |
| 2 hours | |
| 2 hours | |
| 3 hours | |
| 3 hours |
