How Long Can Stocks Hold Up In This 'Go Nowhere' Market?
“The S&P 500 snapped its longest streak without a 1% drop in over six years. The Russell 2000 entered a correction. A gauge of chip giants sank 4.3%. CoreWeave's bonds hit levels that usually signal distress.”
For the past five months, the S&P 500 Index (SPX—7,659.44) might be best described as the “Go Nowhere” market.
If one ignores the chart and focuses only on the headlines, the SPX might be mistaken for being in a bear market or correction. These headlines include soaring interest rates, soaring oil prices, massive artificial intelligence (AI) spending and uncertain returns, plus continued uncertainty surrounding tariffs and war.
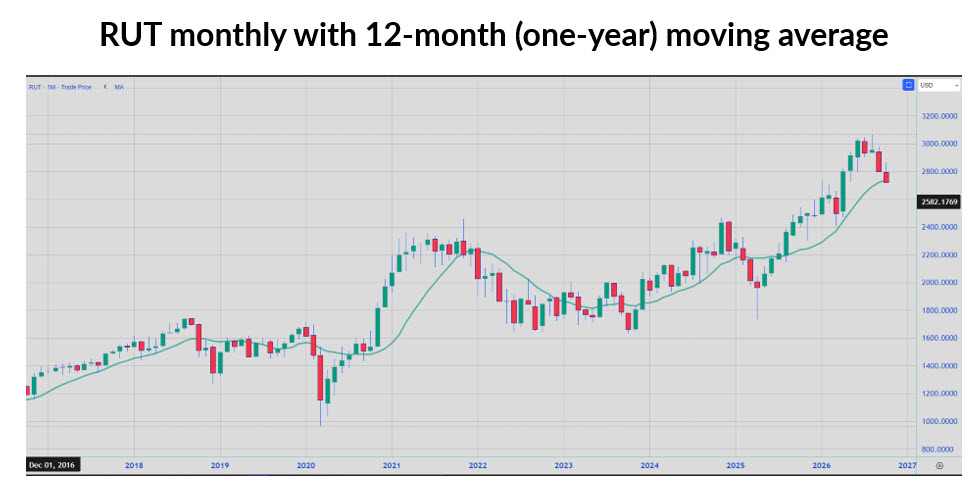
Large-cap stocks have held up relatively well despite the negative headlines. Small-cap stocks, however, entered correction territory last week. The Russell 2000 Index (RUT—2,721.37) has retreated from its summer peak near the 3,000 milestone and closed Friday near its 12-month moving average—a critical level that, as the chart below shows, has previously marked lows before strong rallies. However, bulls beware: a major breach of this trendline has historically preceded weeks to months of continued weakness.
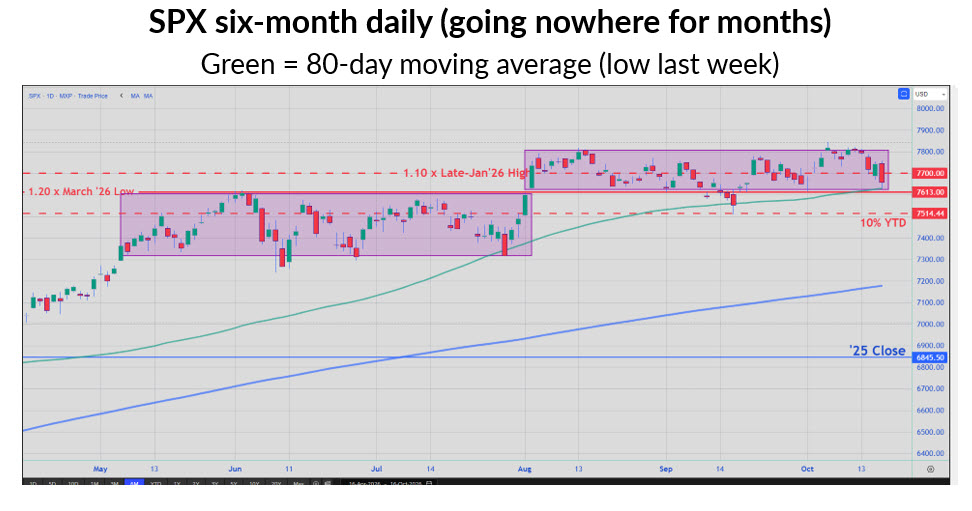
Even with investors punishing one of the hottest sectors last week (semiconductors), the SPX remains in the 7,600-7,800 range that began in early August, when a one-day move pushed it out of another 200-point range between 7,400 and 7,600. In other words, the SPX’s five-month return through Friday was 3.5%, thanks largely to one single trading session – Aug. 4 – when the SPX rallied nearly 2% and closed above a prior range. Since that day, the SPX is slightly lower, thanks to last week’s trading.
For what it is worth, a well-known technology bellwether has been trading in a 200-point range too. Check out a weekly graph of Microsoft (MSFT) stock, which has been trading between $350 and $550 since July 2025. The $550 level was MSFT’s high last week.
For short-term equity traders, range-bound action does not eliminate opportunities. Strong undercurrents within the index have fueled sharp sector rotations, creating a “Whac-a-Mole” market: as one sector gets hammered, another pops higher, creating short-term trading opportunities.
“…since the turn of the century…October favors the bulls during midterm election years… Bears will readily (and correctly) point out that the only major October decline in this young century occurred when Donald Trump was president, the Fed was hiking rates, and there was a trade war between the U.S. and China. The similarities to now are strikingly similar...at the potential cost of paying more for portfolio protection, act on a hedge if you see technical deterioration. For example, you might look for a breach of both the 50-day and 80-day moving averages in a repeat of 2018 … This would mean that you put on a portfolio hedge if and only if the SPX declines below the 7,600 area.”
-Monday Morning Outlook, October 12, 2026
If you are a trader or investor with an intermediate- to longer-term horizon, the SPX closed above 7,600 and its 80-day moving average on Friday. However, it still enters the week at its range low and dangerously close to breaking below a level that would increase risk to the point that a short-term hedge might be required. In this case, we'd be looking at a repeat of October 2018, when the index lost 7% ahead of the midterms with President Donald Trump in office and a similar monetary and geopolitical environment. (As of Friday’s close, the SPX was eight points above the September month-end close).
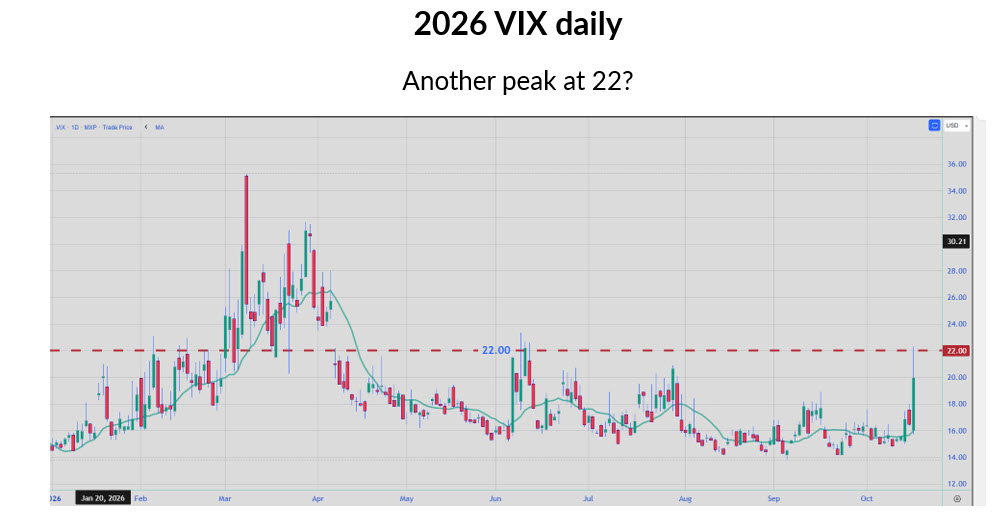
With the SPX still in its range, albeit at its lower boundary, anxiety is infiltrating market participants. For example, per the chart below, the Cboe Market Volatility Index’s (VIX – 18.58) intraday high on Friday was 22, a level not seen since June.
Note that the 22 level has capped multiple VIX spikes this year, which might be considered a short-term risk for bears. Also, the VIX closed below 21, which is 50% above last month’s low and potentially a level where portfolio insurance buyers, whose activity can act as a coincidental headwind, viewed portfolio insurance as too expensive.
Last week’s VIX spike is in the context of the SPX above range lows and still above its September close.
As I said last week, I think it is worth it to pay more for portfolio insurance in reaction to a technical breakdown, as the levels I am focusing on must be breached before a serious move to the downside can occur.
There is gap risk with this strategy. If you are more risk-averse, you can front-run by hedging before you see technical deterioration.
Todd Salamone is Schaeffer's V.P. of Strategy.
Continue reading:
Mentioned In This Article
Latest News
| 51 min | |
| 2 hours | |
| 3 hours |
Neoclouds: Goldman Sachs Upgrades CoreWeave. Microsoft Shelves Nscale Project.
MSFT
Investor's Business Daily
|
| 3 hours | |
| 4 hours | |
| 4 hours | |
| 4 hours | |
| 4 hours | |
| 5 hours | |
| 5 hours |
Microsoft Pulls out of Nscale U.K. Data-Center Deal Over Power-Supply Issues
MSFT
The Wall Street Journal
|
| 8 hours | |
| Oct-18 | |
| Oct-18 | |
| Oct-17 | |
| Oct-17 |
