Why S&P 500 Put Buying Could Be a Good Sign for Bulls
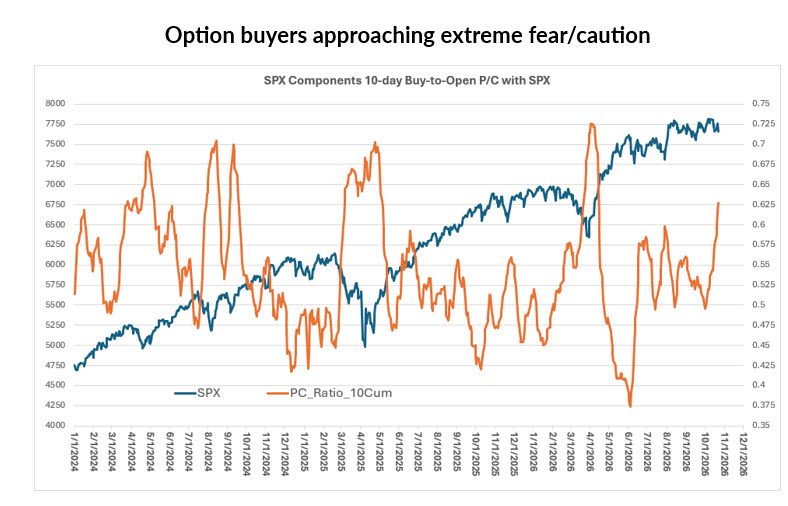
I typically don’t begin these commentaries with a chart. But if you glance at the chart above, which shows the buy-to-open put/call volume ratio for individual constituents of the S&P 500 Index (SPX—7,623.68) with SPX overlay, the sharp advance in the ratio is notable (higher ratios suggest fear, while lower ratios indicate optimism among option buyers).
In fact, put buying relative to call buying on SPX components has increased sharply from what was already a “middle-of-the-road” (neutral) level.
The current level of put buying relative to call buying is notable because:
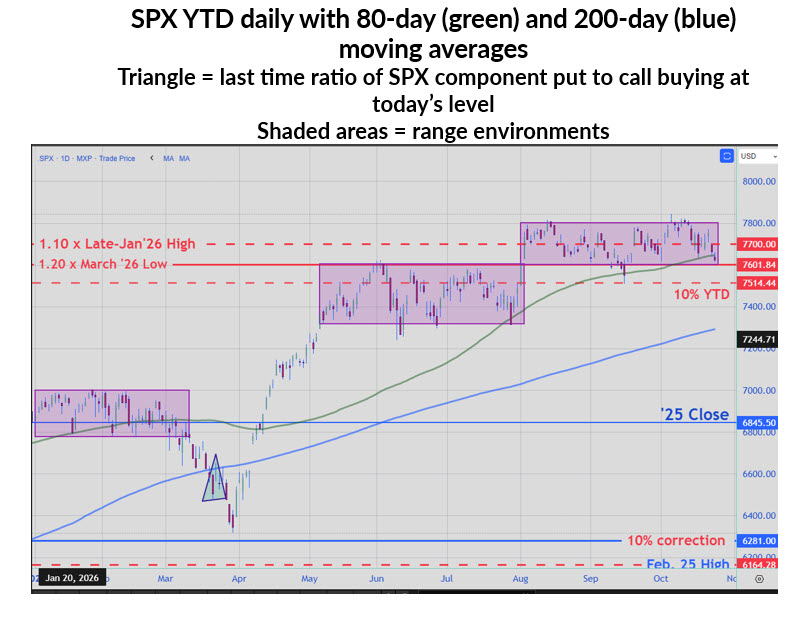
- The 10-day average of this ratio is on par with its mid-March level, when the SPX broke below its 200-day moving average.
- In mid-March, the SPX was nearly 7% below its prior month's high.
- At present, the SPX is at the bottom of a multi-week range, 4% above its 200-day moving average and just 3% below this month’s all-time closing high.
- Finally, amid the sharp increase in the put/call volume ratio, SPX breadth is improving, as measured by the percentage of SPX components above their 20-day and 50-day moving averages (see the second chart below).
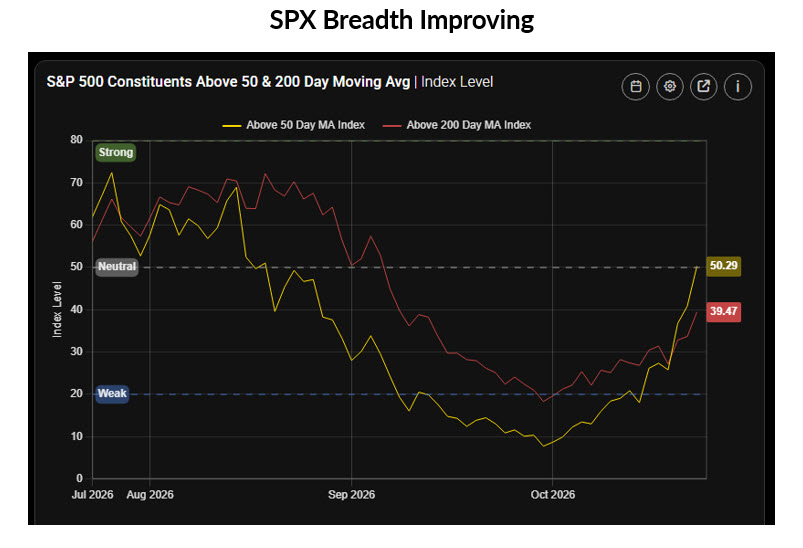
When market breadth was as bad as it was heading into and at the beginning of the month, one might expect the ratio of put buying to call buying to be at its current level.
However, the attention the AI trade is getting, along with the drubbing AI-related stocks took last week (particularly semiconductors), might explain what is going on in the options sentiment chart. It’s as if AI is the only game in town and therefore sentiment is swayed by the direction of these stocks.
With the SPX cap-weighted, it is sitting at range lows thanks to many mega-cap technology names declining last week. But it also hasn’t (yet) broken below range lows due to a clear rotation into mega-cap Apple (AAPL) and lower-weighted stocks within the index.
This sentiment may suggest that opportunities could lie elsewhere on the long side. It might even suggest that AI fears are approaching levels that might make the pullback in such stocks attractive. For example, the Invesco QQQ Trust (QQQ—704.40) enters the week just above the psychologically important 700 level, where buyers have surfaced on multiple occasions since May.
“Across global equities, Goldman Sachs Group Inc.’s prime brokerage desk says short sales have exceeded long purchases by a ratio of roughly five to one. Short leverage across its book sits in the 99th percentile over the past five years. Net leverage among fundamental long/short funds, a gauge of how much long exposure exceeds shorts, is near a three-year low, despite a rise in gross leverage…Net allocation to a Goldman Sachs basket of global AI stocks sits in the 38th percentile over the past year, while the group’s long/short ratio is in the sixth percentile…The desk’s summary of the data floats the phrase ‘short squeeze risk alert,’ followed by a question mark that reflects the uncertainty. The data shows hedge funds are hedged rather than sold out. Short exposure is elevated, net exposure is low and technology remains central to the positioning.”
The excerpt above reflects what we are seeing with respect to option buyers on SPX components combined with a improving breadth within the index. That is, fear and caution are growing to the point of raising short squeeze risk and technology is the focal point of this growing caution.
I will caution that in order for a broader technology short squeeze situation to occur, shorts must begin feeling pain. As such, if you are in a technology name experiencing recent weakness, buyer beware that shorts are not necessarily losing money and experiencing margin calls that create the environment for a short squeeze.
Looking ahead, it is admittedly crunch time if you are focusing on the SPX. It enters the last trading days of the month just above a level where buyers have surfaced in recent weeks. And as of now, the sentiment backdrop favors the bulls, as the fear is more reflective of a broken index from a technical perspective, even though the SPX is still trading significantly above longer-term moving averages as breadth improves. Additionally, the SPX has been higher in 15 of the past 20 Novembers. Of the five negative Novembers, three saw declines of less than 1%.
But the risk is that growing caution toward many notable mega-cap tech names will continue in the days ahead, creating a coincident headwind that could pressure these stocks and the indexes themselves.
But for now, stick to the plan. At risk of paying for higher portfolio insurance, implement a hedge if the SPX breaks significantly below range lows and the 80-day moving average.
Todd Salamone is Schaeffer's V.P. of Research
Continue reading:
Mentioned In This Article
Latest News
| 11 min | |
| 12 min | |
| 22 min | |
| 35 min | |
| 44 min | |
| 1 hour | |
| 1 hour | |
| 1 hour | |
| 1 hour | |
| 2 hours | |
| 2 hours | |
| 2 hours | |
| 2 hours | |
| 2 hours | |
| 3 hours |
