 |
| Market Cap | 2.47B | EPS (ttm) | 3.98 |
| P/E | 20.24 | EPS this Y | 31.14% |
| Forward P/E | 16.97 | EPS next Y | 3.49% |
| PEG | 1.35 | EPS past 5Y | 7.51% |
| P/S | 0.53 | EPS next 5Y | 15.00% |
| P/B | 2.26 | EPS Q/Q | 28.63% |
| Dividend | 1.35% | Sales Q/Q | 13.11% |
| Insider Own | 19.53% | Inst Own | 80.91% |
| Insider Trans | -0.30% | Inst Trans | 0.25% |
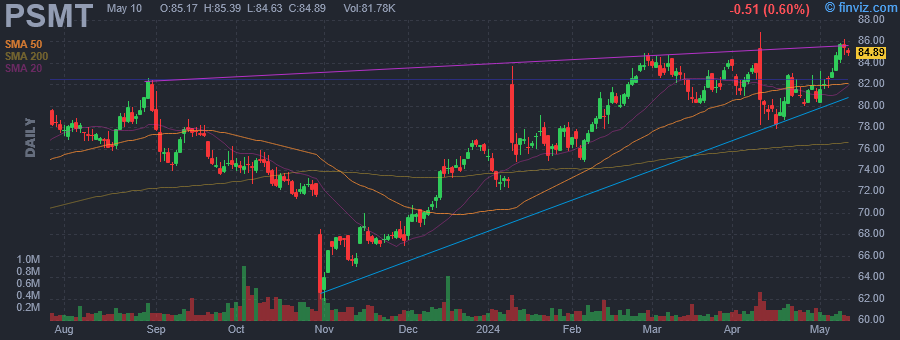
| Short Float | 2.87% | Earnings | Apr 09/a |
| Analyst Recom | 1.67 | Target Price | 87.33 |
| Avg Volume | 157.36K | 52W Range | 61.82 - 86.90 |
|
|
|
Apr-30-24 01:51PM
|
Hedge Fund and Insider Trading News: Louis Bacon, Weiss Multi-Strategy Advisers, SRS Investment Management, Elliott Management, Loar Holdings Inc (LOAR), Walmart Inc. (WMT), and More
(Insider Monkey) |
|
Apr-18-24 12:45PM
|
Looking for a Growth Stock? 3 Reasons Why PriceSmart (PSMT) is a Solid Choice
(Zacks) |
|
12:00PM
|
PriceSmart (PSMT) Upgraded to Buy: Here's What You Should Know
(Zacks) |
|
09:40AM
|
Is PriceSmart (PSMT) Stock Undervalued Right Now?
(Zacks) |
|
Apr-12-24 08:23AM
|
PriceSmart, Inc. (NASDAQ:PSMT) Q2 2024 Earnings Call Transcript
(Insider Monkey) |
|
Apr-10-24 04:20PM
|
These Stocks Moved the Most Today: Nvidia, Delta, Alibaba, Smart Global, Hexcel, Deckers, Luminar, and More
(Barrons.com) |
|
01:11PM
|
These Stocks Are Moving the Most Today: Nvidia, Delta, Alibaba, Smart Global, Hexcel, Deckers, Luminar, and More
(Barrons.com) |
|
Apr-09-24 08:53PM
|
PSMT Stock Earnings: Pricesmart Beats EPS, Beats Revenue for Q2 2024
(InvestorPlace) |
|
05:32PM
|
Pricesmart Inc (PSMT) Earnings Beat Estimates with Strong Q2 Performance
(GuruFocus.com) |
|
04:05PM
|
PriceSmart: Fiscal Q2 Earnings Snapshot
(Associated Press Finance) |
|
PriceSmart, Inc. engages in the business of managing membership shopping warehouse club concepts to emerging and developing countries. It operates through the following geographical segments: United States Operations, Central American Operations, Caribbean Operations, and Colombia Operations. The Central America Operations segment includes Panama, Guatemala, Costa Rica, El Salvador, Honduras, and Nicaragua. The Caribbean Operations segment focuses on Dominican Republic, Aruba, Barbados, Trinidad, U.S. Virgin Islands, and Jamaica. The company was founded by Sol Price and Robert E. Price in 1994 and is headquartered in San Diego, CA. |
| Insider Trading |
Relationship |
Date |
Transaction |
Cost |
#Shares |
Value ($) |
#Shares Total |
SEC Form 4 |
| HILDEBRANDT JOHN D | President and COO | Apr 29 '24 | Sale | 81.92 | 6,000 | 491,520 | 140,485 | Apr 30 09:37 PM | | Bahrambeygui Sherry S. | Director | Apr 29 '24 | Sale | 82.83 | 5,201 | 430,778 | 93,307 | Apr 30 09:30 PM | | Kovaleski Paul | EVP-Chief Merch. Officer | Apr 29 '24 | Sale | 81.72 | 1,176 | 96,099 | 44,950 | Apr 30 09:46 PM | | Bahrambeygui Sherry S. | Director | Apr 26 '24 | Sale | 80.52 | 1,500 | 120,780 | 98,508 | Apr 29 12:39 PM | | Hanson Gordon H. | Director | Apr 15 '24 | Sale | 79.86 | 937 | 74,829 | 7,969 | Apr 16 12:56 PM |
|
|
 |
 |
| Market Cap | 40.51B | EPS (ttm) | 0.36 |
| P/E | 231.55 | EPS this Y | 17.25% |
| Forward P/E | 46.83 | EPS next Y | 19.77% |
| PEG | 9.65 | EPS past 5Y | 13.20% |
| P/S | 20.82 | EPS next 5Y | 24.00% |
| P/B | 18.72 | EPS Q/Q | 36.99% |
| Dividend | - | Sales Q/Q | 23.45% |
| Insider Own | 9.82% | Inst Own | 69.29% |
| Insider Trans | -2.36% | Inst Trans | -0.25% |
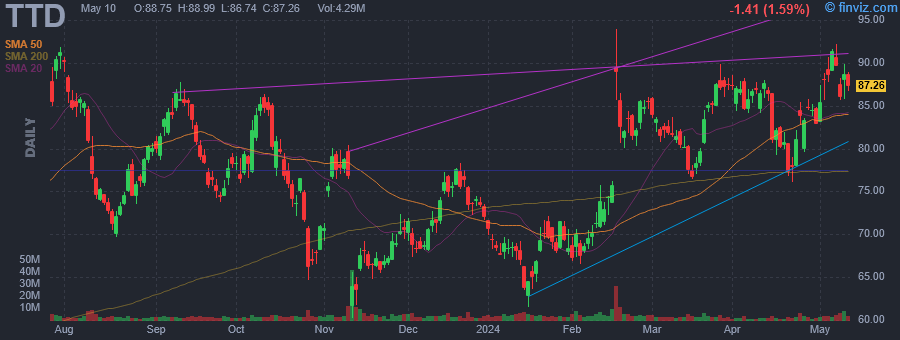
| Short Float | 2.01% | Earnings | May 08/a |
| Analyst Recom | 1.74 | Target Price | 97.85 |
| Avg Volume | 4.38M | 52W Range | 60.23 - 94.00 |
|
|
|
|
The Trade Desk, Inc. engages in the provision of a self-service and cloud-based ad-buying platform. It operates through the United States and International geographical segments. The firm offers omnichannel advertising, audience targeting, solutions for identity, application programming interface (API), custom, and programmatic, measurement and optimization. The company was founded by Jeffrey Terry Green and David Pickles in November 2009 and is headquartered in Ventura, CA. |
| Insider Trading |
Relationship |
Date |
Transaction |
Cost |
#Shares |
Value ($) |
#Shares Total |
SEC Form 4 |
| Green Jeffrey Terry | President and CEO | Apr 30 '24 | Sale | 84.08 | 63,936 | 5,375,807 | 760,086 | Apr 30 09:33 PM | | Green Jeffrey Terry | President and CEO | Apr 29 '24 | Sale | 84.47 | 75,000 | 6,335,331 | 824,022 | Apr 30 09:33 PM | | Green Jeffrey Terry | President and CEO | Apr 26 '24 | Sale | 85.13 | 75,000 | 6,384,750 | 899,022 | Apr 30 09:33 PM | | Green Jeffrey Terry | President and CEO | Apr 15 '24 | Sale | 86.41 | 2,600 | 224,666 | 974,022 | Apr 17 04:17 PM | | Green Jeffrey Terry | President and CEO | Apr 04 '24 | Sale | 87.29 | 75,000 | 6,546,437 | 976,622 | Apr 05 05:57 PM |
|
|
|
 |
| Market Cap | 4.66B | EPS (ttm) | 1.97 |
| P/E | 46.65 | EPS this Y | -0.40% |
| Forward P/E | 44.99 | EPS next Y | 5.72% |
| PEG | 3.11 | EPS past 5Y | 7.81% |
| P/S | 8.60 | EPS next 5Y | 15.00% |
| P/B | 13.05 | EPS Q/Q | 4.70% |
| Dividend | 1.22% | Sales Q/Q | 3.30% |
| Insider Own | 1.48% | Inst Own | 93.47% |
| Insider Trans | -1.63% | Inst Trans | -0.42% |
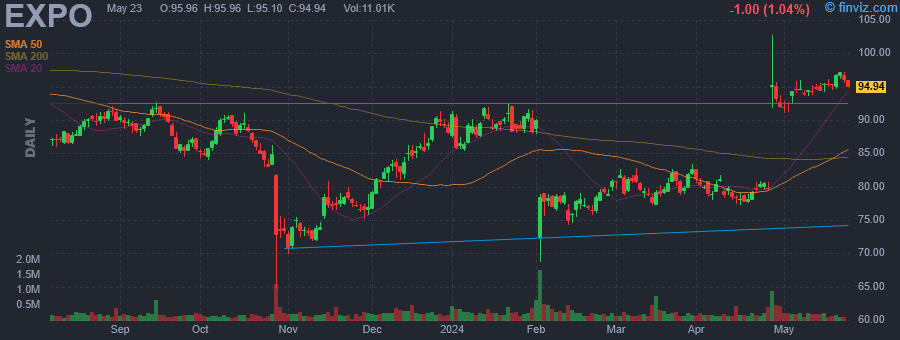
| Short Float | 2.87% | Earnings | Apr 25/a |
| Analyst Recom | 2.33 | Target Price | 94.00 |
| Avg Volume | 319.43K | 52W Range | 64.61 - 102.72 |
|
|
|
|
Exponent, Inc. is an engineering and scientific consulting company, which provides engineering, scientific, environmental, and health consulting services. It operates through the Engineering and Other Scientific, and Environmental and Health segments. The Engineering and Other Scientific segment includes technical consulting in different practices primarily in engineering. The Environmental and Health segment offers services in environmental, epidemiology, and health risk analysis. The company was founded by Bernard Ross in 1967 and is headquartered in Menlo Park, CA. |
| Insider Trading |
Relationship |
Date |
Transaction |
Cost |
#Shares |
Value ($) |
#Shares Total |
SEC Form 4 |
| Guyer Eric | Group Vice Presient | Apr 30 '24 | Sale | 92.58 | 1,650 | 152,762 | 1,846 | Apr 30 08:57 PM | | Guyer Eric | Group Vice Presient | Feb 09 '24 | Sale | 78.49 | 3,367 | 264,289 | 0 | Feb 09 04:18 PM | | SCHLENKER RICHARD L JR | EVP & Chief Financial Officer | Feb 06 '24 | Option Exercise | 17.70 | 5,648 | 99,970 | 288,990 | Feb 08 03:00 PM | | Reitman Maureen T. F. | Group Vice President | Nov 24 '23 | Sale | 78.25 | 2,000 | 156,500 | 28,729 | Nov 27 08:10 PM | | James Bradley A | Group Vice President | Nov 22 '23 | Sale | 78.98 | 600 | 47,388 | 6,984 | Nov 24 12:48 PM |
|
|
| |
 |
| Market Cap | 7.11B | EPS (ttm) | 1.51 |
| P/E | 89.02 | EPS this Y | -7.02% |
| Forward P/E | 34.08 | EPS next Y | 11.92% |
| PEG | 7.48 | EPS past 5Y | -15.29% |
| P/S | 3.47 | EPS next 5Y | 11.90% |
| P/B | 5.20 | EPS Q/Q | -16.24% |
| Dividend | - | Sales Q/Q | -11.04% |
| Insider Own | 7.73% | Inst Own | 95.92% |
| Insider Trans | -0.97% | Inst Trans | 3.93% |
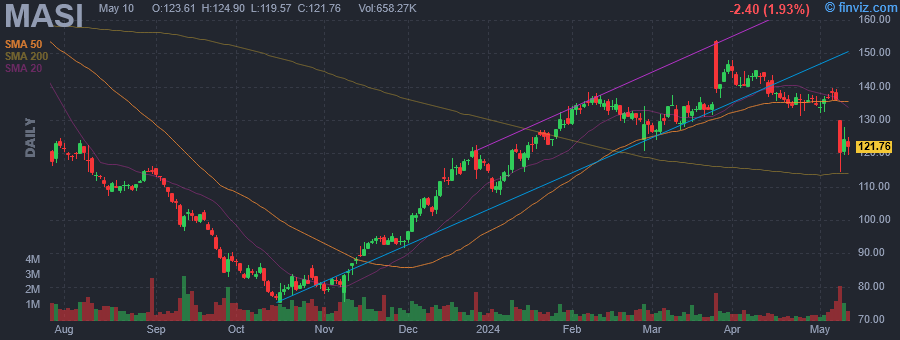
| Short Float | 8.28% | Earnings | May 07/a |
| Analyst Recom | 2.10 | Target Price | 150.60 |
| Avg Volume | 510.93K | 52W Range | 75.22 - 190.82 |
|
|
|
|
Masimo Corp. is a global technology company, which engages in the development, manufacture, and marketing of patient monitoring technologies, and automation and connectivity solutions. Its products include remote patient monitoring, connectivity, and hospital automation solutions, including Masimo Patient SafetyNet, Masimo Patient SafetyNet Surveillance, Masimo SafetyNet, Masimo SafetyNet-Open, Replica, Iris, MyView, UniView, Uniview: 60, Trace, Masimo Sleep, Centroid, and Bridge. The company was founded by Joe E. Kiani in May 1989 and is headquartered in Irvine, CA. |
| Insider Trading |
Relationship |
Date |
Transaction |
Cost |
#Shares |
Value ($) |
#Shares Total |
SEC Form 4 |
| REYNOLDS CRAIG B | Director | Apr 26 '24 | Option Exercise | 23.04 | 40,000 | 921,600 | 47,406 | Apr 30 08:11 PM | | REYNOLDS CRAIG B | Director | Apr 26 '24 | Sale | 136.17 | 40,000 | 5,446,616 | 7,406 | Apr 30 08:11 PM | | KIANI JOE E | CEO and Chairman of the Board | May 25 '23 | Buy | 157.16 | 6,365 | 1,000,342 | 366,055 | May 30 08:41 PM |
|
|
|
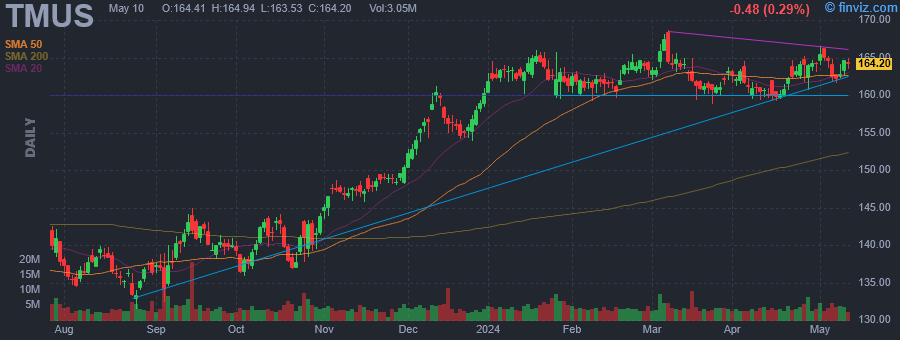 |
| Market Cap | 192.38B | EPS (ttm) | 7.35 |
| P/E | 22.34 | EPS this Y | 30.87% |
| Forward P/E | 14.66 | EPS next Y | 23.49% |
| PEG | 0.88 | EPS past 5Y | 15.59% |
| P/S | 2.45 | EPS next 5Y | 25.48% |
| P/B | 3.11 | EPS Q/Q | 26.03% |
| Dividend | 1.61% | Sales Q/Q | -0.19% |
| Insider Own | 62.74% | Inst Own | 38.79% |
| Insider Trans | -2.16% | Inst Trans | -1.03% |
| Short Float | 5.31% | Earnings | Apr 25/a |
| Analyst Recom | 1.52 | Target Price | 188.49 |
| Avg Volume | 4.38M | 52W Range | 124.92 - 168.64 |
|
|
|
|
T-Mobile US, Inc. engages in the provision of wireless communications services under the T-Mobile and MetroPCS brands. It offers postpaid and prepaid wireless voice, messaging and data services, and wholesale wireless services. The company was founded in 1994 and is headquartered in Bellevue, WA. |
| Insider Trading |
Relationship |
Date |
Transaction |
Cost |
#Shares |
Value ($) |
#Shares Total |
SEC Form 4 |
| DEUTSCHE TELEKOM AG | Director | Apr 30 '24 | Sale | 163.76 | 189,670 | 31,059,839 | 677,727,701 | Apr 30 07:38 PM | | DEUTSCHE TELEKOM AG | Director | Apr 29 '24 | Sale | 164.15 | 189,670 | 31,134,333 | 677,917,371 | Apr 30 07:38 PM | | DEUTSCHE TELEKOM AG | Director | Apr 26 '24 | Sale | 163.26 | 189,670 | 30,965,299 | 678,107,041 | Apr 26 08:21 PM | | DEUTSCHE TELEKOM AG | Director | Apr 25 '24 | Sale | 163.66 | 189,670 | 31,041,124 | 678,296,711 | Apr 26 08:21 PM | | DEUTSCHE TELEKOM AG | Director | Apr 24 '24 | Sale | 163.61 | 189,670 | 31,032,712 | 67,861,580 | Apr 26 08:21 PM |
|
|
| |
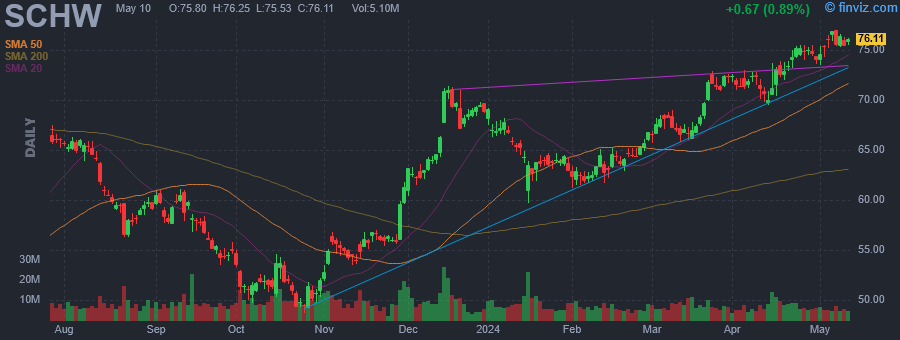 |
| Market Cap | 131.34B | EPS (ttm) | 2.39 |
| P/E | 30.99 | EPS this Y | 9.64% |
| Forward P/E | 16.51 | EPS next Y | 30.56% |
| PEG | 2.12 | EPS past 5Y | 0.75% |
| P/S | 5.13 | EPS next 5Y | 14.63% |
| P/B | 4.13 | EPS Q/Q | -18.29% |
| Dividend | 1.39% | Sales Q/Q | 1.35% |
| Insider Own | 5.92% | Inst Own | 84.87% |
| Insider Trans | -0.69% | Inst Trans | -0.60% |
| Short Float | 0.87% | Earnings | Apr 15/b |
| Analyst Recom | 1.96 | Target Price | 80.15 |
| Avg Volume | 7.29M | 52W Range | 45.65 - 75.55 |
|
|
|
|
The Charles Schwab Corp. is a savings and loan holding company, which engages in the provision of wealth management, securities brokerage, banking, asset management, custody, and financial advisory services. It operates through the Investor Services and Advisor Services segments. The Investor Services segment includes retail brokerage and banking services to individual investors, and retirement plan services, as well as other corporate brokerage services, to businesses and their employees. The Advisor Services segment provides custodial, trading, retirement business, and support services, as well as retirement business services to independent registered investment advisors, independent retirement advisors, and record keepers. The company was founded by Charles R. Schwab in 1986 and is headquartered in Westlake, TX. |
| Insider Trading |
Relationship |
Date |
Transaction |
Cost |
#Shares |
Value ($) |
#Shares Total |
SEC Form 4 |
| Schwab Charles R. | Co-Chairman | Apr 29 '24 | Sale | 74.78 | 59,906 | 4,480,010 | 61,038,701 | Apr 30 07:28 PM | | Schwab Charles R. | Co-Chairman | Apr 26 '24 | Sale | 74.96 | 59,905 | 4,490,419 | 61,098,607 | Apr 30 07:28 PM | | Crawford Peter B. | CFO | Apr 24 '24 | Option Exercise | 28.44 | 5,481 | 155,880 | 0 | Apr 26 05:20 PM | | Crawford Peter B. | CFO | Apr 24 '24 | Sale | 75.51 | 5,481 | 413,855 | 60,567 | Apr 26 05:20 PM | | Schwab Charles R. | Co-Chairman | Apr 22 '24 | Sale | 74.62 | 89,275 | 6,661,308 | 30,641,981 | Apr 24 06:43 PM |
|
|
|
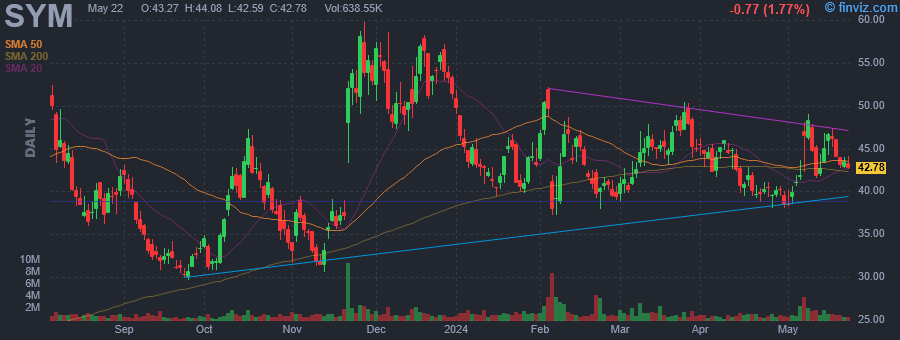 |
| Market Cap | 20.52B | EPS (ttm) | -0.28 |
| P/E | - | EPS this Y | 984.82% |
| Forward P/E | 78.73 | EPS next Y | 176.84% |
| PEG | - | EPS past 5Y | - |
| P/S | 15.33 | EPS next 5Y | - |
| P/B | 20.44 | EPS Q/Q | 81.30% |
| Dividend | - | Sales Q/Q | 78.59% |
| Insider Own | 67.27% | Inst Own | 17.34% |
| Insider Trans | -3.46% | Inst Trans | 0.08% |
| Short Float | 24.97% | Earnings | May 06/a |
| Analyst Recom | 1.53 | Target Price | 55.29 |
| Avg Volume | 1.47M | 52W Range | 22.40 - 64.14 |
|
|
|
|
Symbotic, Inc. is an automation technology company, which engages in a robotics and automation-based product movement technology platform. It focuses on developing, commercializing, and deploying innovative, end-to-end technology solutions for supply chain operations. It operates through the United States and Canada geographical segments. The company was founded by Richard B. Cohen on December 11, 2020 and is headquartered in Wilmington, MA. |
| Insider Trading |
Relationship |
Date |
Transaction |
Cost |
#Shares |
Value ($) |
#Shares Total |
SEC Form 4 |
| Boyd William M III | Chief Strategy Officer | Apr 26 '24 | Sale | 40.34 | 8,825 | 356,032 | 23,012 | Apr 30 07:20 PM | | Dunn Michael David | See Remarks | Apr 24 '24 | Sale | 40.08 | 1,747 | 70,016 | 74,032 | Apr 25 04:07 PM | | KRASNOW TODD | Director | Apr 05 '24 | Sale | 42.20 | 2,000 | 84,406 | 10,447 | Apr 09 05:18 PM | | Dunn Michael David | See Remarks | Apr 02 '24 | Sale | 43.29 | 5,444 | 235,674 | 71,366 | Apr 04 08:10 AM | | Dunn Michael David | See Remarks | Apr 01 '24 | Sale | 45.52 | 2,000 | 91,040 | 63,646 | Apr 04 08:10 AM |
|
|
| |
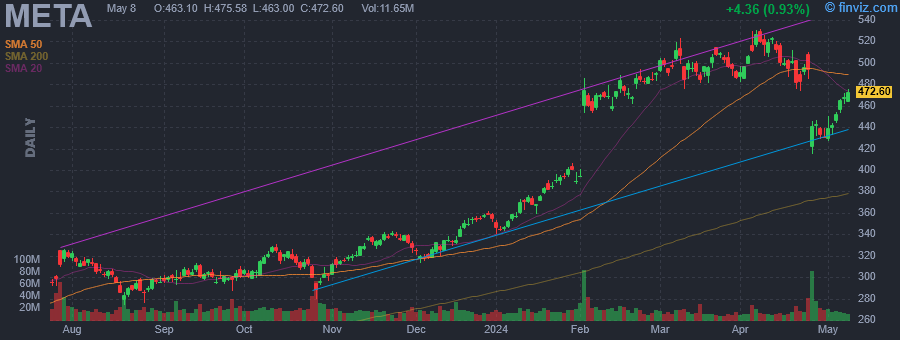 |
| Market Cap | 1091.14B | EPS (ttm) | 17.41 |
| P/E | 24.71 | EPS this Y | 35.50% |
| Forward P/E | 18.55 | EPS next Y | 15.06% |
| PEG | 0.82 | EPS past 5Y | 14.46% |
| P/S | 7.65 | EPS next 5Y | 30.00% |
| P/B | 7.30 | EPS Q/Q | 114.26% |
| Dividend | 0.42% | Sales Q/Q | 27.26% |
| Insider Own | 13.88% | Inst Own | 67.63% |
| Insider Trans | -1.46% | Inst Trans | -1.63% |
| Short Float | 1.24% | Earnings | Apr 24/a |
| Analyst Recom | 1.44 | Target Price | 524.80 |
| Avg Volume | 19.10M | 52W Range | 229.85 - 531.49 |
|
|
|
|
Meta Platforms, Inc. engages in the development of social media applications. It builds technology that helps people connect and share, find communities, and grow businesses. It operates through the Family of Apps (FoA) and Reality Labs (RL) segments. The FoA segment consists of Facebook, Instagram, Messenger, WhatsApp, and other services. The RL segment includes augmented, mixed and virtual reality related consumer hardware, software, and content. The company was founded by Mark Elliot Zuckerberg, Dustin Moskovitz, Chris R. Hughes, Andrew McCollum, and Eduardo P. Saverin on February 4, 2004, and is headquartered in Menlo Park, CA. |
| Insider Trading |
Relationship |
Date |
Transaction |
Cost |
#Shares |
Value ($) |
#Shares Total |
SEC Form 4 |
| Olivan Javier | Chief Operating Officer | Apr 26 '24 | Sale | 441.54 | 490 | 216,355 | 6,599 | Apr 30 06:51 PM | | Newstead Jennifer | Chief Legal Officer | Apr 23 '24 | Sale | 491.25 | 585 | 287,381 | 37,228 | Apr 25 06:24 PM | | Olivan Javier | Chief Operating Officer | Apr 19 '24 | Sale | 501.18 | 490 | 245,578 | 7,089 | Apr 23 06:14 PM | | Newstead Jennifer | Chief Legal Officer | Apr 16 '24 | Sale | 498.59 | 585 | 291,675 | 37,813 | Apr 18 06:05 PM | | Olivan Javier | Chief Operating Officer | Apr 12 '24 | Sale | 517.75 | 490 | 253,698 | 7,579 | Apr 16 06:10 PM |
|
|
|
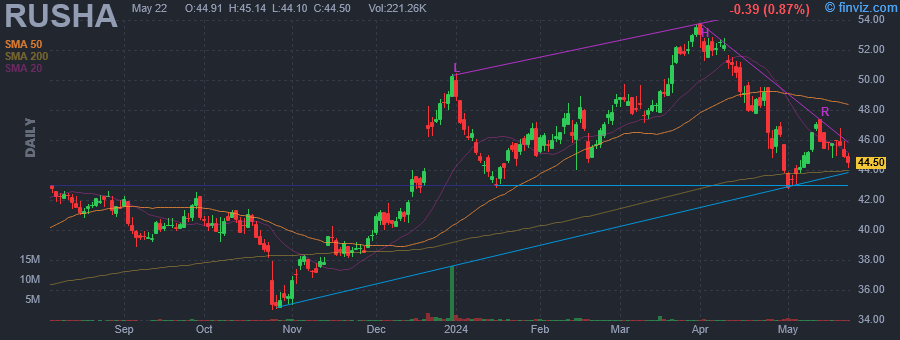 |
| Market Cap | 3.45B | EPS (ttm) | 4.54 |
| P/E | 9.68 | EPS this Y | -28.31% |
| Forward P/E | 11.12 | EPS next Y | 32.77% |
| PEG | - | EPS past 5Y | 22.00% |
| P/S | 0.44 | EPS next 5Y | -4.99% |
| P/B | 1.78 | EPS Q/Q | -44.97% |
| Dividend | 1.55% | Sales Q/Q | -2.08% |
| Insider Own | 22.30% | Inst Own | 84.06% |
| Insider Trans | -8.62% | Inst Trans | -2.26% |
| Short Float | 4.33% | Earnings | Apr 23/a |
| Analyst Recom | 1.00 | Target Price | 58.50 |
| Avg Volume | 335.78K | 52W Range | 33.37 - 53.78 |
|
|
|
|
Rush Enterprises, Inc. engages in the business of retailing commercial vehicles. It operates under the Truck and All Other segments. The Truck segment includes an operating network of commercial vehicle dealerships that provide an integrated one-stop source for the commercial vehicle needs of its customers, including retail sales of new and used commercial vehicles, aftermarket parts, service, and collision center facilities, and financial services, including the financing of new and used commercial vehicle purchases, insurance products, and truck leasing and rentals. The All Other segment focuses on the retail tire company, an insurance agency, and a guest ranch operation. The company was founded by W. Marvin Rush in 1965 and is headquartered in New Braunfels, TX. |
| Insider Trading |
Relationship |
Date |
Transaction |
Cost |
#Shares |
Value ($) |
#Shares Total |
SEC Form 4 |
| Wilder Jason | Senior Vice President | Apr 26 '24 | Option Exercise | 16.45 | 11,250 | 185,070 | 6,534 | Apr 30 06:45 PM | | Wilder Jason | Senior Vice President | Apr 26 '24 | Sale | 46.23 | 11,250 | 520,035 | 534 | Apr 30 06:45 PM | | Pollard Jody | Senior Vice President | Feb 15 '24 | Option Exercise | 12.04 | 11,250 | 135,450 | 14,027 | Feb 16 05:26 PM | | Pollard Jody | Senior Vice President | Feb 15 '24 | Sale | 48.28 | 11,250 | 543,202 | 2,777 | Feb 16 05:26 PM | | RUSH WILLIAM M RUSTY | CEO, President and COB | Dec 08 '23 | Option Exercise | 13.45 | 85,128 | 1,144,972 | 259,282 | Dec 08 06:08 PM |
|
|
|
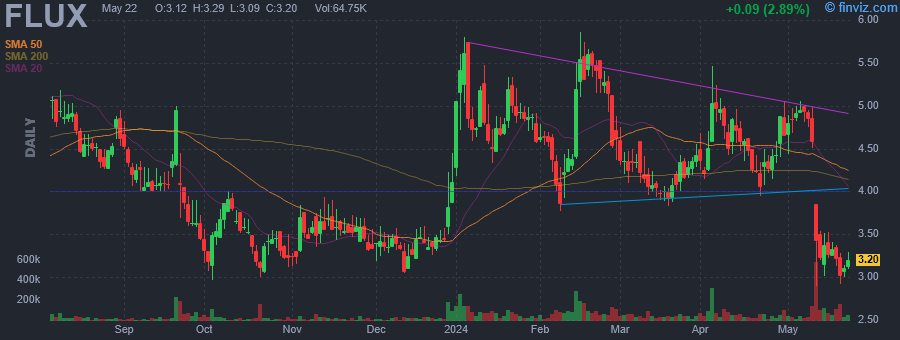 |
| Market Cap | 76.86M | EPS (ttm) | -0.36 |
| P/E | - | EPS this Y | 32.14% |
| Forward P/E | 42.27 | EPS next Y | 138.60% |
| PEG | - | EPS past 5Y | 31.08% |
| P/S | 1.19 | EPS next 5Y | - |
| P/B | 10.41 | EPS Q/Q | 53.00% |
| Dividend | - | Sales Q/Q | 6.91% |
| Insider Own | 27.31% | Inst Own | 37.70% |
| Insider Trans | -0.19% | Inst Trans | 3.67% |
| Short Float | 1.36% | Earnings | May 09/a |
| Analyst Recom | 1.00 | Target Price | 10.80 |
| Avg Volume | 74.07K | 52W Range | 2.97 - 5.86 |
|
|
|
|
Flux Power Holdings, Inc. engages in the design, development, and sale of rechargeable lithium-ion energy storage systems for industrial applications. It focuses on electric forklifts and airport ground support equipment. The company was founded by Christopher L. Anthony and Michael Johnson on September 21, 1998 and is headquartered in Vista, CA. |
| Insider Trading |
Relationship |
Date |
Transaction |
Cost |
#Shares |
Value ($) |
#Shares Total |
SEC Form 4 |
| Walters-Hoffert Lisa | Director | Apr 29 '24 | Sale | 4.50 | 534 | 2,403 | 27,050 | Apr 30 06:40 PM | | Walters-Hoffert Lisa | Director | Apr 22 '24 | Sale | 4.03 | 5,909 | 23,829 | 26,058 | Apr 22 09:56 PM | | DUTT RONALD F | CEO and President | Nov 02 '23 | Sale | 3.29 | 1,221 | 4,022 | 40,430 | Nov 06 06:52 PM | | Scheiwe Charles | CFO and Secretary | Nov 02 '23 | Sale | 3.29 | 638 | 2,102 | 14,028 | Nov 06 06:56 PM | | Mason Jeffrey Curtis | Vice President of Operations | Nov 02 '23 | Sale | 3.29 | 389 | 1,281 | 2,267 | Nov 06 06:54 PM |
|
|
|
