 |
| Market Cap | 4.29B | EPS (ttm) | -1.33 |
| P/E | - | EPS this Y | 63.44% |
| Forward P/E | 189.84 | EPS next Y | 344.90% |
| PEG | - | EPS past 5Y | -39.33% |
| P/S | 9.08 | EPS next 5Y | 30.00% |
| P/B | 9.59 | EPS Q/Q | 18.54% |
| Dividend | - | Sales Q/Q | 32.72% |
| Insider Own | 40.03% | Inst Own | 54.78% |
| Insider Trans | -0.83% | Inst Trans | 7.25% |
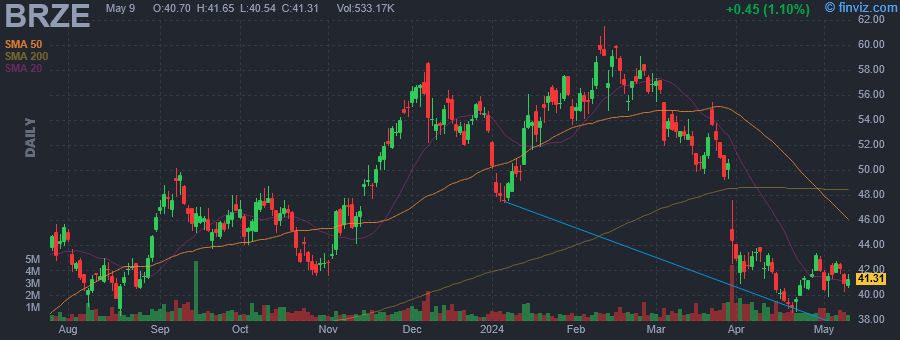
| Short Float | 6.93% | Earnings | Jun 06/a |
| Analyst Recom | 1.21 | Target Price | 65.91 |
| Avg Volume | 910.01K | 52W Range | 30.48 - 61.53 |
|
|
|
|
Braze, Inc. operates a customer relationship management platform for mobile applications. Its application combines messaging, audience segmentation, analytics and user support in a single integrated solution. The firm offers push notifications, email, in-app messages, and news feed services. The company was founded by Mark Ghermezian, William Magnuson, and Jonathan Hyman in 2011 and is headquartered in New York, NY. |
| Insider Trading |
Relationship |
Date |
Transaction |
Cost |
#Shares |
Value ($) |
#Shares Total |
SEC Form 4 |
| Kleeger Myles | Pres & CCO | May 20 '24 | Sale | 42.68 | 6,344 | 270,762 | 215,518 | May 20 06:54 PM | | Winkles Isabelle | Chief Financial Officer | May 20 '24 | Sale | 42.68 | 4,096 | 174,817 | 242,135 | May 20 06:56 PM | | Winkles Isabelle | Chief Financial Officer | May 17 '24 | Sale | 41.62 | 4,245 | 176,696 | 246,231 | May 20 06:56 PM | | Magnuson William | Chief Executive Officer | May 17 '24 | Sale | 42.11 | 86 | 3,621 | 618,589 | May 20 06:32 PM | | Kleeger Myles | Pres & CCO | May 17 '24 | Sale | 42.11 | 44 | 1,853 | 221,862 | May 20 06:54 PM |
|
|
 |
 |
| Market Cap | 120.25M | EPS (ttm) | -0.16 |
| P/E | - | EPS this Y | 906.20% |
| Forward P/E | 6.98 | EPS next Y | -16.30% |
| PEG | - | EPS past 5Y | -20.38% |
| P/S | 3.76 | EPS next 5Y | - |
| P/B | 0.98 | EPS Q/Q | - |
| Dividend | 23.94% | Sales Q/Q | 17.30% |
| Insider Own | 4.78% | Inst Own | 17.39% |
| Insider Trans | -26.95% | Inst Trans | - |
| Short Float | 0.36% | Earnings | - |
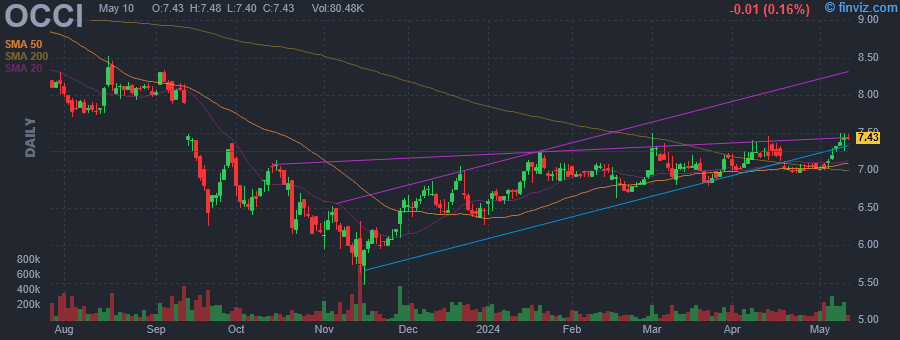
| Analyst Recom | 1.00 | Target Price | 7.50 |
| Avg Volume | 136.47K | 52W Range | 5.47 - 10.15 |
|
|
|
|
OFS Credit Company (NASDAQ: OCCI) is a non-diversified, publicly traded, closed-end management company that is registered under the Investment Company Act of 1940. Its objective is to generate current income, with a secondary objective of generating capital appreciation primarily through investment in collateralized loan obligation (CLO) equity and debt securities |
| Insider Trading |
Relationship |
Date |
Transaction |
Cost |
#Shares |
Value ($) |
#Shares Total |
SEC Form 4 |
| Eagle Point Credit Management | 10% Owner | May 17 '24 | Sale | 24.20 | 25 | 605 | 36,706 | May 20 06:50 PM | | Eagle Point Credit Management | 10% Owner | May 16 '24 | Sale | 24.14 | 263 | 6,348 | 33,451 | May 20 06:50 PM | | Eagle Point Credit Management | 10% Owner | May 15 '24 | Sale | 24.16 | 5,124 | 123,796 | 36,964 | May 15 08:01 PM | | Eagle Point Credit Management | 10% Owner | May 14 '24 | Sale | 23.29 | 801 | 18,655 | 33,481 | May 15 08:01 PM | | Eagle Point Credit Management | 10% Owner | May 13 '24 | Sale | 23.29 | 707 | 16,466 | 34,282 | May 15 08:01 PM |
|
|
|
 |
| Market Cap | 400.22M | EPS (ttm) | -1.85 |
| P/E | - | EPS this Y | 131.57% |
| Forward P/E | 13.10 | EPS next Y | 49.01% |
| PEG | - | EPS past 5Y | 7.69% |
| P/S | 1.35 | EPS next 5Y | - |
| P/B | 1.12 | EPS Q/Q | 41.26% |
| Dividend | - | Sales Q/Q | 1.16% |
| Insider Own | 4.89% | Inst Own | 86.47% |
| Insider Trans | 0.29% | Inst Trans | -6.59% |
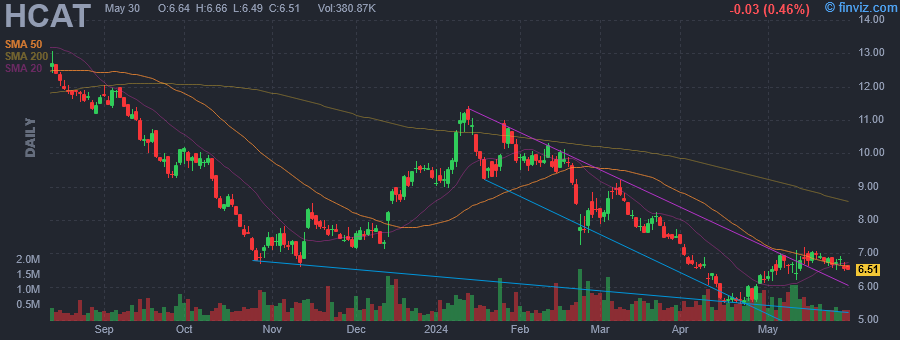
| Short Float | 3.44% | Earnings | May 09/a |
| Analyst Recom | 1.65 | Target Price | 11.67 |
| Avg Volume | 688.18K | 52W Range | 5.45 - 14.37 |
|
|
|
|
Health Catalyst, Inc. engages in the provision of data and analytics technology and services to healthcare organizations. It operates through the Technology and Professional Services segments. The Technology segment includes its data platform, analytics applications, and support services. The Professional Services segment combines analytics, implementation, strategic advisory, outsource, and improvement services to deliver expertise to its customers. The company was founded by Steven C. Barlow and Thomas D. Burton in 2008 and is headquartered in South Jordan, UT. |
| Insider Trading |
Relationship |
Date |
Transaction |
Cost |
#Shares |
Value ($) |
#Shares Total |
SEC Form 4 |
| Llewelyn Linda | Chief People Officer | May 15 '24 | Sale | 7.00 | 2,066 | 14,462 | 124,160 | May 20 06:35 PM | | Llewelyn Linda | Chief People Officer | Apr 15 '24 | Sale | 6.11 | 2,005 | 12,251 | 126,226 | Apr 17 04:31 PM | | Llewelyn Linda | Chief People Officer | Mar 15 '24 | Sale | 7.80 | 2,005 | 15,648 | 128,231 | Mar 19 05:04 PM | | Burton Daniel D. | Chief Executive Officer | Feb 27 '24 | Buy | 7.81 | 26,200 | 204,525 | 1,172,623 | Feb 27 04:01 PM | | Llewelyn Linda | Chief People Officer | Feb 15 '24 | Sale | 9.77 | 3,262 | 31,855 | 64,786 | Feb 20 04:10 PM |
|
|
| |
 |
| Market Cap | 10.46B | EPS (ttm) | 8.21 |
| P/E | 21.92 | EPS this Y | 0.96% |
| Forward P/E | 20.38 | EPS next Y | 12.82% |
| PEG | 2.06 | EPS past 5Y | 20.26% |
| P/S | 6.00 | EPS next 5Y | 10.63% |
| P/B | 7.08 | EPS Q/Q | 112.47% |
| Dividend | 0.21% | Sales Q/Q | 10.68% |
| Insider Own | 12.85% | Inst Own | 77.63% |
| Insider Trans | -0.23% | Inst Trans | 1.91% |
| Short Float | 3.94% | Earnings | May 01/a |
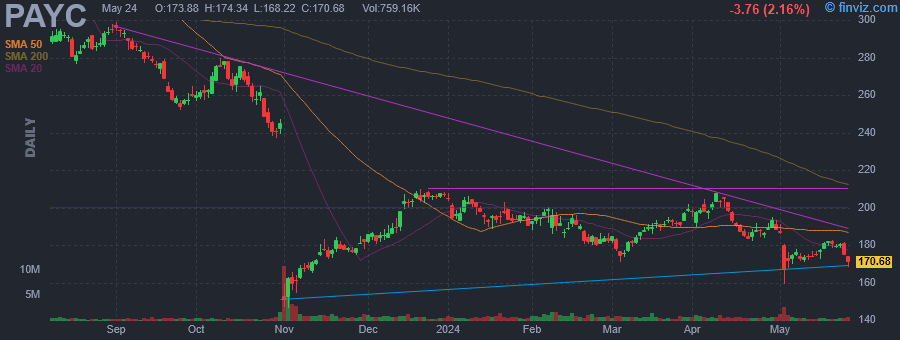
| Analyst Recom | 2.74 | Target Price | 190.01 |
| Avg Volume | 787.17K | 52W Range | 146.15 - 374.04 |
|
|
|
|
Paycom Software, Inc. engages in the provision of cloud-based human capital management software solutions delivered as software-as-a-service. It offers functionality and data analytics that businesses need to manage the complete employment life cycle from recruitment to retirement. The company was founded by Chad R. Richison in 1998 and is headquartered in Oklahoma City, OK. |
| Insider Trading |
Relationship |
Date |
Transaction |
Cost |
#Shares |
Value ($) |
#Shares Total |
SEC Form 4 |
| Richison Chad R. | Co-CEO, President and Chairman | May 17 '24 | Sale | 180.82 | 1,950 | 352,608 | 3,091,958 | May 20 06:32 PM | | Richison Chad R. | Co-CEO, President and Chairman | May 17 '24 | Sale | 180.82 | 1,950 | 352,608 | 3,669,049 | May 20 06:32 PM | | Smith Bradley Scott | Chief Information Officer | May 08 '24 | Sale | 172.15 | 2,925 | 503,551 | 16,293 | May 10 04:04 PM | | PETERS FREDERICK C II | Director | Feb 20 '24 | Sale | 189.87 | 1,500 | 284,805 | 15,067 | Feb 21 04:29 PM | | Richison Chad R. | President and CEO | Dec 14 '23 | Buy | 201.86 | 1 | 202 | 4,703,908 | Dec 15 04:05 PM |
|
|
|
 |
| Market Cap | 1.69B | EPS (ttm) | -2.18 |
| P/E | - | EPS this Y | -21.64% |
| Forward P/E | - | EPS next Y | -5.79% |
| PEG | - | EPS past 5Y | -3.94% |
| P/S | - | EPS next 5Y | 19.93% |
| P/B | 3.34 | EPS Q/Q | -18.51% |
| Dividend | - | Sales Q/Q | - |
| Insider Own | 9.41% | Inst Own | 93.38% |
| Insider Trans | -1.53% | Inst Trans | 4.30% |
| Short Float | 16.32% | Earnings | May 02/a |
| Analyst Recom | 1.23 | Target Price | 30.09 |
| Avg Volume | 866.64K | 52W Range | 7.41 - 24.17 |
|
|
|
|
Kura Oncology, Inc. operates as a clinical-stage biopharmaceutical company, which engages in the research and development of medicines for the treatment of cancer. Its pipeline includes Tipifarnib, which is a Farnesyl transferase inhibitor for HRAS Mutant Solid Tumors, Chronic Myelomonocytic Leukemia, KO-947, which is an ERK inhibitor for MAPK Pathway Tumors, and KO-539, which is a Menin MLL inhibitor for acute leukemias. The company was founded by Troy E. Wilson, Yi Liu, Pingda Ren and Antonio Gualberto on August 22, 2014 and is headquartered in San Diego, CA. |
| Insider Trading |
Relationship |
Date |
Transaction |
Cost |
#Shares |
Value ($) |
#Shares Total |
SEC Form 4 |
| Bair Teresa Brophy | Chief Legal Officer | May 20 '24 | Sale | 22.15 | 2,615 | 57,916 | 68,979 | May 20 06:30 PM | | DALE STEPHEN | Chief Medical Officer | Jan 30 '24 | Sale | 21.55 | 4,825 | 103,980 | 38,817 | Jan 31 05:30 PM | | DALE STEPHEN | Chief Medical Officer | Jan 29 '24 | Sale | 17.80 | 7,158 | 127,416 | 43,642 | Jan 31 05:30 PM | | DOYLE THOMAS JAMES | SVP, Finance & Accounting | Jan 29 '24 | Sale | 17.80 | 2,318 | 41,262 | 48,093 | Jan 31 05:30 PM | | Bair Teresa Brophy | Chief Legal Officer | Jan 29 '24 | Sale | 17.80 | 2,053 | 36,544 | 68,979 | Jan 31 05:30 PM |
|
|
| |
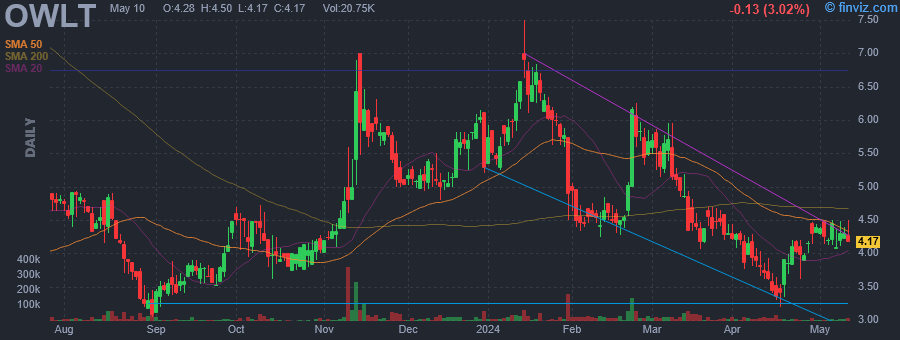 |
| Market Cap | 34.86M | EPS (ttm) | -3.50 |
| P/E | - | EPS this Y | 79.27% |
| Forward P/E | 22.66 | EPS next Y | 133.33% |
| PEG | - | EPS past 5Y | - |
| P/S | 0.60 | EPS next 5Y | 16.20% |
| P/B | - | EPS Q/Q | 67.25% |
| Dividend | - | Sales Q/Q | 37.39% |
| Insider Own | 48.85% | Inst Own | 9.35% |
| Insider Trans | -0.30% | Inst Trans | -23.64% |
| Short Float | 6.17% | Earnings | May 06/a |
| Analyst Recom | 1.00 | Target Price | 15.00 |
| Avg Volume | 22.73K | 52W Range | 2.52 - 7.50 |
|
|
|
|
Owlet, Inc. is a digital parenting platform, which engages in the provision of real-time data and insights, and parenting solutions. The firm is engaged in developing and marketing its products and content for children. It offers the Owlet BabySat, Owlet OTC Smart Sock, and Owlet Band products that allow the sharing of infant sleep and health data, and also provides an end-to-end digital healthcare solution for its customers. The company was founded by Kurt Workman, Zack Bomsta, Jordan Monroe, and Jake Colvin in 2013 and is headquartered in Lehi, UT. |
| Insider Trading |
Relationship |
Date |
Transaction |
Cost |
#Shares |
Value ($) |
#Shares Total |
SEC Form 4 |
| Scolnick Kathryn R. | Chief Financial Officer | May 16 '24 | Sale | 4.09 | 301 | 1,231 | 85,404 | May 20 06:28 PM | | Scolnick Kathryn R. | Chief Financial Officer | May 10 '24 | Sale | 4.22 | 2,789 | 11,770 | 85,705 | May 20 06:28 PM | | Workman Kurt | Chief Executive Officer | Mar 18 '24 | Sale | 4.47 | 897 | 4,010 | 207,284 | Mar 20 04:02 PM | | Scolnick Kathryn R. | Chief Financial Officer | Mar 18 '24 | Sale | 4.47 | 276 | 1,234 | 88,494 | Mar 20 04:01 PM | | Scolnick Kathryn R. | Chief Financial Officer | Mar 13 '24 | Sale | 4.96 | 7,267 | 36,044 | 88,770 | Mar 15 04:06 PM |
|
|
|
 |
| Market Cap | 3.35B | EPS (ttm) | 3.68 |
| P/E | 19.76 | EPS this Y | -65.80% |
| Forward P/E | 22.98 | EPS next Y | 92.10% |
| PEG | 1.32 | EPS past 5Y | 19.16% |
| P/S | 2.24 | EPS next 5Y | 15.00% |
| P/B | 1.92 | EPS Q/Q | -80.32% |
| Dividend | - | Sales Q/Q | -35.37% |
| Insider Own | 3.45% | Inst Own | 98.81% |
| Insider Trans | -4.18% | Inst Trans | 1.04% |
| Short Float | 3.95% | Earnings | May 09/a |
| Analyst Recom | 2.71 | Target Price | 76.80 |
| Avg Volume | 309.52K | 52W Range | 60.00 - 97.37 |
|
|
|
|
Diodes Inc. manufactures and supplies application-specific standard products within the broad discrete, logic, analog, and mixed-signal semiconductor markets. The firm offers diodes, rectifiers, transistors, MOSFETs, protection devices, functional specific arrays, single gate, dual gate and standard logic, amplifiers and comparators, Hall-effect, and temperature sensors. It operates through the following geographical segments: Asia, the Americas, and Europe. The company was founded on June 15, 1959 and is headquartered in Plano, TX. |
| Insider Trading |
Relationship |
Date |
Transaction |
Cost |
#Shares |
Value ($) |
#Shares Total |
SEC Form 4 |
| LU KEH SHEW | CEO | May 20 '24 | Sale | 73.93 | 6,000 | 443,605 | 102,996 | May 20 06:19 PM | | LU KEH SHEW | CEO | May 17 '24 | Sale | 73.40 | 1,500 | 110,100 | 108,996 | May 20 06:19 PM | | LU KEH SHEW | CEO | May 16 '24 | Sale | 72.70 | 9,000 | 654,300 | 110,496 | May 20 06:19 PM | | LU KEH SHEW | CEO | May 15 '24 | Sale | 73.17 | 8,456 | 618,754 | 119,496 | May 16 03:52 PM | | Tsong Andy | SVP Worldwide Analog Products | May 15 '24 | Sale | 73.22 | 2,282 | 167,081 | 33,427 | May 16 03:57 PM |
|
|
| |
 |
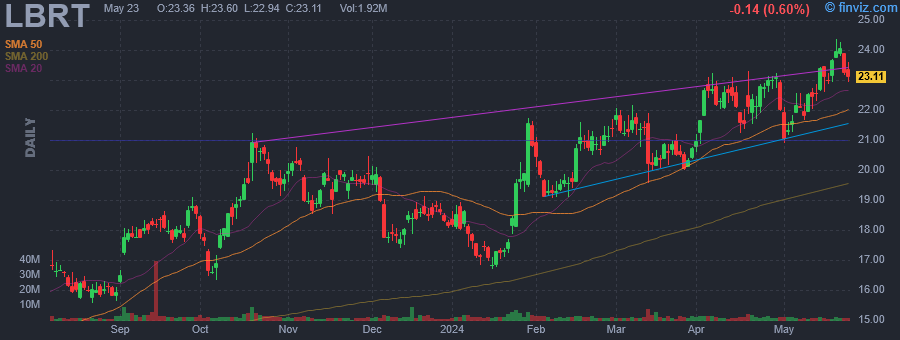
| Market Cap | 1.85B | EPS (ttm) | 3.30 |
| P/E | 5.04 | EPS this Y | 35.20% |
| Forward P/E | 4.63 | EPS next Y | 8.85% |
| PEG | - | EPS past 5Y | - |
| P/S | 1.05 | EPS next 5Y | - |
| P/B | 0.84 | EPS Q/Q | 202.41% |
| Dividend | - | Sales Q/Q | 120.39% |
| Insider Own | 53.51% | Inst Own | 34.74% |
| Insider Trans | -0.00% | Inst Trans | - |
| Short Float | 1.36% | Earnings | May 08/a |
| Analyst Recom | 1.00 | Target Price | 20.67 |
| Avg Volume | 353.08K | 52W Range | 12.44 - 16.97 |
|
|
|
|
Hamilton Insurance Group Ltd. is a holding company, which provides insurance and reinsurance services. It operates through the International and Bermuda segments. The International segment comprises of property, specialty, and casualty insurance and reinsurance classes of business originating from the company's London, Dublin, and Hamilton Select operations. The Bermuda segment offers property, specialty, and casualty insurance and reinsurance classes of business originating from Hamilton Re, Bermuda and Hamilton Re US and subsidiaries. The company was founded in 2013 and is headquartered in Hamilton, Bermuda. |
| Insider Trading |
Relationship |
Date |
Transaction |
Cost |
#Shares |
Value ($) |
#Shares Total |
SEC Form 4 |
| Patterson Alan Neil | Director | May 16 '24 | Buy | 16.66 | 21,135 | 352,109 | 21,135 | May 20 06:17 PM | | Deegan Brian John | Group Chief Accounting Officer | May 16 '24 | Sale | 16.70 | 22,000 | 367,400 | 18,957 | May 20 06:16 PM | | Gauthier John J | Director | Dec 11 '23 | Buy | 15.41 | 10,000 | 154,145 | 10,000 | Dec 12 06:15 PM | | Freda William C | Director | Nov 22 '23 | Sale | 15.00 | 5,099 | 76,485 | 214,994 | Nov 24 02:53 PM | | Bernhard Keith Donald | Group Chief Audit Officer | Nov 22 '23 | Sale | 15.00 | 2,610 | 39,150 | 67,134 | Nov 24 02:59 PM |
|
|
|
 |
| Market Cap | 3.99B | EPS (ttm) | 2.73 |
| P/E | 8.76 | EPS this Y | -22.33% |
| Forward P/E | 7.85 | EPS next Y | 23.75% |
| PEG | - | EPS past 5Y | 11.79% |
| P/S | 0.88 | EPS next 5Y | -1.00% |
| P/B | 2.10 | EPS Q/Q | -46.82% |
| Dividend | 1.18% | Sales Q/Q | -14.97% |
| Insider Own | 3.57% | Inst Own | 102.82% |
| Insider Trans | -7.56% | Inst Trans | -7.19% |
| Short Float | 9.64% | Earnings | Apr 17/a |
| Analyst Recom | 2.06 | Target Price | 25.36 |
| Avg Volume | 2.60M | 52W Range | 11.62 - 24.36 |
|
|
|
|
Liberty Energy, Inc. engages in the provision of hydraulic fracturing services to onshore oil and natural gas exploration for production companies in North America. The company was founded on December 21, 2016 and is headquartered in Denver, CO. |
| Insider Trading |
Relationship |
Date |
Transaction |
Cost |
#Shares |
Value ($) |
#Shares Total |
SEC Form 4 |
| Gosney Ryan T | Chief Accounting Officer | May 20 '24 | Sale | 24.00 | 4,000 | 96,000 | 166,882 | May 20 06:08 PM | | Gosney Ryan T | Chief Accounting Officer | May 17 '24 | Sale | 23.50 | 2,000 | 47,000 | 170,882 | May 20 06:08 PM | | Wright Christopher A | Chairman of the Board and CEO | May 03 '24 | Sale | 21.64 | 20,000 | 432,800 | 2,818,814 | May 03 07:50 PM | | Wright Christopher A | Chairman of the Board and CEO | May 02 '24 | Sale | 21.39 | 20,000 | 427,800 | 2,838,814 | May 03 07:50 PM | | Stock Michael | Chief Financial Officer | May 01 '24 | Sale | 21.83 | 20,000 | 436,596 | 825,209 | May 01 04:29 PM |
|
|
|
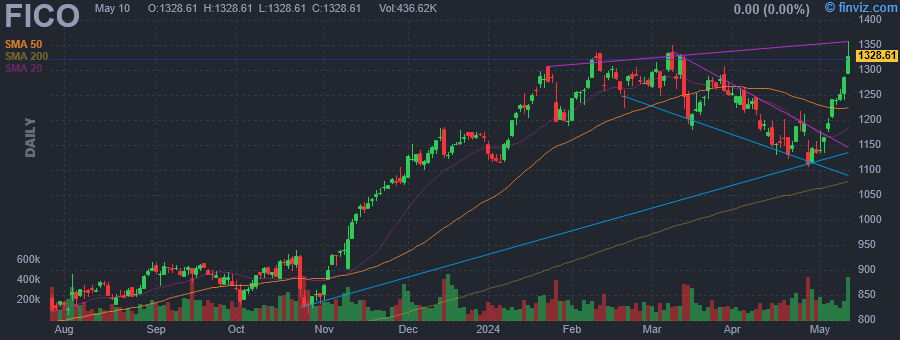 |
| Market Cap | 34.63B | EPS (ttm) | 19.06 |
| P/E | 73.54 | EPS this Y | 19.77% |
| Forward P/E | 48.22 | EPS next Y | 23.13% |
| PEG | 3.00 | EPS past 5Y | 33.07% |
| P/S | 21.59 | EPS next 5Y | 24.55% |
| P/B | - | EPS Q/Q | 29.17% |
| Dividend | - | Sales Q/Q | 14.08% |
| Insider Own | 2.71% | Inst Own | 87.35% |
| Insider Trans | -5.65% | Inst Trans | -0.60% |
| Short Float | 2.52% | Earnings | Apr 25/a |
| Analyst Recom | 2.71 | Target Price | 1285.82 |
| Avg Volume | 188.27K | 52W Range | 745.45 - 1451.78 |
|
|
|
|
Fair Isaac Corp. engages in the provision of decision management solutions. It operates through the Software and Scores segments. The Software segment includes pre-configured analytic and decision management solutions designed for a specific type of business need or process. The Scores segment focuses on business-to-business scoring solutions and services, business-to-consumer scoring solutions and services including myFICO solutions for consumers and associated professional services. The company was founded by Bill Fair and Earl Isaac in 1956 and is headquartered in San Jose, CA. |
| Insider Trading |
Relationship |
Date |
Transaction |
Cost |
#Shares |
Value ($) |
#Shares Total |
SEC Form 4 |
| Rees Joanna | Director | May 16 '24 | Sale | 1400.00 | 500 | 700,000 | 20,118 | May 20 05:50 PM | | Weber Steven P. | Executive Vice President & CFO | May 15 '24 | Option Exercise | 0.00 | 706 | 0 | 2,641 | May 17 09:24 PM | | Rees Joanna | Director | May 14 '24 | Sale | 1350.00 | 500 | 675,000 | 20,618 | May 16 05:17 PM | | Rees Joanna | Director | May 09 '24 | Sale | 1255.00 | 1,000 | 1,255,000 | 21,118 | May 13 04:47 PM | | LANSING WILLIAM J | President and CEO | Apr 16 '24 | Sale | 1140.55 | 8,000 | 9,124,370 | 12,638 | Apr 18 07:23 PM |
|
|
|
