 |
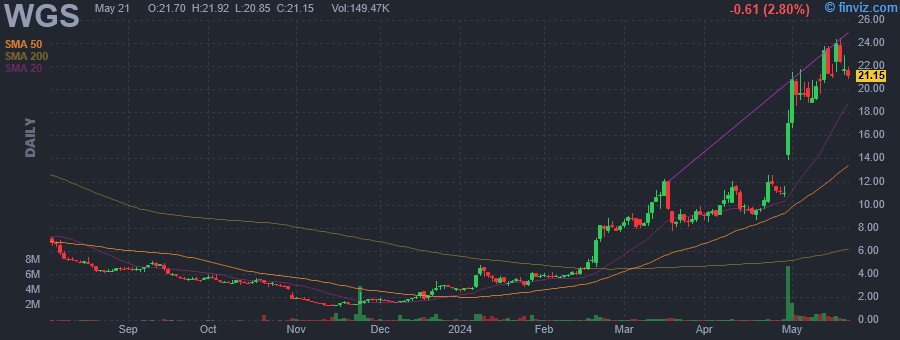
| Market Cap | 444.67M | EPS (ttm) | -7.51 |
| P/E | - | EPS this Y | 65.21% |
| Forward P/E | - | EPS next Y | 62.29% |
| PEG | - | EPS past 5Y | - |
| P/S | 2.20 | EPS next 5Y | - |
| P/B | 1.94 | EPS Q/Q | 96.22% |
| Dividend | - | Sales Q/Q | -6.41% |
| Insider Own | 37.76% | Inst Own | 42.36% |
| Insider Trans | -7.23% | Inst Trans | -11.90% |
| Short Float | 6.59% | Earnings | Apr 29/a |
| Analyst Recom | 2.00 | Target Price | 11.38 |
| Avg Volume | 194.86K | 52W Range | 1.16 - 12.57 |
|
|
|
|
GeneDx Holdings Corp. is a patient centered health intelligence company. It engages in transforming healthcare by applying AI and machine learning to multidimensional, longitudinal clinical and genomic data to build dynamic models of human health and defining optimal, individualized health trajectories. The firm, through its Centrellis health intelligence platform, generates a more complete understanding of disease and wellness and provides science-driven solutions to the most pressing medical needs. The company was founded by Eric Schadt in October 2015 and is headquartered in Stamford, CT. |
| Insider Trading |
Relationship |
Date |
Transaction |
Cost |
#Shares |
Value ($) |
#Shares Total |
SEC Form 4 |
| Feeley Kevin | CHIEF FINANCIAL OFFICER | Apr 29 '24 | Option Exercise | 0.00 | 3,013 | 0 | 31,940 | Apr 30 04:27 PM | | Stueland Katherine | Chief Executive Officer | Apr 29 '24 | Option Exercise | 0.00 | 15,496 | 0 | 82,194 | Apr 30 04:30 PM | | Stueland Katherine | Chief Executive Officer | Apr 29 '24 | Sale | 11.04 | 6,325 | 69,808 | 75,869 | Apr 30 04:30 PM | | Feeley Kevin | CHIEF FINANCIAL OFFICER | Apr 29 '24 | Sale | 11.04 | 1,104 | 12,185 | 30,836 | Apr 30 04:27 PM | | Stueland Katherine | CHIEF EXECUTIVE OFFICER | Mar 18 '24 | Sale | 10.59 | 8,559 | 90,661 | 66,698 | Mar 19 04:15 PM |
|
|
 |
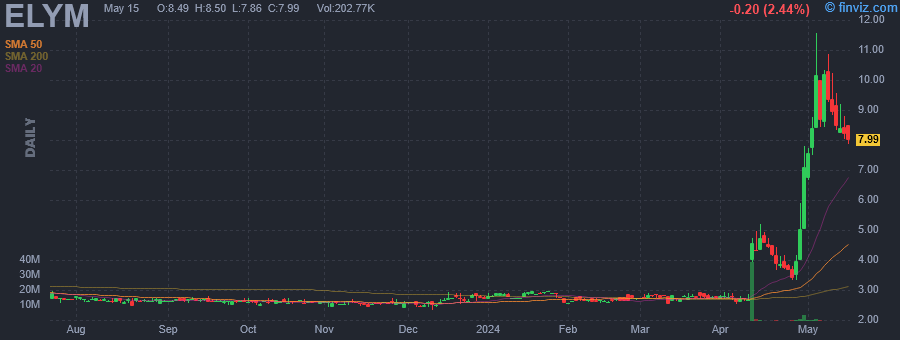 |
| Market Cap | 196.53M | EPS (ttm) | -1.31 |
| P/E | - | EPS this Y | - |
| Forward P/E | - | EPS next Y | - |
| PEG | - | EPS past 5Y | -46.72% |
| P/S | - | EPS next 5Y | - |
| P/B | 1.83 | EPS Q/Q | 55.35% |
| Dividend | - | Sales Q/Q | - |
| Insider Own | 33.48% | Inst Own | 60.84% |
| Insider Trans | 0.00% | Inst Trans | -1.37% |
| Short Float | 3.26% | Earnings | - |
| Analyst Recom | 3.00 | Target Price | 24.00 |
| Avg Volume | 751.46K | 52W Range | 2.34 - 5.89 |
|
|
|
|
Eliem Therapeutics, Inc. operates as a clinical-stage biotechnology company. It focuses on developing novel therapies for neuronal excitability disorders to address unmet needs in chronic pain, neuropsychiatry, epilepsy and other disorders of the peripheral and central nervous systems. Its clinical-stage candidates are ETX-810 and ETX-155. ETX-810 is a novel palmitoylethanolamide (PEA) prodrug initially being developed for the treatment of diabetic peripheral neuropathic pain (DPNP) and pain associated with lumbosacral radiculopathy. ETX-155 is a neurosteroid GABAA receptor positive allosteric modulator (PAM) initially being developed for major depressive disorder (MDD), perimenopausal depression (PMD) and focal onset seizures. The company was founded by Andrew D. Levin and Valerie Morisset on October 18, 2018 and is headquartered in Wilmington, DE. |
| Insider Trading |
Relationship |
Date |
Transaction |
Cost |
#Shares |
Value ($) |
#Shares Total |
SEC Form 4 |
| Morisset Valerie | EVP, R&D AND CSO | Apr 05 '24 | Option Exercise | 0.00 | 17,847 | 4 | 505,307 | Apr 08 05:33 PM | | Morisset Valerie | EVP, R&D AND CSO | Sep 20 '23 | Option Exercise | 0.00 | 20,728 | 14 | 487,460 | Mar 04 11:07 AM |
|
|
|
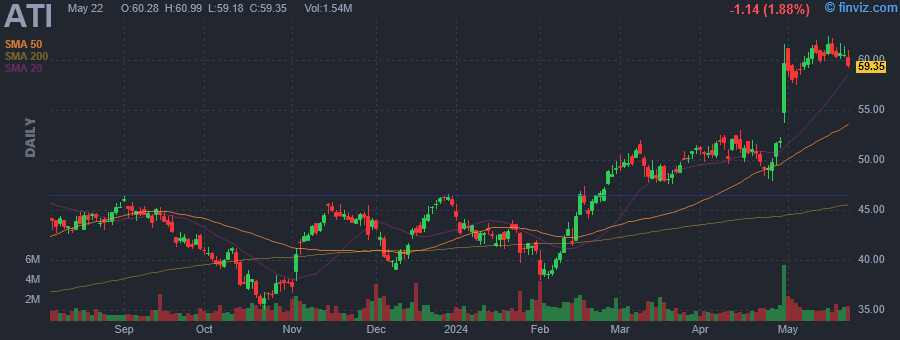 |
| Market Cap | 7.63B | EPS (ttm) | 2.52 |
| P/E | 23.66 | EPS this Y | -10.84% |
| Forward P/E | 19.95 | EPS next Y | 31.10% |
| PEG | 1.25 | EPS past 5Y | 11.74% |
| P/S | 1.83 | EPS next 5Y | 18.90% |
| P/B | 5.52 | EPS Q/Q | 87.66% |
| Dividend | - | Sales Q/Q | 5.30% |
| Insider Own | 1.39% | Inst Own | 105.35% |
| Insider Trans | -3.89% | Inst Trans | -0.91% |
| Short Float | 5.07% | Earnings | Apr 30/b |
| Analyst Recom | 1.20 | Target Price | 57.11 |
| Avg Volume | 1.33M | 52W Range | 34.10 - 52.98 |
|
|
|
|
ATI, Inc. engages in the manufacture of specialty materials and components. It operates through the High Performance Materials and Components and Advanced Alloys and Solutions segments. The High Performance Materials and Components segment consists of the production of materials, parts, and components for aerospace and defense, medical, and energy markets. The Advanced Alloys and Solutions segment includes the production of nickel-based alloys, titanium and titanium-based alloys, and alloys in a variety of forms including plate, sheet, and PRS products. The company was founded on August 15, 1996 and is headquartered in Dallas, TX. |
| Insider Trading |
Relationship |
Date |
Transaction |
Cost |
#Shares |
Value ($) |
#Shares Total |
SEC Form 4 |
| Davis Elliot S | Chief Legal & Compl. Officer | Feb 29 '24 | Sale | 49.12 | 45,351 | 2,227,641 | 123,927 | Mar 04 06:21 PM | | Harris Timothy J | Senior VP and CDIO | Feb 13 '24 | Sale | 41.88 | 6,325 | 264,891 | 103,006 | Feb 14 08:15 PM | | Harris Timothy J | Senior VP and CDIO | Feb 12 '24 | Sale | 42.44 | 6,325 | 268,433 | 109,331 | Feb 14 08:15 PM | | Davis Elliot S | Chief Legal & Compl. Officer | Jan 04 '24 | Sale | 43.06 | 1,789 | 77,034 | 136,050 | Jan 05 04:27 PM | | Davis Elliot S | Chief Legal & Compl. Officer | Jan 03 '24 | Sale | 43.37 | 12,123 | 525,775 | 123,927 | Jan 08 09:45 PM |
|
|
| |
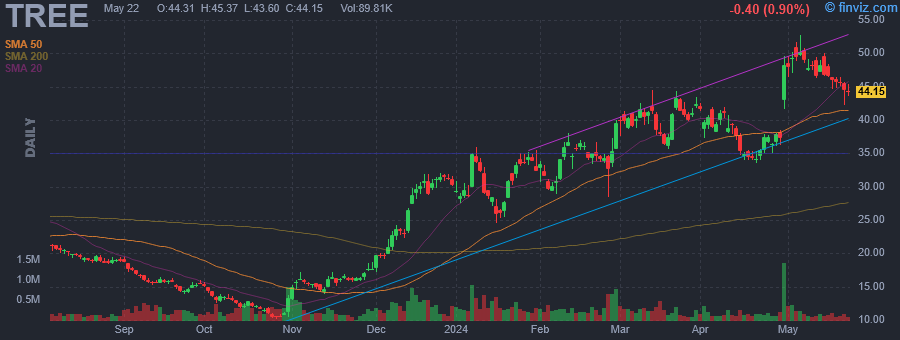 |
| Market Cap | 629.44M | EPS (ttm) | -9.42 |
| P/E | - | EPS this Y | 100.91% |
| Forward P/E | 79.55 | EPS next Y | 606.14% |
| PEG | - | EPS past 5Y | - |
| P/S | 0.94 | EPS next 5Y | - |
| P/B | 5.07 | EPS Q/Q | 220.10% |
| Dividend | - | Sales Q/Q | -33.51% |
| Insider Own | 17.67% | Inst Own | 68.67% |
| Insider Trans | 0.00% | Inst Trans | 3.34% |
| Short Float | 6.93% | Earnings | Apr 30/b |
| Analyst Recom | 1.50 | Target Price | 38.75 |
| Avg Volume | 255.47K | 52W Range | 10.12 - 44.51 |
|
|
|
|
LendingTree, Inc. engages in the operation of an online loan marketplace for consumers seeking loans and other credit-based offerings. It operates through the following segments: Home, Consumer, and Insurance. The Home segment refers to purchase mortgage, refinance mortgage, home equity loans and lines of credit and reverse mortgage loans and real estate. The Consumer segment includes credit cards, personal loans, small business loans, student loans, auto loans, deposit accounts and other credit products. The Insurance segment is composed of insurance quote products. The company was founded by Douglas Lebda in June 1996 and is headquartered in Charlotte, NC. |
| Insider Trading |
Relationship |
Date |
Transaction |
Cost |
#Shares |
Value ($) |
#Shares Total |
SEC Form 4 |
| LEBDA DOUGLAS R | Chairman & CEO | Mar 05 '24 | Option Exercise | 23.80 | 54,103 | 1,287,651 | 58,662 | Mar 06 07:39 PM | | LEBDA DOUGLAS R | Chairman & CEO | Aug 30 '23 | Sale | 18.95 | 130,000 | 2,464,150 | 0 | Sep 01 04:01 PM | | LEBDA DOUGLAS R | Chairman & CEO | Aug 29 '23 | Sale | 18.91 | 172,926 | 3,270,031 | 4,559 | Sep 01 04:01 PM | | LEBDA DOUGLAS R | Chairman & CEO | Aug 29 '23 | Sale | 18.91 | 84,859 | 1,604,684 | 130,000 | Sep 01 04:01 PM | | Olmstead Jill | Chief Human Resources Officer | Aug 02 '23 | Sale | 22.32 | 2,631 | 58,724 | 4,021 | Aug 03 06:10 PM |
|
|
|
 |
| Market Cap | 63.90M | EPS (ttm) | -0.02 |
| P/E | - | EPS this Y | - |
| Forward P/E | - | EPS next Y | - |
| PEG | - | EPS past 5Y | - |
| P/S | - | EPS next 5Y | - |
| P/B | 6.13 | EPS Q/Q | -974.36% |
| Dividend | - | Sales Q/Q | - |
| Insider Own | 46.28% | Inst Own | 49.10% |
| Insider Trans | 0.00% | Inst Trans | - |
| Short Float | 1.05% | Earnings | - |
| Analyst Recom | - | Target Price | - |
| Avg Volume | 24.62K | 52W Range | 10.24 - 14.00 |
|
|
|
|
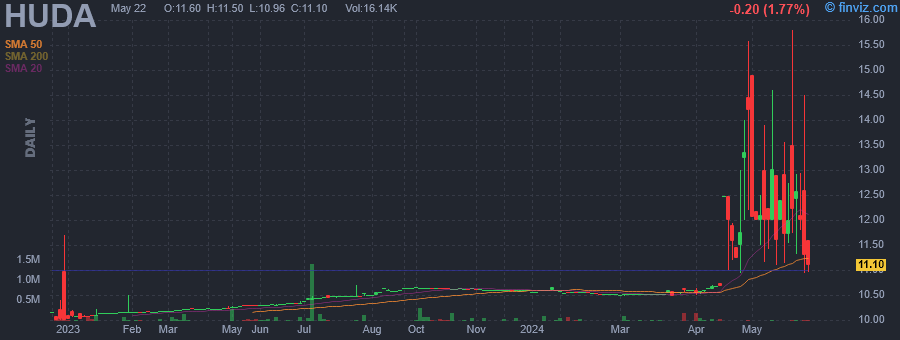
Hudson Acquisition I Corp. operates as a blank check company. It was formed for the purpose to effect a merger, capital stock exchange, asset acquisition, stock purchase, reorganization, or similar business combination with one or more businesses. The company was founded on January 13, 2021 and is headquartered in New York, NY. |
|
| |
 |
| Market Cap | 745.86M | EPS (ttm) | 6.36 |
| P/E | 7.08 | EPS this Y | -46.79% |
| Forward P/E | 9.25 | EPS next Y | 36.80% |
| PEG | 1.42 | EPS past 5Y | - |
| P/S | 0.36 | EPS next 5Y | 5.00% |
| P/B | 1.11 | EPS Q/Q | 400.20% |
| Dividend | - | Sales Q/Q | -2.64% |
| Insider Own | 2.95% | Inst Own | 90.38% |
| Insider Trans | 0.00% | Inst Trans | -7.04% |
| Short Float | 3.00% | Earnings | Apr 29/a |
| Analyst Recom | 3.00 | Target Price | 42.00 |
| Avg Volume | 199.73K | 52W Range | 29.22 - 44.21 |
|
|
|
|
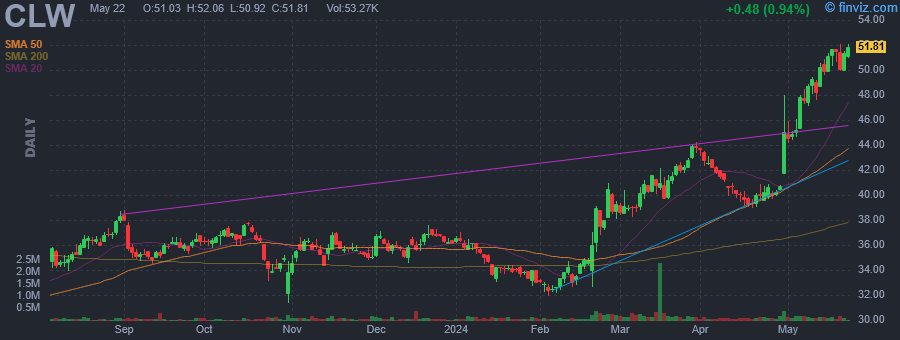
Clearwater Paper Corp. engages in the manufacturing and selling of private label tissue, paperboard, and pulp-based products. It operates through the Consumer Products and Pulp and Paperboard segments. The Consumer Products segment manufactures and sells a complete line of at-home tissue products. The Pulp and Paperboard segment produces and markets solid bleached sulfate paperboard for the high-end segment of the packaging industry and offers custom sheeting, slitting, and cutting of paperboard. The company was founded on December 9, 2008 and is headquartered in Spokane, WA. |
| Insider Trading |
Relationship |
Date |
Transaction |
Cost |
#Shares |
Value ($) |
#Shares Total |
SEC Form 4 |
| Gadd Michael S | Sr. Vice President | Aug 04 '23 | Sale | 35.68 | 6,182 | 220,574 | 61,843 | Aug 08 05:15 PM | | Barckley Rebecca Anne | VP, Controller | May 23 '23 | Sale | 33.00 | 2,506 | 82,698 | 8,378 | May 25 05:15 PM | | Gadd Michael S | Sr. Vice President | May 05 '23 | Sale | 32.09 | 6,126 | 196,583 | 68,025 | May 09 05:15 PM |
|
|
|
 |
| Market Cap | 23.00M | EPS (ttm) | -0.35 |
| P/E | - | EPS this Y | 22.00% |
| Forward P/E | - | EPS next Y | 48.72% |
| PEG | - | EPS past 5Y | 25.98% |
| P/S | 0.91 | EPS next 5Y | - |
| P/B | 1.83 | EPS Q/Q | -98.23% |
| Dividend | - | Sales Q/Q | -10.20% |
| Insider Own | 23.07% | Inst Own | 8.63% |
| Insider Trans | 3.15% | Inst Trans | -53.39% |
| Short Float | 0.64% | Earnings | Mar 21/b |
| Analyst Recom | 1.00 | Target Price | 2.85 |
| Avg Volume | 29.61K | 52W Range | 0.85 - 2.27 |
|
|
|
|
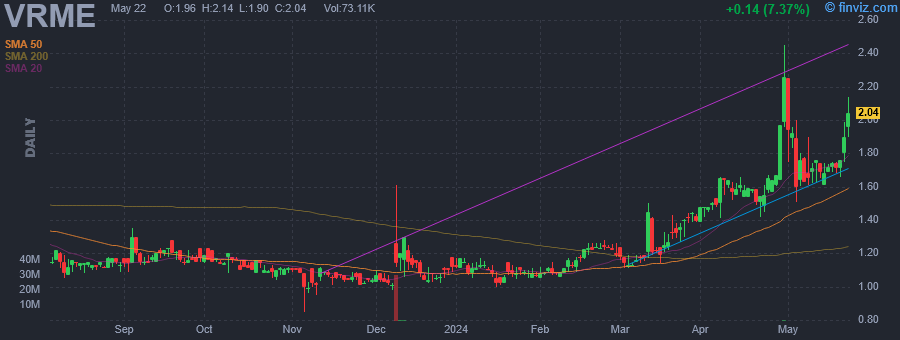
VerifyMe, Inc. engages in the provision of software driven predictive analytics logistics. It operates under the PeriShip Global Solutions and VerifyMe Solutions segments. The PeriShip Global Solutions segment offers a value-added service provider for time and temperature sensitive parcel management. The VerifyMe Solutions segment specializes in solutions that connect brands with consumers through their products. The company was founded by Norman A. Gardner on November 10, 1999 and is headquartered in Lake Mary, FL. |
| Insider Trading |
Relationship |
Date |
Transaction |
Cost |
#Shares |
Value ($) |
#Shares Total |
SEC Form 4 |
| LAFFER ARTHUR B | Director | Mar 25 '24 | Buy | 1.36 | 7,395 | 10,035 | 279,911 | Mar 26 04:29 PM | | LAFFER ARTHUR B | Director | Mar 25 '24 | Buy | 1.37 | 3,700 | 5,065 | 47,925 | Mar 26 04:29 PM | | Stedham Adam H | Chief Executive Officer | Dec 26 '23 | Buy | 1.04 | 14,441 | 15,019 | 169,909 | Dec 28 04:32 PM | | Stedham Adam H | Chief Executive Officer | Dec 22 '23 | Buy | 1.04 | 1,726 | 1,795 | 155,468 | Dec 26 04:31 PM | | Stedham Adam H | Chief Executive Officer | Dec 21 '23 | Buy | 1.04 | 227 | 236 | 153,742 | Dec 26 04:31 PM |
|
|
| |
 |
| Market Cap | 3.62B | EPS (ttm) | 1.11 |
| P/E | 30.70 | EPS this Y | 26.84% |
| Forward P/E | 20.02 | EPS next Y | 19.91% |
| PEG | 2.56 | EPS past 5Y | 13.76% |
| P/S | 2.49 | EPS next 5Y | 12.00% |
| P/B | 2.78 | EPS Q/Q | 38.64% |
| Dividend | - | Sales Q/Q | 5.48% |
| Insider Own | 1.59% | Inst Own | 102.29% |
| Insider Trans | -3.03% | Inst Trans | 0.79% |
| Short Float | 2.32% | Earnings | Apr 30/b |
| Analyst Recom | 1.38 | Target Price | 38.44 |
| Avg Volume | 558.40K | 52W Range | 19.56 - 33.83 |
|
|
|
|
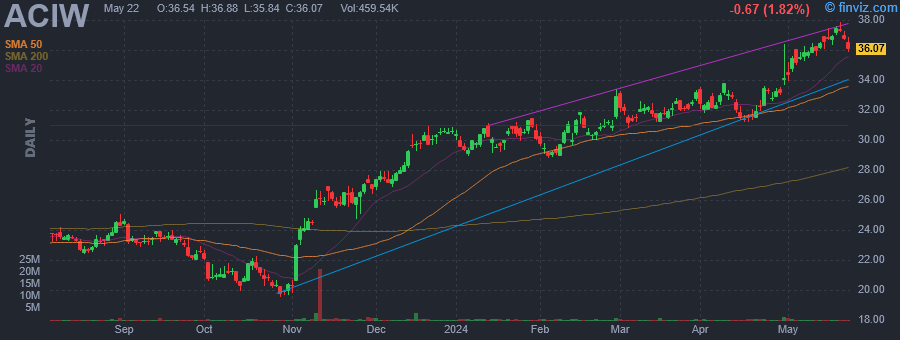
ACI Worldwide, Inc. engages in the development, marketing, installation, and support of software products and solutions primarily focused on facilitating real-time electronic payments. It operates through the following segments: ACI on Premise and ACI on Demand. The ACI on Premise segment serves customers who manage their software on site. The ACI on Demand segment covers the needs of banks, financial intermediaries, merchants, and corporates who use payments to facilitate their core business. The company was founded in 1975 and is headquartered in Elkhorn, NE. |
| Insider Trading |
Relationship |
Date |
Transaction |
Cost |
#Shares |
Value ($) |
#Shares Total |
SEC Form 4 |
| Silva Alessandro | Chief Revenue Officer | Dec 04 '23 | Sale | 27.72 | 17,817 | 493,807 | 52,062 | Dec 06 05:51 PM | | Behrens Scott W | Chief Financial Officer | Dec 01 '23 | Option Exercise | 20.51 | 39,540 | 811,096 | 465,168 | Dec 05 05:58 PM | | Behrens Scott W | Chief Financial Officer | Dec 01 '23 | Sale | 26.94 | 35,003 | 942,995 | 430,165 | Dec 05 05:58 PM | | Guerra Deborah L | Chief Product Officer | Aug 08 '23 | Sale | 23.22 | 3,426 | 79,551 | 51,724 | Aug 10 05:48 PM | | Warsop Thomas W III | Director, President and CEO | Jun 07 '23 | Buy | 24.16 | 3,333 | 80,535 | 178,307 | Jun 08 05:51 PM |
|
|
|
 |
| Market Cap | 18.95B | EPS (ttm) | 1.42 |
| P/E | 98.68 | EPS this Y | 8.31% |
| Forward P/E | 16.06 | EPS next Y | 10.44% |
| PEG | 10.44 | EPS past 5Y | -17.61% |
| P/S | 1.23 | EPS next 5Y | 9.45% |
| P/B | 4.53 | EPS Q/Q | 29.38% |
| Dividend | 1.11% | Sales Q/Q | 7.65% |
| Insider Own | 1.21% | Inst Own | 76.89% |
| Insider Trans | -1.44% | Inst Trans | -1.75% |
| Short Float | 1.06% | Earnings | Apr 30/b |
| Analyst Recom | 1.65 | Target Price | 141.84 |
| Avg Volume | 885.54K | 52W Range | 76.58 - 132.34 |
|
|
|
|
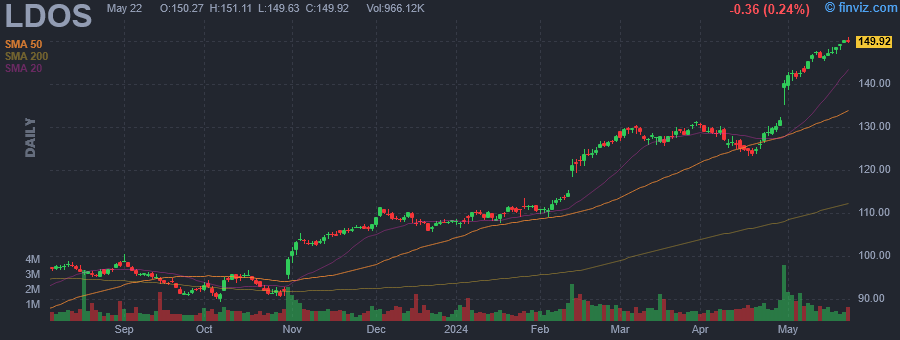
Leidos Holdings, Inc. engages in providing services and solutions in the defense, intelligence, civil and health markets. It operates through the following three segments: Defense Solutions, Civil, and Health. The Defense Solutions segment provides services, solutions, and products focusing on digital modernization, mission systems and integration, command, control, computers, communications, intelligence, surveillance and reconnaissance technologies and services, maritime solutions, transformative software, analytics, intelligence analysis, mission support and logistics services, weapons systems and space systems and solutions. The Civil segment focuses on modernizing infrastructure, systems, and security. The Health segment offers solutions to federal and commercial customers that are responsible for the health and wellbeing of people worldwide including service members and veterans. The company was founded by John Robert Beyster on February 3, 1969 and is headquartered in Reston, VA. |
| Insider Trading |
Relationship |
Date |
Transaction |
Cost |
#Shares |
Value ($) |
#Shares Total |
SEC Form 4 |
| Fubini David G | Director | Mar 13 '24 | Sale | 127.89 | 7,874 | 1,006,969 | 14,696 | Mar 14 06:18 PM | | Dahlberg Gregory R | Director | Feb 26 '24 | Option Exercise | 52.70 | 4,788 | 252,328 | 20,195 | Feb 27 04:52 PM | | Hull Stephen Edward | Sector President | Feb 26 '24 | Option Exercise | 53.54 | 3,423 | 183,267 | 27,583 | Feb 27 04:47 PM | | Geer Noel B | Director | Feb 22 '24 | Option Exercise | 52.70 | 4,788 | 252,328 | 29,925 | Feb 23 05:18 PM | | May Gary Stephen | Director | Feb 21 '24 | Option Exercise | 52.70 | 4,788 | 252,328 | 16,140 | Feb 22 04:59 PM |
|
|
|
 |
| Market Cap | 61.72M | EPS (ttm) | -0.06 |
| P/E | - | EPS this Y | - |
| Forward P/E | - | EPS next Y | - |
| PEG | - | EPS past 5Y | 2.38% |
| P/S | - | EPS next 5Y | - |
| P/B | 2.38 | EPS Q/Q | -40.78% |
| Dividend | - | Sales Q/Q | - |
| Insider Own | 22.69% | Inst Own | 19.28% |
| Insider Trans | -0.03% | Inst Trans | -2.23% |
| Short Float | 0.11% | Earnings | - |
| Analyst Recom | 1.00 | Target Price | 0.80 |
| Avg Volume | 129.07K | 52W Range | 0.43 - 0.74 |
|
|
|
|
Solitario Resources Corp. is a mineral exploration company, which engages in the acquisition and exploration of precious metals and zinc-related exploration mineral properties. Its projects include Florida Canyon in Peru, Lik Zinc in Alaska, and La Promesa in Peru. The company was founded on November 15, 1984 and is headquartered in Wheat Ridge, CO. |
| Insider Trading |
Relationship |
Date |
Transaction |
Cost |
#Shares |
Value ($) |
#Shares Total |
SEC Form 4 |
| Hesketh James KB | Director | Apr 04 '24 | Sale | 0.72 | 4,900 | 3,528 | 158,600 | Apr 05 11:37 AM | | Hesketh James KB | Director | Oct 20 '23 | Buy | 0.31 | 63,500 | 19,685 | 163,500 | Oct 24 12:20 PM |
|
|
|
