 |
| Market Cap | 13.18B | EPS (ttm) | 1.53 |
| P/E | 19.22 | EPS this Y | 7.47% |
| Forward P/E | 15.84 | EPS next Y | 7.91% |
| PEG | 2.60 | EPS past 5Y | - |
| P/S | 2.51 | EPS next 5Y | 7.40% |
| P/B | 1.67 | EPS Q/Q | 7.31% |
| Dividend | 3.60% | Sales Q/Q | -13.21% |
| Insider Own | 0.38% | Inst Own | 95.17% |
| Insider Trans | -3.10% | Inst Trans | -2.30% |
| Short Float | 1.71% | Earnings | May 08/b |
| Analyst Recom | 1.54 | Target Price | 31.46 |
| Avg Volume | 4.53M | 52W Range | 22.86 - 29.40 |
|
|
|
|
NiSource, Inc. is a holding company, which engages in the provision of energy solutions. It operates under the Gas Distribution Operations and Electric Operations segments. The Gas Distribution Operations segment provides natural gas service and transportation for residential, commercial, and industrial customers. The Electric Operations segment includes generation, transmission, and distribution of electricity through NIPSCO, and wholesaling electric and transmission transactions. The company was founded in 1987 and is headquartered in Merrillville, IN. |
| Insider Trading |
Relationship |
Date |
Transaction |
Cost |
#Shares |
Value ($) |
#Shares Total |
SEC Form 4 |
| Gode Gunnar | VP & Chief Accounting Officer | Mar 15 '24 | Sale | 26.46 | 950 | 25,133 | 28,526 | Mar 19 04:22 PM | | Brown Donald Eugene | EVP & Chief Innovation Officer | Mar 06 '24 | Sale | 26.78 | 37,490 | 1,003,982 | 195,855 | Mar 07 04:16 PM | | Berman Melanie B. | SVP & CHRO | Mar 05 '24 | Sale | 26.66 | 11,141 | 296,963 | 23,720 | Mar 07 04:12 PM | | Jesanis Michael E | Director | Nov 28 '23 | Sale | 26.24 | 5,000 | 131,200 | 48,070 | Nov 30 05:02 PM | | Yates Lloyd M | Director and President & CEO | Aug 23 '23 | Buy | 26.44 | 40,000 | 1,057,600 | 131,242 | Aug 25 04:05 PM |
|
|
 |
 |
| Market Cap | 5.56B | EPS (ttm) | -4.31 |
| P/E | - | EPS this Y | 122.75% |
| Forward P/E | 58.00 | EPS next Y | 21.44% |
| PEG | - | EPS past 5Y | - |
| P/S | 7.88 | EPS next 5Y | 18.20% |
| P/B | 6.84 | EPS Q/Q | 1933.70% |
| Dividend | - | Sales Q/Q | 38.83% |
| Insider Own | 1.08% | Inst Own | 86.21% |
| Insider Trans | -0.95% | Inst Trans | 2.21% |
| Short Float | 3.05% | Earnings | Mar 04/a |
| Analyst Recom | 1.83 | Target Price | 180.60 |
| Avg Volume | 412.91K | 52W Range | 88.24 - 197.92 |
|
|
|
|
AeroVironment, Inc. engages in the design, development, production, support and operation of unmanned aircraft systems and electric transportation solutions. The company was founded by Paul B. MacCready, Jr. in July 1971 and is headquartered in Arlington, VA. |
| Insider Trading |
Relationship |
Date |
Transaction |
Cost |
#Shares |
Value ($) |
#Shares Total |
SEC Form 4 |
| Stevenson Trace E | Sr. VP | Mar 07 '24 | Sale | 183.00 | 1,913 | 350,079 | 2,570 | Mar 08 07:00 PM | | Brown Melissa Ann | SVP, Gen. Counsel, Corp. Sec. | Mar 07 '24 | Sale | 176.77 | 1,000 | 176,770 | 12,339 | Mar 11 11:51 AM | | Shackley Brian Charles | VP, Chief Accounting Officer | Sep 11 '23 | Sale | 112.77 | 475 | 53,566 | 3,222 | Sep 12 06:57 PM | | Nawabi Wahid | Chair, President and CEO | Jun 28 '23 | Option Exercise | 0.00 | 5,783 | 0 | 73,665 | Jun 29 08:43 PM | | McDonnell Kevin Patrick | Sr. VP and CFO | Jun 28 '23 | Option Exercise | 0.00 | 1,171 | 0 | 13,883 | Jun 29 08:38 PM |
|
|
|
 |
| Market Cap | 11.24B | EPS (ttm) | 3.86 |
| P/E | 13.02 | EPS this Y | 1.36% |
| Forward P/E | 13.35 | EPS next Y | 13.52% |
| PEG | 2.59 | EPS past 5Y | - |
| P/S | 1.51 | EPS next 5Y | 5.02% |
| P/B | - | EPS Q/Q | 35.17% |
| Dividend | 1.68% | Sales Q/Q | 0.80% |
| Insider Own | 1.18% | Inst Own | 97.47% |
| Insider Trans | -0.63% | Inst Trans | -4.17% |
| Short Float | 2.99% | Earnings | Jun 04/b |
| Analyst Recom | 2.05 | Target Price | 51.64 |
| Avg Volume | 2.67M | 52W Range | 27.30 - 50.77 |
|
|
|
|
Bath & Body Works, Inc. is a specialty retailers and home to America's Favorite Fragrances, offering a breadth of exclusive fragrances for the body and home, including the selling collections for fine fragrance mist, body lotion and body cream, 3-wick candles, home fragrance diffusers and liquid hand soap. The company was founded by Leslie Herbert Wexner in 1963 and is headquartered in Columbus, OH. |
| Insider Trading |
Relationship |
Date |
Transaction |
Cost |
#Shares |
Value ($) |
#Shares Total |
SEC Form 4 |
| Mazurek Thomas E. | Chief Supply Chain Officer | Mar 27 '24 | Option Exercise | 43.75 | 2,285 | 99,975 | 50,277 | Mar 28 06:10 PM | | Mazurek Thomas E. | Chief Supply Chain Officer | Mar 27 '24 | Sale | 48.89 | 4,285 | 209,515 | 45,992 | Mar 28 06:10 PM | | Nash Sarah E | Director | Mar 10 '24 | Option Exercise | 0.00 | 123,544 | 0 | 222,502 | Mar 12 05:00 PM | | Rosen Julie | President, Retail | Mar 01 '24 | Sale | 45.83 | 12,361 | 566,476 | 12,361 | Mar 05 05:26 PM | | Nash Sarah E | Director | Aug 20 '23 | Option Exercise | 0.00 | 3,770 | 0 | 99,565 | Aug 22 04:36 PM |
|
|
| |
 |
| Market Cap | 61.43B | EPS (ttm) | 8.09 |
| P/E | 45.54 | EPS this Y | 9.45% |
| Forward P/E | 26.13 | EPS next Y | 7.75% |
| PEG | 4.69 | EPS past 5Y | 12.07% |
| P/S | 6.02 | EPS next 5Y | 9.71% |
| P/B | 117.91 | EPS Q/Q | -114.56% |
| Dividend | 1.00% | Sales Q/Q | 10.04% |
| Insider Own | 0.42% | Inst Own | 85.04% |
| Insider Trans | -18.23% | Inst Trans | 0.36% |
| Short Float | 1.02% | Earnings | May 02/a |
| Analyst Recom | 1.93 | Target Price | 375.38 |
| Avg Volume | 668.28K | 52W Range | 269.64 - 369.59 |
|
|
|
May-16-24 04:13PM
|
Motorola Solutions Insider Sold Shares Worth $1,148,382, According to a Recent SEC Filing
(MT Newswires) |
|
10:28AM
|
Motorola Solutions Steers AI Innovation in Public Safety
(Business Wire) |
|
May-15-24 11:53AM
|
Motorola (MSI) Demonstrates Advanced Solutions at CCW 2024
(Zacks) |
|
May-14-24 05:41PM
|
Motorola Solutions Named to Women in Tech Council's 2024 Shatter List
(ACCESSWIRE) |
|
04:19PM
|
Motorola Solutions Insider Sold Shares Worth $11,428,744, According to a Recent SEC Filing
(MT Newswires) |
|
02:00PM
|
Motorola Solutions Declares Quarterly Dividend
(Business Wire) |
|
May-13-24 04:15PM
|
Greg Brown, Chairman and CEO, Motorola Solutions to Participate in the J.P. Morgan 52nd Annual Global Technology, Media and Communications Conference
(Business Wire) |
|
09:45AM
|
Why Motorola (MSI) is a Top Growth Stock for the Long-Term
(Zacks) |
|
May-10-24 07:16PM
|
Analyst Report: Motorola Solutions, Inc.
(Morningstar Research) |
|
May-07-24 07:09PM
|
Luxury on a Budget: 12 Affordable Smartphones with Premium Features
(Insider Monkey) |
|
Motorola Solutions, Inc. engages in the provision of communication infrastructure, devices, accessories, software, and services. It operates through the following segments: Products and Systems Integration, and Software and Services. The Products and Systems Integration segment includes a portfolio of infrastructure, devices, accessories, and video security devices, and the implementation and integration of such systems, devices, and applications. The Software and Services segment includes the provision of public safety and enterprise Command Center Software, unified communications applications, and video software solutions. The company was founded on September 25, 1928 and is headquartered in Chicago, IL. |
| Insider Trading |
Relationship |
Date |
Transaction |
Cost |
#Shares |
Value ($) |
#Shares Total |
SEC Form 4 |
| DUNNING KAREN E | SVP, Human Resources | May 14 '24 | Option Exercise | 208.15 | 1,134 | 236,037 | 3,634 | May 16 04:08 PM | | DUNNING KAREN E | SVP, Human Resources | May 14 '24 | Sale | 361.82 | 3,174 | 1,148,382 | 460 | May 16 04:08 PM | | MOLLOY JOHN P | EVP and COO | May 10 '24 | Option Exercise | 138.64 | 31,599 | 4,380,885 | 78,447 | May 14 04:04 PM | | WINKLER JASON J | EVP and CFO | May 10 '24 | Option Exercise | 120.47 | 6,191 | 745,823 | 21,569 | May 14 04:04 PM | | MOLLOY JOHN P | EVP and COO | May 10 '24 | Sale | 361.68 | 31,599 | 11,428,744 | 46,848 | May 14 04:04 PM |
|
|
|
 |
| Market Cap | 1.99B | EPS (ttm) | - |
| P/E | - | EPS this Y | 81.52% |
| Forward P/E | 15.62 | EPS next Y | -16.04% |
| PEG | - | EPS past 5Y | -0.94% |
| P/S | 2.47 | EPS next 5Y | -7.70% |
| P/B | 1.74 | EPS Q/Q | - |
| Dividend | 7.59% | Sales Q/Q | 32.20% |
| Insider Own | 27.37% | Inst Own | 29.48% |
| Insider Trans | 0.00% | Inst Trans | -4.72% |
| Short Float | 1.59% | Earnings | May 14/b |
| Analyst Recom | 2.50 | Target Price | 13.82 |
| Avg Volume | 688.82K | 52W Range | 8.52 - 14.48 |
|
|
|
|
SFL Corp. Ltd. engages in the ownership and operation of vessels and offshore related assets. It is also involved in the charter, purchase, and sale of assets. The firm operates through subsidiaries located in Bermuda, Cyprus, Malta, Liberia, Norway, the United Kingdom, and the Marshall Islands. The company was founded on October 10, 2003 and is headquartered in Hamilton, Bermuda. |
|
| |
 |
| Market Cap | 8.83B | EPS (ttm) | 1.44 |
| P/E | 11.22 | EPS this Y | -2.78% |
| Forward P/E | 9.81 | EPS next Y | 9.92% |
| PEG | 4.68 | EPS past 5Y | -1.32% |
| P/S | 1.78 | EPS next 5Y | 2.40% |
| P/B | 1.06 | EPS Q/Q | -22.36% |
| Dividend | 3.73% | Sales Q/Q | 15.82% |
| Insider Own | 1.36% | Inst Own | 82.56% |
| Insider Trans | 0.00% | Inst Trans | -3.39% |
| Short Float | 2.50% | Earnings | Apr 17/b |
| Analyst Recom | 1.82 | Target Price | 17.28 |
| Avg Volume | 6.18M | 52W Range | 10.08 - 16.21 |
|
|
|
|
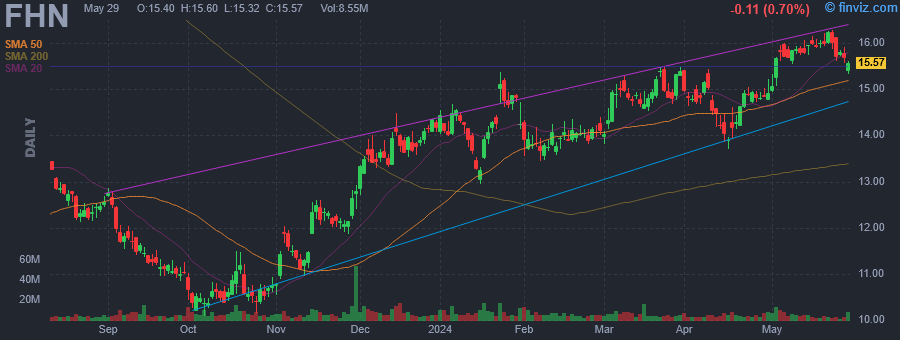
First Horizon Corp. (Tennessee) operates as a financial holding company, which engages in the provision of checking accounts, savings products, mortgage banking, lending, and financing to individuals and businesses. It operates the business through three segments: Regional Banking, Specialty Banking, and Corporate. The Regional Banking segment offers financial products and services, including traditional lending and deposit taking, to retail and commercial customers. The Specialty Banking segment consists of lines of business that deliver product offerings and services with specialized industry knowledge. The Corporate segment focuses on corporate support functions such as risk management, audit, accounting, finance, executive office, and corporate communications. The company was founded by Frank S. Davis in 1864 and is headquartered in Memphis, TN. |
| Insider Trading |
Relationship |
Date |
Transaction |
Cost |
#Shares |
Value ($) |
#Shares Total |
SEC Form 4 |
| FENSTERMAKER WILLIAM H | Director | Jun 07 '23 | Buy | 11.62 | 10,000 | 116,196 | 256,312 | Jun 08 07:31 PM |
|
|
|
 |
| Market Cap | 24.28B | EPS (ttm) | 6.12 |
| P/E | 19.19 | EPS this Y | 16.78% |
| Forward P/E | 16.35 | EPS next Y | 7.23% |
| PEG | 3.76 | EPS past 5Y | 1.84% |
| P/S | 2.03 | EPS next 5Y | 5.10% |
| P/B | 2.17 | EPS Q/Q | -30.07% |
| Dividend | 3.49% | Sales Q/Q | -13.21% |
| Insider Own | 0.35% | Inst Own | 77.61% |
| Insider Trans | -4.75% | Inst Trans | 1.18% |
| Short Float | 1.60% | Earnings | Apr 25/b |
| Analyst Recom | 1.95 | Target Price | 119.69 |
| Avg Volume | 1.14M | 52W Range | 90.14 - 117.30 |
|
|
|
|
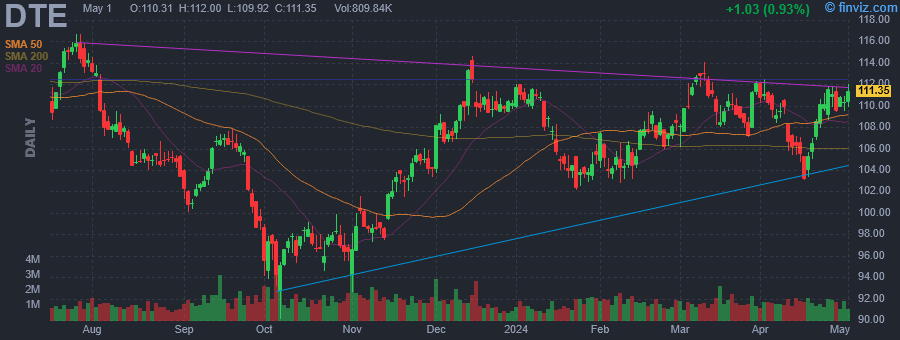
DTE Energy Co. operates as a diversified energy company, which engages in the development and management of energy-related businesses and services. It operates through the following segments: Electric, Gas, DTE Vantage, Energy Trading, and Corporate and Other. The Electric segment consists of generation, purchase, distribution, and sale of electricity to residential, commercial, and industrial customers in southeastern Michigan. The Gas segment is involved in the purchase, storage, transportation, distribution, and sale of natural gas to residential, commercial, and industrial customers throughout Michigan, and the sale of storage and transportation capacity. The DTE Vantage segment focuses on projects that deliver energy and utility-type products and services to industrial, commercial, and institutional customers, produce reduced emissions fuel, and sell electricity and pipeline-quality gas from renewable energy projects. The Energy Trading segment covers energy marketing and trading operations. The Corporate and Other segment includes various holding company activities, holds certain non-utility debt, and holds certain investments, as well as funds supporting regional development and economic growth. The company was founded in January 1995 and is headquartered in Detroit, MI. |
| Insider Trading |
Relationship |
Date |
Transaction |
Cost |
#Shares |
Value ($) |
#Shares Total |
SEC Form 4 |
| Stiers Mark W | Pres & COO-DTE Vantage & Trad. | May 15 '24 | Sale | 116.00 | 10,000 | 1,160,000 | 41,921 | May 17 01:12 PM | | MCGOVERN GAIL J | Director | May 04 '24 | Option Exercise | 0.00 | 1,333 | 0 | 1,333 | May 06 11:52 AM | | VANDENBERGHE JAMES H | Director | May 04 '24 | Option Exercise | 0.00 | 1,333 | 0 | 3,333 | May 06 11:55 AM | | Chavez JoAnn | Sr VP & Chief Legal Officer | May 02 '24 | Sale | 111.52 | 3,000 | 334,560 | 13,667 | May 03 04:09 PM | | Richard Robert A. | President & COO - DTE Gas | Feb 27 '24 | Sale | 107.25 | 4,800 | 514,810 | 26,118 | Feb 28 02:40 PM |
|
|
| |
 |
| Market Cap | 21.03B | EPS (ttm) | 4.41 |
| P/E | 112.35 | EPS this Y | 18.16% |
| Forward P/E | 47.37 | EPS next Y | 13.47% |
| PEG | 10.60 | EPS past 5Y | 1.09% |
| P/S | 10.56 | EPS next 5Y | 10.60% |
| P/B | 6.95 | EPS Q/Q | 73.02% |
| Dividend | - | Sales Q/Q | 8.58% |
| Insider Own | 0.74% | Inst Own | 95.64% |
| Insider Trans | -32.40% | Inst Trans | 1.19% |
| Short Float | 2.41% | Earnings | Apr 24/a |
| Analyst Recom | 1.65 | Target Price | 500.67 |
| Avg Volume | 225.69K | 52W Range | 361.16 - 495.00 |
|
|
| Today | Reiterated |
Needham |
Buy |
$500 → $600 |
|
|
Today 06:33AM
|
Loop Capital Adjusts Price Target on Tyler Technologies to $530 From $485
(MT Newswires) |
|
06:20AM
|
Needham Adjusts Price Target on Tyler Technologies to $600 From $500, Maintains Buy Rating
(MT Newswires) |
|
May-20-24 09:17AM
|
Tyler Technologies Announces 2024 Public Sector Excellence Award Winners
(Business Wire) |
|
May-17-24 02:35AM
|
Insider Sell: Director Daniel Pope Sells Shares of Tyler Technologies Inc (TYL)
(GuruFocus.com) |
|
May-16-24 05:56PM
|
Tyler Technologies Insider Sold Shares Worth $5,840,373, According to a Recent SEC Filing
(MT Newswires) |
|
May-15-24 11:32AM
|
Tyler (TYL) Equips FDC With its Digital Payment Solution
(Zacks) |
|
May-14-24 09:17AM
|
Third Largest State Prison System Goes Live with Tyler Technologies Solution Suite
(Business Wire) |
|
May-09-24 04:56PM
|
Tyler Technologies Insider Sold Shares Worth $5,391,260, According to a Recent SEC Filing
(MT Newswires) |
|
May-07-24 04:55PM
|
Tyler Technologies Insider Sold Shares Worth $1,242,107, According to a Recent SEC Filing
(MT Newswires) |
|
09:17AM
|
Tyler Technologies to Provide Complete Public Safety Suite to Evanston, Illinois, Police Department
(Business Wire) |
|
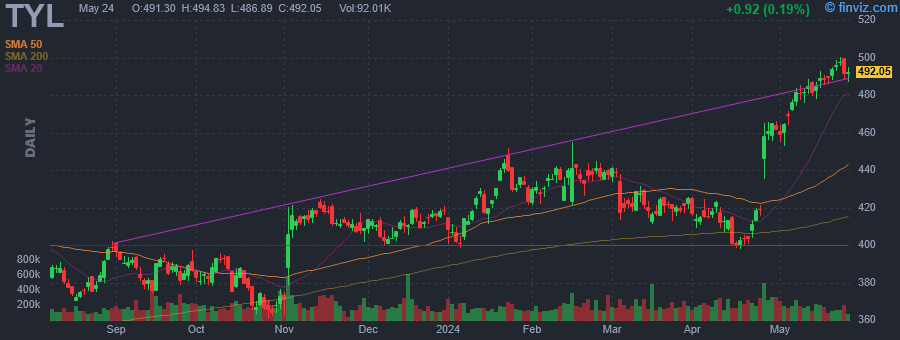
Tyler Technologies, Inc. engages in the provision of integrated technology and management solutions and services for the public sector with a focus on local governments. It operates through the following segments: Enterprise Software and Platform Technologies. The Enterprise Software segment provides public sector entities with software systems to meet their information technology and automation needs for mission-critical back-office functions such as financial management, courts and justice processes. The Platform Technologies (PT) segment provides public sector entities with software solutions to platform and transformative solutions including digital solutions, payment processing, streamline data processing, and improve operations and workflows. The company was founded in 1966 and is headquartered in Plano, TX. |
| Insider Trading |
Relationship |
Date |
Transaction |
Cost |
#Shares |
Value ($) |
#Shares Total |
SEC Form 4 |
| MARR JOHN S JR | Executive Chair of the Board | May 15 '24 | Option Exercise | 205.66 | 6,000 | 1,233,960 | 12,983 | May 16 05:53 PM | | MARR JOHN S JR | Executive Chair of the Board | May 15 '24 | Sale | 490.19 | 6,000 | 2,941,121 | 6,983 | May 16 05:53 PM | | Pope Daniel M | Director | May 15 '24 | Sale | 491.18 | 520 | 255,414 | 3,493 | May 16 06:01 PM | | MARR JOHN S JR | Executive Chair of the Board | May 14 '24 | Option Exercise | 205.66 | 6,000 | 1,233,960 | 12,983 | May 16 05:53 PM | | MARR JOHN S JR | Executive Chair of the Board | May 14 '24 | Sale | 483.21 | 6,000 | 2,899,252 | 6,983 | May 16 05:53 PM |
|
|
|
 |
| Market Cap | 67.23B | EPS (ttm) | 5.40 |
| P/E | 43.57 | EPS this Y | 26.63% |
| Forward P/E | 31.66 | EPS next Y | 12.72% |
| PEG | 2.77 | EPS past 5Y | -0.37% |
| P/S | 4.34 | EPS next 5Y | 15.72% |
| P/B | 8.19 | EPS Q/Q | 75.39% |
| Dividend | 0.96% | Sales Q/Q | 5.05% |
| Insider Own | 11.06% | Inst Own | 80.18% |
| Insider Trans | -0.07% | Inst Trans | 1.12% |
| Short Float | 0.74% | Earnings | Apr 30/b |
| Analyst Recom | 2.48 | Target Price | 245.23 |
| Avg Volume | 1.16M | 52W Range | 156.72 - 235.85 |
|
|
|
|
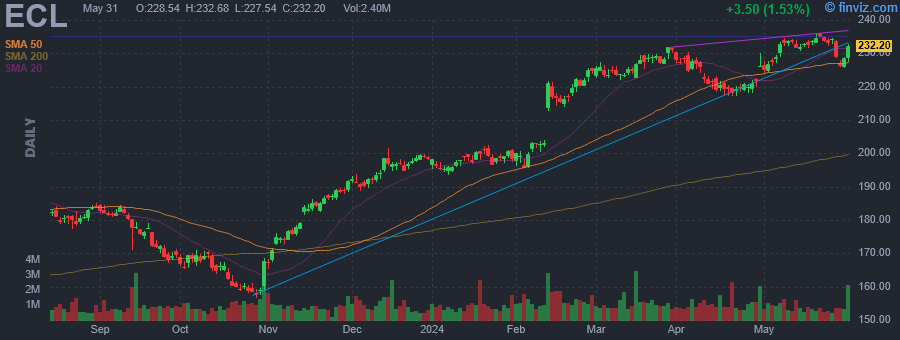
Ecolab, Inc. engages in providing products and services in the field of water, hygiene, and energy. It operates through the following segments: Global Industrial, Global Institutional and Specialty, Global Energy and Life Science, and Other. The Global Industrial segment relates to water, food and beverage, paper, and downstream operating segments. The Global Institutional and Specialty segment refers to the institutional, specialty, and healthcare operating segments. The Global Healthcare and Life Sciences segment includes the healthcare and life sciences operations. The Other segment is involved in providing services to detect, eliminate and prevent pests. The company was founded by Merritt J. Osborn in 1923 and is headquartered in St. Paul, MN. |
| Insider Trading |
Relationship |
Date |
Transaction |
Cost |
#Shares |
Value ($) |
#Shares Total |
SEC Form 4 |
| HIGGINS ARTHUR J | Director | May 06 '24 | Option Exercise | 113.94 | 4,500 | 512,712 | 30,048 | May 08 04:49 PM | | HIGGINS ARTHUR J | Director | May 06 '24 | Sale | 227.52 | 4,500 | 1,023,854 | 25,548 | May 08 04:49 PM | | MacLennan David | Director | May 03 '24 | Buy | 227.37 | 650 | 147,788 | 17,111 | May 07 04:34 PM | | Busch Angela M | EVP - CORP STRAT & BUS DEV | Mar 15 '24 | Option Exercise | 107.69 | 6,118 | 658,817 | 21,272 | Mar 19 04:39 PM | | Vautrinot Suzanne M | Director | Mar 15 '24 | Option Exercise | 104.85 | 2,900 | 304,065 | 9,895 | Mar 19 04:42 PM |
|
|
|
 |
| Market Cap | 277.19B | EPS (ttm) | 14.41 |
| P/E | 44.63 | EPS this Y | 52.95% |
| Forward P/E | 28.95 | EPS next Y | 20.76% |
| PEG | 1.61 | EPS past 5Y | 35.03% |
| P/S | 7.93 | EPS next 5Y | 27.67% |
| P/B | 12.97 | EPS Q/Q | 83.05% |
| Dividend | - | Sales Q/Q | 14.95% |
| Insider Own | 0.88% | Inst Own | 83.06% |
| Insider Trans | -8.67% | Inst Trans | 3.04% |
| Short Float | 1.75% | Earnings | Apr 18/a |
| Analyst Recom | 1.92 | Target Price | 655.67 |
| Avg Volume | 3.52M | 52W Range | 344.73 - 644.37 |
|
|
|
|
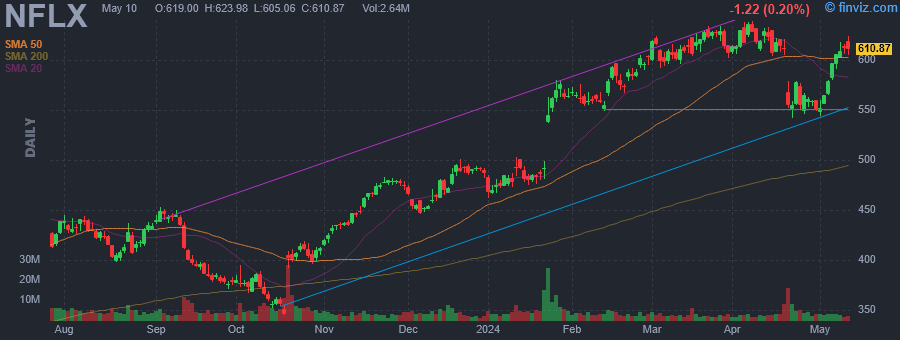
Netflix, Inc. engages in providing entertainment services. It also offers activities for leisure time, entertainment video, video gaming, and other sources of entertainment. It operates through the United States and International geographic segments. The company was founded by Marc Randolph and Wilmot Reed Hastings on August 29, 1997 and is headquartered in Los Gatos, CA. |
| Insider Trading |
Relationship |
Date |
Transaction |
Cost |
#Shares |
Value ($) |
#Shares Total |
SEC Form 4 |
| Neumann Spencer Adam | Chief Financial Officer | May 09 '24 | Sale | 613.08 | 564 | 345,777 | 0 | May 10 04:13 PM | | Sweeney Anne M | Director | May 03 '24 | Option Exercise | 268.34 | 3,029 | 812,808 | 3,029 | May 06 08:03 PM | | Sweeney Anne M | Director | May 03 '24 | Sale | 580.00 | 3,029 | 1,756,820 | 0 | May 06 08:03 PM | | Peters Gregory K | Co-CEO | May 03 '24 | Sale | 593.81 | 1,278 | 758,889 | 13,090 | May 06 08:04 PM | | HYMAN DAVID A | Chief Legal Officer | May 03 '24 | Sale | 593.62 | 268 | 159,090 | 31,610 | May 06 08:03 PM |
|
|
|
