 |
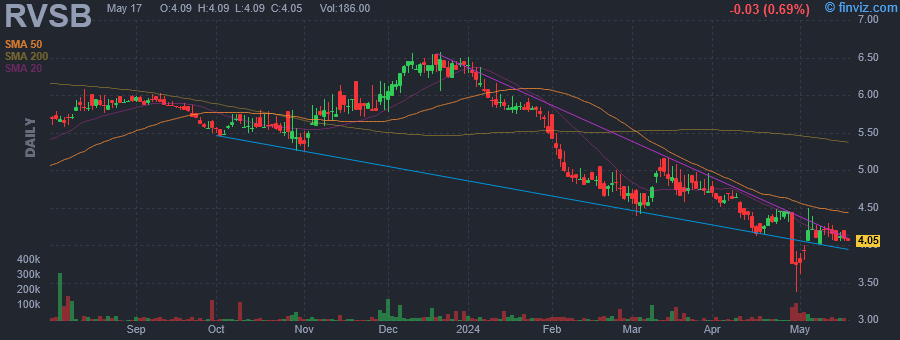
| Market Cap | 82.96M | EPS (ttm) | 0.18 |
| P/E | 21.92 | EPS this Y | -30.56% |
| Forward P/E | 8.73 | EPS next Y | 80.00% |
| PEG | 1.83 | EPS past 5Y | -25.09% |
| P/S | 1.24 | EPS next 5Y | 12.00% |
| P/B | 0.54 | EPS Q/Q | -200.86% |
| Dividend | 6.11% | Sales Q/Q | -12.58% |
| Insider Own | 7.44% | Inst Own | 64.72% |
| Insider Trans | 2.66% | Inst Trans | -1.98% |
| Short Float | 0.20% | Earnings | Apr 25/a |
| Analyst Recom | 2.00 | Target Price | 6.00 |
| Avg Volume | 24.92K | 52W Range | 3.37 - 6.57 |
|
|
|
|
Riverview Bancorp, Inc. operates as a holding company. It provides community banking services to small and medium size businesses, professionals, and individuals. It offers a range of deposit products, including demand deposits, negotiable order of withdrawal accounts, money market accounts, savings accounts, certificates of deposit, and retirement savings plans. The company also provides commercial business, commercial real estate, other real estate mortgage, and real estate construction loans, and consumer loans, such as one-to-four family mortgage loans, home equity lines of credit, land loans, and other secured and unsecured consumer loans. In addition, it is involved in the provision of mortgage brokerage and mortgage loan servicing activities, as well as offering asset management services consisting of trust, estate planning, and investment management services. The company was founded in 1997 and is headquartered in Vancouver, WA. |
| Insider Trading |
Relationship |
Date |
Transaction |
Cost |
#Shares |
Value ($) |
#Shares Total |
SEC Form 4 |
| Benke Robert | EVP/CCO | May 01 '24 | Buy | 3.83 | 5,000 | 19,150 | 15,994 | May 02 06:12 PM | | Carlson Bradley | Director | May 01 '24 | Buy | 3.75 | 1,000 | 3,750 | 20,421 | May 02 06:14 PM | | Eby Patricia | Director | Apr 30 '24 | Buy | 3.75 | 5,000 | 18,750 | 22,000 | May 01 07:25 PM | | Eby Patricia | Director | Apr 30 '24 | Buy | 3.75 | 2,000 | 7,500 | 4,400 | May 01 07:25 PM | | Cox Daniel D | Acting President/CEO and COO | Apr 30 '24 | Buy | 3.90 | 1,300 | 5,070 | 56,195 | May 02 06:08 PM |
|
|
 |
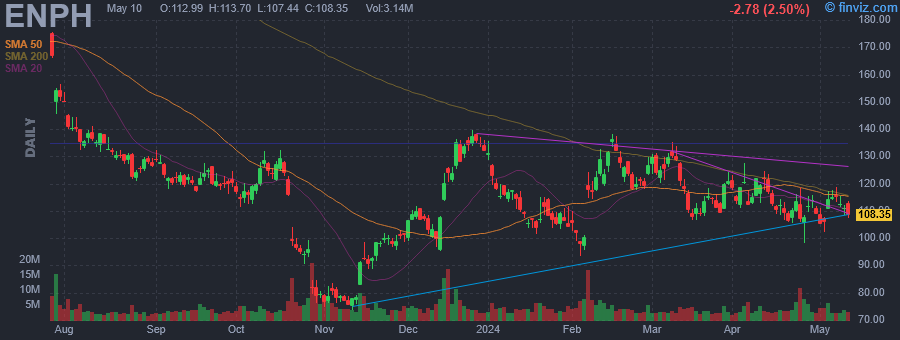 |
| Market Cap | 14.43B | EPS (ttm) | 1.93 |
| P/E | 54.95 | EPS this Y | -33.99% |
| Forward P/E | 20.76 | EPS next Y | 75.50% |
| PEG | 2.99 | EPS past 5Y | - |
| P/S | 7.89 | EPS next 5Y | 18.35% |
| P/B | 15.63 | EPS Q/Q | -111.65% |
| Dividend | - | Sales Q/Q | -63.73% |
| Insider Own | 3.93% | Inst Own | 75.01% |
| Insider Trans | -1.30% | Inst Trans | 7.97% |
| Short Float | 8.74% | Earnings | Apr 23/a |
| Analyst Recom | 2.12 | Target Price | 126.98 |
| Avg Volume | 4.27M | 52W Range | 73.49 - 192.22 |
|
|
|
|
Enphase Energy, Inc. is a global energy technology company, which engages in the business of designing, developing, manufacturing, and selling home energy solutions that manage energy generation, energy storage, control, and communications on one intelligent platform. It operates through the following geographical segments: the United States, the Netherlands, and Others. The company was founded by Raghuveer R. Belur and Martin Fornage in March 2006 and is headquartered in Fremont, CA. |
| Insider Trading |
Relationship |
Date |
Transaction |
Cost |
#Shares |
Value ($) |
#Shares Total |
SEC Form 4 |
| Yang Mandy | EVP, Chief Financial Officer | May 02 '24 | Buy | 104.24 | 4,000 | 416,972 | 62,973 | May 02 06:14 PM | | GOMO STEVEN J | Director | Apr 26 '24 | Sale | 110.08 | 25,000 | 2,751,933 | 93,360 | Apr 26 06:46 PM | | GOMO STEVEN J | Director | Apr 25 '24 | Sale | 104.69 | 20,000 | 2,093,735 | 118,360 | Apr 26 06:46 PM | | RANHOFF DAVID A | EVP & Chief Commercial Officer | Apr 15 '24 | Sale | 116.29 | 5,000 | 581,474 | 119,948 | Apr 16 06:53 PM | | GOMO STEVEN J | Director | Apr 04 '24 | Option Exercise | 0.70 | 45,668 | 31,968 | 138,773 | Apr 05 07:29 PM |
|
|
|
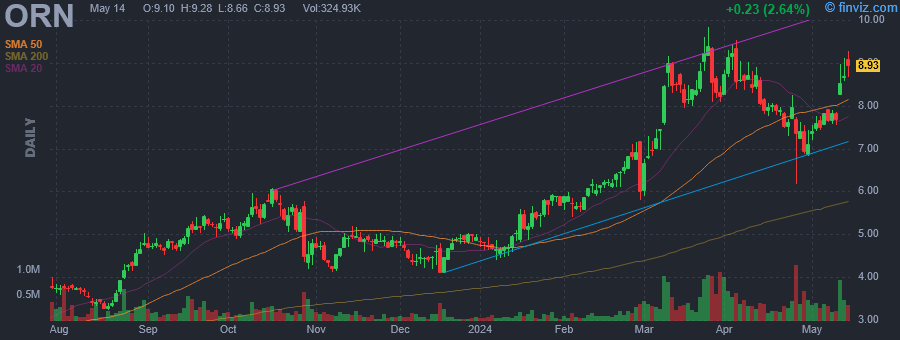 |
| Market Cap | 249.41M | EPS (ttm) | -0.35 |
| P/E | - | EPS this Y | 116.82% |
| Forward P/E | 15.73 | EPS next Y | 421.62% |
| PEG | - | EPS past 5Y | 30.10% |
| P/S | 0.35 | EPS next 5Y | -10.00% |
| P/B | 2.15 | EPS Q/Q | 52.45% |
| Dividend | - | Sales Q/Q | 0.94% |
| Insider Own | 8.40% | Inst Own | 67.32% |
| Insider Trans | 0.20% | Inst Trans | 0.89% |
| Short Float | 2.07% | Earnings | Apr 24/a |
| Analyst Recom | 1.00 | Target Price | 9.83 |
| Avg Volume | 352.39K | 52W Range | 2.38 - 9.84 |
|
|
|
|
Orion Group Holdings, Inc. provides specialty construction services in the building, industrial, and infrastructure sectors. It operates through the Marine and Concrete segments. The Marine segment includes the restoration, maintenance, dredging, and repair of marine transportation facilities, pipelines, bridges and causeways and environmental structures. The Concrete segment involves cement pouring for products such as columns, elevated beams, sidewalks, ramps and tilt walls. The company was founded in 1994 and is headquartered in Houston, TX. |
| Insider Trading |
Relationship |
Date |
Transaction |
Cost |
#Shares |
Value ($) |
#Shares Total |
SEC Form 4 |
| Smith Quentin P. Jr. | Director | May 02 '24 | Buy | 7.45 | 1,400 | 10,430 | 78,678 | May 02 05:53 PM | | Thanisch Gordon Scott | EVP AND CFO | Apr 30 '24 | Buy | 7.12 | 4,000 | 28,480 | 167,811 | Apr 30 04:36 PM | | Boone Travis J | PRESIDENT & CEO | Apr 30 '24 | Buy | 6.97 | 2,160 | 15,066 | 485,019 | Apr 30 04:35 PM | | Earle Edward Chipman | EVP & GENERAL COUNSEL | Apr 30 '24 | Buy | 7.03 | 1,000 | 7,031 | 70,602 | Apr 30 04:37 PM | | Caliel Michael J | Director | Mar 07 '24 | Buy | 7.18 | 4,578 | 32,870 | 185,000 | Mar 07 05:13 PM |
|
|
| |
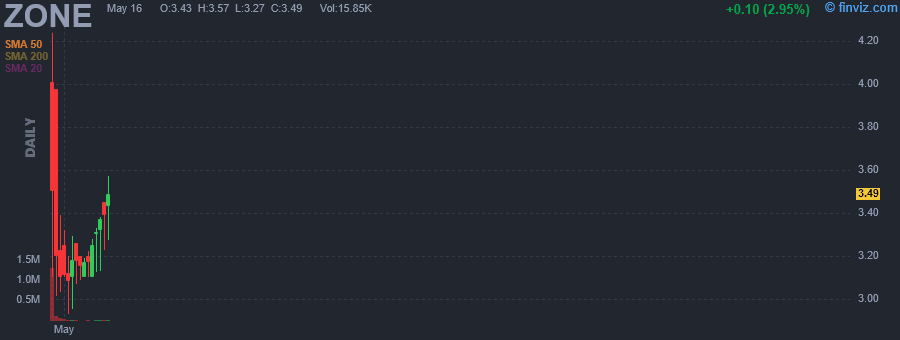 |
| Market Cap | 20.96M | EPS (ttm) | - |
| P/E | - | EPS this Y | - |
| Forward P/E | - | EPS next Y | - |
| PEG | - | EPS past 5Y | - |
| P/S | 12.52 | EPS next 5Y | - |
| P/B | - | EPS Q/Q | - |
| Dividend | - | Sales Q/Q | -69.60% |
| Insider Own | - | Inst Own | - |
| Insider Trans | - | Inst Trans | - |
| Short Float | - | Earnings | - |
| Analyst Recom | - | Target Price | - |
| Avg Volume | 390.85K | 52W Range | 3.01 - 4.24 |
|
|
|
|
CleanCore Solutions, Inc. engages in developing, manufacturing, and selling cleaning products that produces pure aqueous ozone for professional, industrial, and home use. The company's product includes fill station, power caddy, and power minicaddy, ice treatment machine, commercial laundry, and residential laundry. It offers products and solutions that are marketed for janitorial and sanitation, ice machine cleaning, laundry, and industrial industries. CleanCore Solutions, Inc. was formerly known as CC Acquisition Corp. and changed its name to CleanCore Solutions, Inc. in November 2022. The company was incorporated in 2022 and is based in Omaha, Nebraska. |
| Insider Trading |
Relationship |
Date |
Transaction |
Cost |
#Shares |
Value ($) |
#Shares Total |
SEC Form 4 |
| Adams Clayton | 10% Owner | Apr 30 '24 | Buy | 3.10 | 5,000 | 15,500 | 470,000 | May 02 05:53 PM | | Adams Clayton | 10% Owner | Apr 26 '24 | Buy | 4.01 | 145,000 | 581,450 | 465,000 | Apr 26 04:05 PM |
|
|
|
 |
| Market Cap | 304.89M | EPS (ttm) | -0.68 |
| P/E | - | EPS this Y | - |
| Forward P/E | - | EPS next Y | - |
| PEG | - | EPS past 5Y | - |
| P/S | - | EPS next 5Y | - |
| P/B | - | EPS Q/Q | - |
| Dividend | 9.90% | Sales Q/Q | - |
| Insider Own | 0.30% | Inst Own | 65.67% |
| Insider Trans | 137.06% | Inst Trans | - |
| Short Float | 0.05% | Earnings | - |
| Analyst Recom | - | Target Price | - |
| Avg Volume | 57.16K | 52W Range | 13.17 - 16.11 |
|
|
|
May-01-24 04:05PM
|
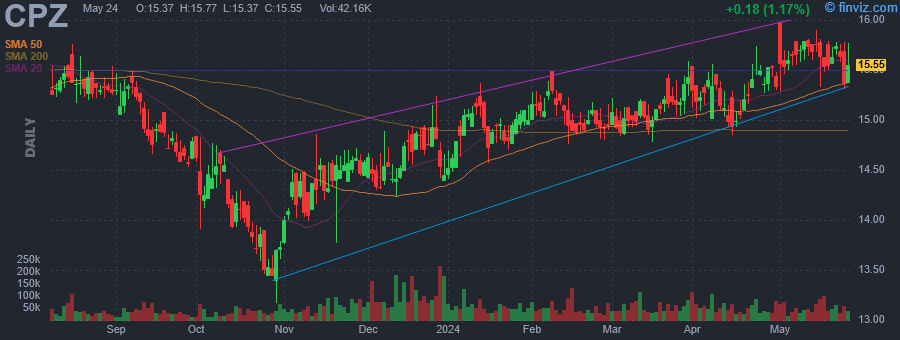
Calamos Investments Closed-End Funds (NASDAQ: CHI, CHY, CSQ, CGO, CHW, CCD and CPZ) Announce Monthly Distributions and Required Notifications of Sources of Distribution
(PR Newswire) |
|
Apr-01-24 04:05PM
|
Calamos Investments Closed-End Funds (NASDAQ: CHI, CHY, CSQ, CGO, CHW, CCD and CPZ) Announce Monthly Distributions and Required Notifications of Sources of Distribution
(PR Newswire) |
|
Mar-01-24 04:05PM
|
Calamos Investments Closed-End Funds (NASDAQ: CHI, CHY, CSQ, CGO, CHW, CCD and CPZ) Announce Monthly Distributions and Required Notifications of Sources of Distribution
(PR Newswire) |
|
Feb-01-24 04:05PM
|
Calamos Investments Closed-End Funds (NASDAQ: CHI, CHY, CSQ, CGO, CHW, CCD and CPZ) Announce Monthly Distributions and Required Notifications of Sources of Distribution
(PR Newswire) |
|
Dec-18-23 06:06PM
|
Calamos Investments Closed-End Funds (NASDAQ: CHI, CHY, CSQ, CGO, CHW, CCD and CPZ) Announce Monthly Distributions and Required Notifications of Sources of Distribution
(PR Newswire) |
|
Dec-01-23 04:05PM
|
Calamos Investments Closed-End Funds (NASDAQ: CHI, CHY, CSQ, CGO, CHW, CCD and CPZ) Announce Monthly Distributions and Required Notifications of Sources of Distribution
(PR Newswire) |
|
Nov-01-23 04:05PM
|
Calamos Investments Closed-End Funds (NASDAQ: CHI, CHY, CSQ, CGO, CHW, CCD and CPZ) Announce Monthly Distributions and Required Notifications of Sources of Distribution
(PR Newswire) |
|
Oct-02-23 04:05PM
|
Calamos Investments Closed-End Funds (NASDAQ: CHI, CHY, CSQ, CGO, CHW, CCD and CPZ) Announce Monthly Distributions and Required Notifications of Sources of Distribution
(PR Newswire) |
|
Sep-01-23 04:10PM
|
Calamos Investments Closed-End Funds (NASDAQ: CHI, CHY, CSQ, CGO, CHW, CCD and CPZ) Announce Monthly Distributions and Required Notifications of Sources of Distribution
(PR Newswire) |
|
Aug-01-23 04:05PM
|
Calamos Investments Closed-End Funds (NASDAQ: CHI, CHY, CSQ, CGO, CHW, CCD and CPZ) Announce Monthly Distributions and Required Notifications of Sources of Distribution
(PR Newswire) |
|
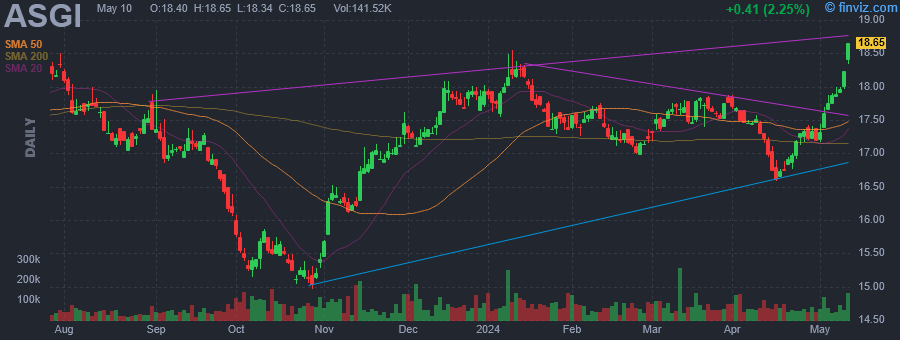
The Fund will invest, under normal circumstances, at least 80% of its managed assets in a globally diversified portfolio comprised of equity securities which are defined to include common stock, preferred stock, convertible securities and ETFs, as well as long and short equity positions managed pursuant to a long/short equity strategy. The Fund may invest up to 20% of its managed assets opportunistically in globally diversified income-producing securities, including high-yield and investment grade corporate securities, leveraged loans, distressed debt securities, securitized products, U.S. Treasuries and sovereign debt issued by foreign governments. |
| Insider Trading |
Relationship |
Date |
Transaction |
Cost |
#Shares |
Value ($) |
#Shares Total |
SEC Form 4 |
| Herman Thomas E | VP and CFO | May 01 '24 | Buy | 15.55 | 16,308 | 253,668 | 26,783 | May 02 05:38 PM | | Mickey Mark | Chief Compliance Officer | Feb 14 '24 | Buy | 14.90 | 1,500 | 22,350 | 1,500 | Feb 15 11:22 AM | | CALAMOS JOHN P SR | President and Chairman | Dec 20 '23 | Buy | 14.85 | 18,000 | 267,232 | 67,508 | Dec 21 11:10 AM | | Koudounis John S. | Vice President | Dec 20 '23 | Sale | 14.92 | 5,400 | 80,554 | 0 | Dec 20 12:27 PM | | CALAMOS JOHN P SR | President and Chairman | Dec 19 '23 | Buy | 14.77 | 15,813 | 233,607 | 49,508 | Dec 20 10:58 AM |
|
|
| |
 |
| Market Cap | 300.13M | EPS (ttm) | 0.23 |
| P/E | 29.15 | EPS this Y | - |
| Forward P/E | - | EPS next Y | - |
| PEG | 1.46 | EPS past 5Y | 2.86% |
| P/S | 0.80 | EPS next 5Y | 20.00% |
| P/B | 2.51 | EPS Q/Q | -56.33% |
| Dividend | - | Sales Q/Q | -3.45% |
| Insider Own | 42.22% | Inst Own | 47.85% |
| Insider Trans | 14.48% | Inst Trans | -25.19% |
| Short Float | 1.25% | Earnings | Feb 29/b |
| Analyst Recom | 1.00 | Target Price | 7.50 |
| Avg Volume | 145.34K | 52W Range | 4.17 - 7.67 |
|
|
|
Today 04:47PM
|
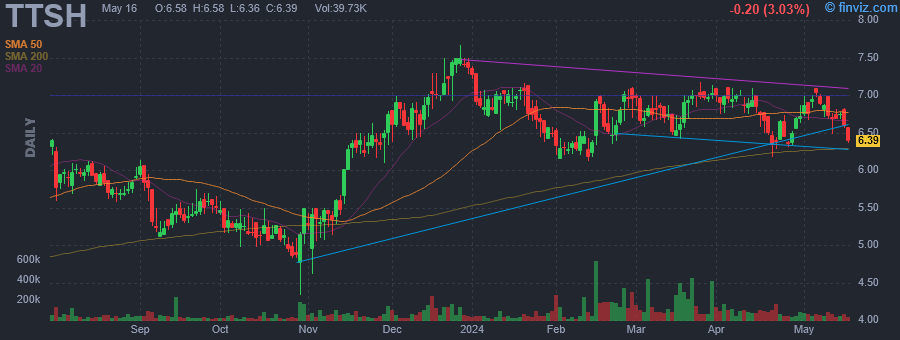
The Tile Shop to Host First Quarter 2024 Earnings Conference Call
(GlobeNewswire) |
|
Mar-02-24 08:49AM
|
Tile Shop Holdings, Inc. (NASDAQ:TTSH) Q4 2023 Earnings Call Transcript
(Insider Monkey) |
|
Mar-01-24 01:24PM
|
Hedge Fund and Insider Trading News: Ken Griffin, Ray Dalio, Izzy Englander, Kyle Bass, Nelson Peltz, Tiger Global Management, A-Mark Precious Metals Inc (AMRK), Tile Shop Holdings, Inc. (TTSH), and More
(Insider Monkey) |
|
Feb-29-24 07:53AM
|
Tile Shop Holdings Inc (TTSH) Reports Decline in Q4 and Full-Year 2023 Sales Amidst ...
(GuruFocus.com) |
|
07:00AM
|
The Tile Shop Reports Fourth Quarter and Full-Year 2023 Results
(GlobeNewswire) |
|
Feb-22-24 08:38PM
|
The Tile Shop to Host Fourth Quarter 2023 Earnings Conference Call
(GlobeNewswire) |
|
Dec-13-23 05:03PM
|
The Tile Shop Partners With Kelli Fontana on Classic, Bold and Whimsical Debut Tile Collection
(GlobeNewswire) |
|
Nov-06-23 08:48AM
|
Tile Shop Holdings, Inc. (NASDAQ:TTSH) Q3 2023 Earnings Call Transcript
(Insider Monkey) |
|
Nov-02-23 09:25AM
|
Tile Shop Holdings Inc (TTSH) Reports 5.2% Decrease in Net Sales for Q3 2023
(GuruFocus.com) |
|
07:00AM
|
The Tile Shop Reports Third Quarter 2023 Results
(GlobeNewswire) |
|
Tile Shop Holdings, Inc. operates as a holding company. It engages in retailing of natural stone and man-made tiles. The company was founded by Robert A. Rucker on June 27, 2012 and is headquartered in Plymouth, MN. |
| Insider Trading |
Relationship |
Date |
Transaction |
Cost |
#Shares |
Value ($) |
#Shares Total |
SEC Form 4 |
| Fund 1 Investments, LLC | 10% Owner | May 02 '24 | Buy | 6.74 | 10,000 | 67,381 | 6,068,446 | May 02 04:54 PM | | Fund 1 Investments, LLC | 10% Owner | Apr 30 '24 | Buy | 6.71 | 10,000 | 67,057 | 6,058,446 | May 02 04:54 PM | | Fund 1 Investments, LLC | 10% Owner | Apr 22 '24 | Buy | 6.34 | 98,438 | 623,614 | 6,048,446 | Apr 22 04:43 PM | | Fund 1 Investments, LLC | 10% Owner | Apr 19 '24 | Buy | 6.26 | 24,200 | 151,444 | 5,950,008 | Apr 22 04:43 PM | | Fund 1 Investments, LLC | 10% Owner | Apr 18 '24 | Buy | 6.52 | 4,500 | 29,321 | 5,925,808 | Apr 22 04:43 PM |
|
|
|
 |
| Market Cap | 189.16M | EPS (ttm) | -0.06 |
| P/E | - | EPS this Y | - |
| Forward P/E | - | EPS next Y | - |
| PEG | - | EPS past 5Y | - |
| P/S | 10.52 | EPS next 5Y | - |
| P/B | 0.97 | EPS Q/Q | - |
| Dividend | 4.30% | Sales Q/Q | 5.00% |
| Insider Own | - | Inst Own | 44.72% |
| Insider Trans | - | Inst Trans | - |
| Short Float | 0.09% | Earnings | - |
| Analyst Recom | - | Target Price | - |
| Avg Volume | 53.51K | 52W Range | 6.37 - 8.19 |
|
|
|
|
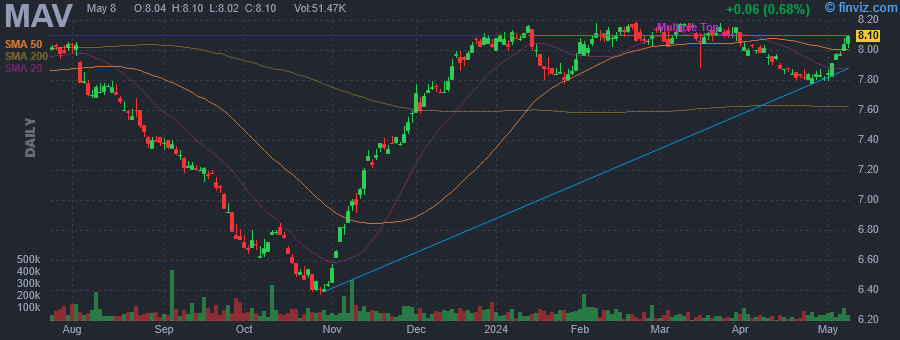
Pioneer Municipal High Income Advantage Fund, Inc. is a closed ended fixed income mutual fund launched and managed by Pioneer Investment Management, Inc. The fund invests in the fixed income markets of the United States. It invests primarily in municipal bonds. The fund benchmarks the performance of its portfolio against the Barclays Capital High Yield Municipal Bond Index and the Barclays Capital Municipal Bond Index. It was formerly known as Pioneer Municipal Advantage Trust. Pioneer Municipal High Income Advantage Fund, Inc. was formed on August 6, 2003 and is domiciled in the United States. |
| Insider Trading |
Relationship |
Date |
Transaction |
Cost |
#Shares |
Value ($) |
#Shares Total |
SEC Form 4 |
| Saba Capital Management, L.P. | 10% Owner | May 02 '24 | Buy | 7.87 | 35,879 | 282,368 | 2,737,589 | May 02 04:52 PM | | Saba Capital Management, L.P. | 10% Owner | May 01 '24 | Buy | 7.82 | 24,037 | 187,969 | 2,701,710 | May 02 04:52 PM | | Saba Capital Management, L.P. | 10% Owner | Apr 25 '24 | Buy | 7.81 | 38,952 | 304,215 | 2,677,669 | Apr 26 11:43 AM | | Saba Capital Management, L.P. | 10% Owner | Apr 24 '24 | Buy | 7.82 | 7,534 | 58,916 | 2,638,717 | Apr 26 11:43 AM | | Saba Capital Management, L.P. | 10% Owner | Mar 19 '24 | Buy | 8.12 | 18,383 | 149,270 | 2,631,183 | Mar 20 11:45 AM |
|
|
| |
 |
| Market Cap | 368.68M | EPS (ttm) | 0.79 |
| P/E | 17.06 | EPS this Y | - |
| Forward P/E | - | EPS next Y | - |
| PEG | - | EPS past 5Y | - |
| P/S | 104.95 | EPS next 5Y | - |
| P/B | 0.84 | EPS Q/Q | - |
| Dividend | 7.49% | Sales Q/Q | 34.40% |
| Insider Own | - | Inst Own | 36.04% |
| Insider Trans | - | Inst Trans | - |
| Short Float | 0.07% | Earnings | - |
| Analyst Recom | - | Target Price | - |
| Avg Volume | 98.93K | 52W Range | 11.34 - 14.37 |
|
|
|
|
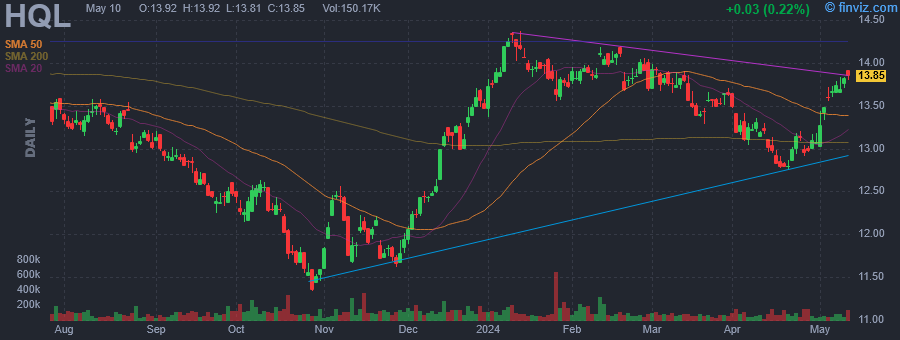
Tekla Life Sciences Investors is a closed-ended equity mutual fund launched and managed by Tekla Capital Management LLC. The fund invests in public equity markets across the globe. It seeks to invest in stocks of companies operating in the life sciences sector, including the biotechnology, pharmaceutical, diagnostics, managed healthcare, medical equipment, hospitals, healthcare information technology and services, devices and supplies industries, and in agriculture and environmental management industries. The fund primarily invests in growth stocks of small cap companies. It employs fundamental analysis with a focus on factors such as market position for services or products, experience of business management, technological expertise, and the ability either to generate funds internally to finance growth or to secure outside sources of capital to create its portfolio. The fund benchmarks the performance of its portfolio against the NASDAQ Biotech Index and the S&P 500 Index. It was formerly known as H&Q Life Sciences Investors fund. Tekla Life Sciences Investors was formed on February 20, 1992 and is domiciled in the United States. |
| Insider Trading |
Relationship |
Date |
Transaction |
Cost |
#Shares |
Value ($) |
#Shares Total |
SEC Form 4 |
| Saba Capital Management, L.P. | 10% Owner | May 02 '24 | Buy | 13.46 | 26,274 | 353,648 | 3,068,730 | May 02 04:50 PM | | Saba Capital Management, L.P. | 10% Owner | May 01 '24 | Buy | 13.02 | 252 | 3,281 | 3,042,456 | May 02 04:50 PM | | Saba Capital Management, L.P. | 10% Owner | Apr 30 '24 | Buy | 13.13 | 16,573 | 217,603 | 3,042,204 | May 01 10:23 AM | | Saba Capital Management, L.P. | 10% Owner | Apr 26 '24 | Buy | 13.00 | 120,304 | 1,563,952 | 3,025,602 | Apr 29 04:54 PM | | Saba Capital Management, L.P. | 10% Owner | Apr 25 '24 | Buy | 12.99 | 97,574 | 1,267,486 | 2,905,298 | Apr 26 11:40 AM |
|
|
|
 |
| Market Cap | 443.89M | EPS (ttm) | -0.66 |
| P/E | - | EPS this Y | - |
| Forward P/E | - | EPS next Y | - |
| PEG | - | EPS past 5Y | - |
| P/S | - | EPS next 5Y | - |
| P/B | - | EPS Q/Q | - |
| Dividend | 8.92% | Sales Q/Q | - |
| Insider Own | - | Inst Own | 40.44% |
| Insider Trans | - | Inst Trans | - |
| Short Float | 0.18% | Earnings | - |
| Analyst Recom | - | Target Price | - |
| Avg Volume | 71.81K | 52W Range | 14.96 - 18.55 |
|
|
|
|
Abrdn Global Infrastructure Income Fund seeks investment results that correspond generally to the price and yield performance, before fees and expenses, of the Northern Trust Real Assets Allocation IndexSM.Under normal circumstances, the fund will invest at least 80% of its total assets (exclusive of collateral held from securities lending) in the securities of the underlying index. The underlying index measures the performance of an optimized allocation to the underlying funds that is intended to provide exposures to certain real assets and minimize overall volatility of investment in the underlying funds. |
| Insider Trading |
Relationship |
Date |
Transaction |
Cost |
#Shares |
Value ($) |
#Shares Total |
SEC Form 4 |
| Saba Capital Management, L.P. | 10% Owner | May 02 '24 | Buy | 17.51 | 58,011 | 1,015,773 | 2,889,010 | May 02 04:47 PM | | Saba Capital Management, L.P. | 10% Owner | May 01 '24 | Buy | 17.20 | 18,556 | 319,163 | 2,830,999 | May 02 04:47 PM | | Saba Capital Management, L.P. | 10% Owner | Apr 29 '24 | Buy | 17.37 | 15,132 | 262,843 | 2,812,434 | May 01 10:21 AM | | Saba Capital Management, L.P. | 10% Owner | Apr 25 '24 | Buy | 17.27 | 34,547 | 596,627 | 2,797,302 | Apr 26 11:36 AM | | Saba Capital Management, L.P. | 10% Owner | Apr 23 '24 | Buy | 17.11 | 13,691 | 234,253 | 2,762,755 | Apr 23 07:56 PM |
|
|
|
 |
| Market Cap | 95.46M | EPS (ttm) | 1.43 |
| P/E | 10.62 | EPS this Y | 16.99% |
| Forward P/E | 6.97 | EPS next Y | 21.79% |
| PEG | - | EPS past 5Y | -5.60% |
| P/S | 1.29 | EPS next 5Y | - |
| P/B | 0.81 | EPS Q/Q | -16.64% |
| Dividend | 3.95% | Sales Q/Q | 25.01% |
| Insider Own | 17.84% | Inst Own | 35.16% |
| Insider Trans | 0.47% | Inst Trans | 0.27% |
| Short Float | 0.16% | Earnings | Apr 30/b |
| Analyst Recom | 3.00 | Target Price | 18.50 |
| Avg Volume | 3.99K | 52W Range | 13.13 - 21.75 |
|
|
|
|
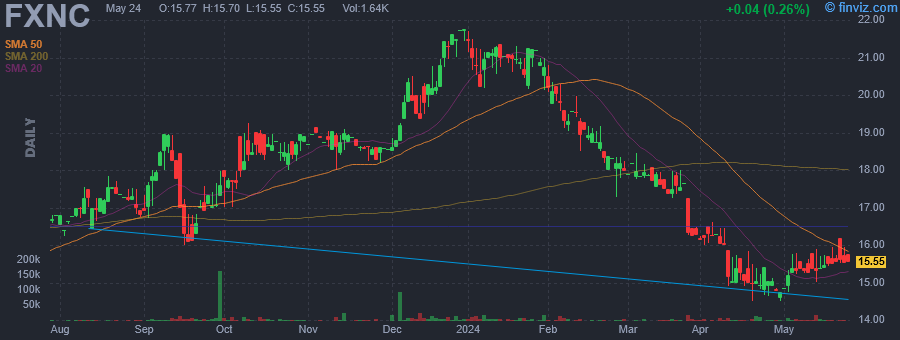
First National Corp. operates as a bank holding company, which engages in the provision of consumer and business banking services through its subsidiary. It offers savings, checking, mortgage lending, home equity, treasury management, construction loan, commercial mortgage, and rental properties. The company was founded on September 7, 1983 and is headquartered in Strasburg, VA. |
| Insider Trading |
Relationship |
Date |
Transaction |
Cost |
#Shares |
Value ($) |
#Shares Total |
SEC Form 4 |
| WILKINS III JAMES R | Director | May 02 '24 | Buy | 15.01 | 4,257 | 63,905 | 283,034 | May 02 04:46 PM | | HARVARD SCOTT C | President & CEO | May 02 '24 | Buy | 14.90 | 1,000 | 14,900 | 69,729 | May 02 04:45 PM | | Smith Gerald F JR | Director | Sep 29 '23 | Buy | 17.30 | 686 | 11,868 | 18,558 | Oct 02 04:51 PM | | Smith Gerald F JR | Director | Sep 28 '23 | Buy | 17.45 | 1,600 | 27,920 | 18,089 | Oct 02 04:51 PM | | Smith Gerald F JR | Director | Sep 27 '23 | Buy | 17.00 | 1,675 | 28,475 | 17,489 | Sep 28 04:45 PM |
|
|
|
