 |
| Market Cap | 422.01M | EPS (ttm) | -15.34 |
| P/E | - | EPS this Y | 65.06% |
| Forward P/E | - | EPS next Y | 17.24% |
| PEG | - | EPS past 5Y | -483.52% |
| P/S | - | EPS next 5Y | 25.90% |
| P/B | 0.75 | EPS Q/Q | 10.50% |
| Dividend | - | Sales Q/Q | - |
| Insider Own | 30.15% | Inst Own | 58.91% |
| Insider Trans | 15.49% | Inst Trans | -2.70% |
| Short Float | 2.65% | Earnings | May 08/a |
| Analyst Recom | 1.00 | Target Price | 34.00 |
| Avg Volume | 125.56K | 52W Range | 9.91 - 24.59 |
|
|
|
|
LENZ Therapeutics, Inc. operates as a clinical stage company, which develops ophthalmic pharmaceutical products. It offers eye drop product treatment for presbyopia. The company was founded by James McCollum in July 2013 and is headquartered in Del Mar, CA. |
| Insider Trading |
Relationship |
Date |
Transaction |
Cost |
#Shares |
Value ($) |
#Shares Total |
SEC Form 4 |
| Chevallard Daniel R. | Chief Financial Officer | May 14 '24 | Buy | 15.68 | 3,188 | 49,988 | 3,188 | May 15 04:13 PM | | MCCOLLUM JAMES W | Director | May 13 '24 | Buy | 15.99 | 31,332 | 501,093 | 525,565 | May 14 05:29 PM | | RA CAPITAL MANAGEMENT, L.P. | Director | Mar 21 '24 | Buy | 15.03 | 998,009 | 15,000,075 | 3,319,339 | Mar 25 08:48 PM |
|
|
 |
 |
| Market Cap | 331.06M | EPS (ttm) | 4.68 |
| P/E | 10.25 | EPS this Y | -5.25% |
| Forward P/E | 9.75 | EPS next Y | 6.84% |
| PEG | - | EPS past 5Y | 8.99% |
| P/S | 2.27 | EPS next 5Y | - |
| P/B | 1.10 | EPS Q/Q | -13.12% |
| Dividend | 0.74% | Sales Q/Q | 18.32% |
| Insider Own | 37.60% | Inst Own | 22.04% |
| Insider Trans | -0.15% | Inst Trans | -1.50% |
| Short Float | 0.50% | Earnings | Apr 25/a |
| Analyst Recom | 1.00 | Target Price | 62.00 |
| Avg Volume | 7.97K | 52W Range | 44.15 - 58.00 |
|
|
|
|
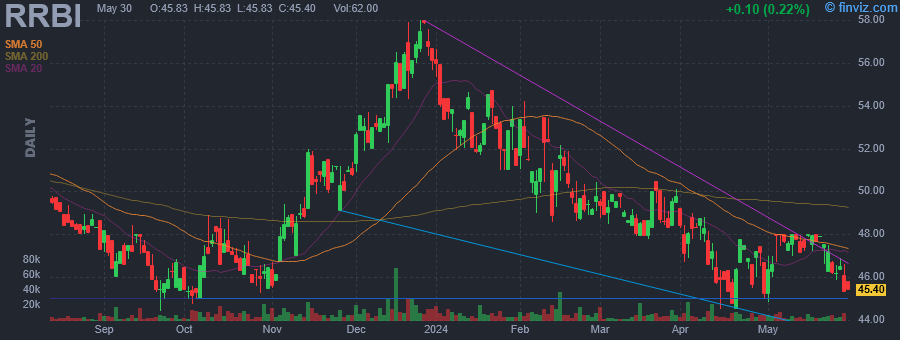
Red River Bancshares, Inc. is a bank holding company, which engages in the provision of banking products and services for commercial and retail customers through its subsidiary. It offers real estate and commercial loans, treasury management, retail banking networks, private banking, residential mortgage lending, and investment services. The company was founded on March 16, 1998 and is headquartered in Alexandria, LA. |
| Insider Trading |
Relationship |
Date |
Transaction |
Cost |
#Shares |
Value ($) |
#Shares Total |
SEC Form 4 |
| BROWN MICHAEL J | Director | May 14 '24 | Buy | 47.77 | 202 | 9,650 | 2,103 | May 15 04:08 PM | | BROWN MICHAEL J | Director | May 13 '24 | Buy | 47.75 | 401 | 19,147 | 1,901 | May 15 04:08 PM | | Price Teddy Ray | Director | May 03 '24 | Buy | 47.08 | 738 | 34,742 | 367,478 | May 03 02:22 PM | | Price Teddy Ray | Director | May 03 '24 | Buy | 47.99 | 131 | 6,287 | 64,785 | May 03 02:22 PM | | Salazar Tammi R. | See Remarks | Mar 28 '24 | Sale | 50.05 | 781 | 39,089 | 39,901 | Apr 01 02:50 PM |
|
|
|
 |
| Market Cap | 177.94M | EPS (ttm) | 0.37 |
| P/E | 34.31 | EPS this Y | 21.28% |
| Forward P/E | 18.42 | EPS next Y | 21.05% |
| PEG | - | EPS past 5Y | -9.09% |
| P/S | 4.88 | EPS next 5Y | - |
| P/B | 2.78 | EPS Q/Q | -38.89% |
| Dividend | 1.89% | Sales Q/Q | -14.59% |
| Insider Own | 60.15% | Inst Own | 11.68% |
| Insider Trans | 0.26% | Inst Trans | -7.20% |
| Short Float | 2.17% | Earnings | May 09/a |
| Analyst Recom | 1.00 | Target Price | 19.00 |
| Avg Volume | 14.21K | 52W Range | 11.40 - 29.38 |
|
|
|
|
HireQuest, Inc. engages in the provision of staffing services. It also offers temporary, permanent, and direct-hire recruiting and staffing services of entry-level and clerical or admin employees, construction and light industrial workers, semi-skilled trades, healthcare personnel, and professionals and executives. The company was founded in 1998 and is headquartered in Goose Creek, SC. |
| Insider Trading |
Relationship |
Date |
Transaction |
Cost |
#Shares |
Value ($) |
#Shares Total |
SEC Form 4 |
| Hermanns Richard | President and CEO | May 14 '24 | Buy | 12.07 | 10,000 | 120,720 | 3,049,329 | May 15 04:07 PM | | Hagenbuch Lawrence F | Director | Dec 19 '23 | Buy | 16.32 | 3,900 | 63,660 | 96,218 | Dec 20 08:27 AM | | Malhotra R. Rimmy | Director | Dec 15 '23 | Buy | 16.18 | 4,000 | 64,739 | 120,130 | Dec 18 04:05 PM | | Malhotra R. Rimmy | Director | Dec 15 '23 | Buy | 16.31 | 2,000 | 32,620 | 73,116 | Dec 18 04:05 PM | | Shanahan Kathleen M | Director | Nov 28 '23 | Buy | 15.00 | 1,866 | 27,981 | 57,532 | Nov 30 04:05 PM |
|
|
| |
 |
| Market Cap | 122.91M | EPS (ttm) | 2.41 |
| P/E | 7.79 | EPS this Y | - |
| Forward P/E | - | EPS next Y | - |
| PEG | - | EPS past 5Y | 21.36% |
| P/S | 1.05 | EPS next 5Y | - |
| P/B | 0.60 | EPS Q/Q | -30.29% |
| Dividend | 1.28% | Sales Q/Q | 20.93% |
| Insider Own | 43.73% | Inst Own | 21.19% |
| Insider Trans | 0.20% | Inst Trans | -1.34% |
| Short Float | 0.10% | Earnings | May 07/b |
| Analyst Recom | 3.00 | Target Price | 18.00 |
| Avg Volume | 5.79K | 52W Range | 14.69 - 22.00 |
|
|
|
May-07-24 10:57PM
|
CFBK Stock Earnings: CF Bankshares Reported Results for Q1 2024
(InvestorPlace) |
|
09:00AM
|
CF BANKSHARES INC., PARENT OF CFBANK NA, REPORTS RESULTS FOR THE 1st QUARTER 2024.
(PR Newswire) |
|
May-03-24 10:41AM
|
AAPL Shares Pop on $110 Billion Apple Stock Buyback Plans
(InvestorPlace) |
|
08:55AM
|
Why Is CF Bankshares (CFBK) Stock Down 19% Today?
(InvestorPlace) |
|
07:31AM
|
Today's Biggest Pre-Market Stock Movers: 10 Top Gainers and Losers on Friday
(InvestorPlace) |
|
Apr-23-24 12:11PM
|
CF BANKSHARES INC., PARENT OF CFBANK, NA, ANNOUNCES 3 KEY COMMERCIAL LEADERSHIP ADDITIONS TO CFBANK
(PR Newswire) |
|
Apr-08-24 09:00AM
|
CF BANKSHARES INC., PARENT OF CFBANK, NA, ANNOUNCES QUARTERLY CASH DIVIDEND.
(PR Newswire) |
|
Feb-07-24 09:00AM
|
CF BANKSHARES INC., PARENT OF CFBANK NA, REPORTS RESULTS FOR THE 4TH QUARTER AND FULL YEAR 2023.
(PR Newswire) |
|
Jan-03-24 09:00AM
|
CF BANKSHARES INC., PARENT OF CFBANK, NA, ANNOUNCES QUARTERLY CASH DIVIDEND.
(PR Newswire) |
|
Nov-08-23 09:00AM
|
CF BANKSHARES INC., PARENT OF CFBANK NA, REPORTS RESULTS FOR THE THIRD QUARTER 2023.
(PR Newswire) +5.33% |
|
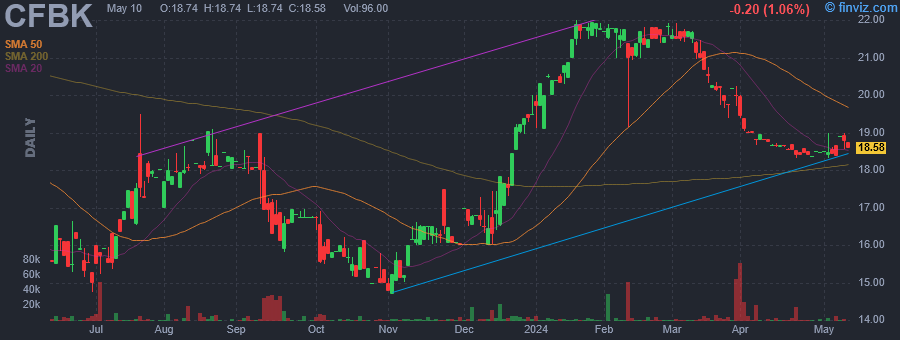
CF Bankshares, Inc. operates as a financial holding company which is engaged in the provision of business banking products and services. Its products and services include commercial loans and leases, commercial and residential real estate loans and treasury management depository services. The company was founded in September 1998 and is headquartered in Columbus, OH. |
| Insider Trading |
Relationship |
Date |
Transaction |
Cost |
#Shares |
Value ($) |
#Shares Total |
SEC Form 4 |
| ASH THOMAS P | Director | May 15 '24 | Buy | 18.96 | 500 | 9,478 | 43,119 | May 15 03:50 PM | | O'Dell Timothy T | CEO | May 14 '24 | Buy | 18.95 | 960 | 18,192 | 296,588 | May 15 04:07 PM | | O'Dell Timothy T | CEO | May 13 '24 | Buy | 18.89 | 1,333 | 25,186 | 297,921 | May 15 04:07 PM | | Royer David L | Director | Nov 29 '23 | Buy | 16.00 | 2,500 | 40,000 | 30,012 | Nov 30 04:16 PM | | ASH THOMAS P | Director | Nov 22 '23 | Buy | 17.50 | 500 | 8,750 | 39,444 | Nov 27 02:45 PM |
|
|
|
 |
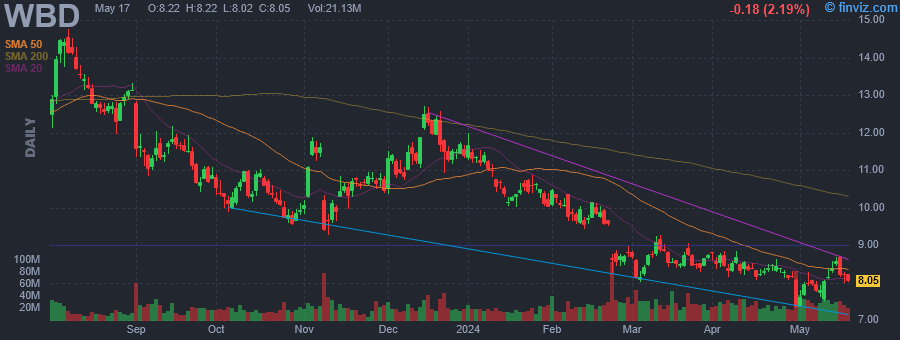
| Market Cap | 1.97B | EPS (ttm) | -3.50 |
| P/E | - | EPS this Y | 13.82% |
| Forward P/E | - | EPS next Y | 55.97% |
| PEG | - | EPS past 5Y | -16.93% |
| P/S | 6.76 | EPS next 5Y | - |
| P/B | 2.55 | EPS Q/Q | -7.51% |
| Dividend | - | Sales Q/Q | 38.78% |
| Insider Own | 0.54% | Inst Own | 42.51% |
| Insider Trans | -11.16% | Inst Trans | -1.97% |
| Short Float | 4.44% | Earnings | May 08/a |
| Analyst Recom | 1.15 | Target Price | 51.82 |
| Avg Volume | 647.22K | 52W Range | 13.48 - 37.92 |
|
|
|
|
Zai Lab Ltd. is a biopharmaceutical company, which engages in the developing and commercializing therapies that address medical conditions with unmet needs in oncology, autoimmune disorders, infectious diseases, and neuroscience. Its products include Zejula, Optune, Qinlock, and Nuzyra. The company was founded by Samantha Ying Du and Marietta Wu in April 2014 and is headquartered in Shanghai, China. |
| Insider Trading |
Relationship |
Date |
Transaction |
Cost |
#Shares |
Value ($) |
#Shares Total |
SEC Form 4 |
| Edmondson Frazor Titus III | Chief Legal Officer | May 14 '24 | Sale | 21.33 | 10,000 | 213,346 | 16,408 | May 16 04:52 PM | | Smiley Joshua L | See Remarks | May 13 '24 | Buy | 21.40 | 3,000 | 64,200 | 31,684 | May 15 04:03 PM | | Reinhart Harald | See Remarks | Apr 04 '24 | Sale | 15.67 | 2,105 | 32,992 | 51,800 | Apr 05 05:48 PM | | Smiley Joshua L | See Remarks | Apr 04 '24 | Sale | 15.67 | 1,988 | 31,158 | 28,684 | Apr 05 05:48 PM | | Amado Rafael | See Remarks | Apr 04 '24 | Sale | 15.67 | 1,952 | 30,594 | 23,532 | Apr 05 05:47 PM |
|
|
| |
 |
| Market Cap | 429.22M | EPS (ttm) | 2.47 |
| P/E | 12.77 | EPS this Y | 28.83% |
| Forward P/E | 10.29 | EPS next Y | 21.47% |
| PEG | 1.28 | EPS past 5Y | - |
| P/S | 0.88 | EPS next 5Y | 10.00% |
| P/B | 0.66 | EPS Q/Q | 380.37% |
| Dividend | 4.44% | Sales Q/Q | -25.59% |
| Insider Own | 50.07% | Inst Own | 38.62% |
| Insider Trans | 0.12% | Inst Trans | -1.05% |
| Short Float | 0.11% | Earnings | May 08/b |
| Analyst Recom | 3.00 | Target Price | 55.00 |
| Avg Volume | 5.57K | 52W Range | 25.21 - 37.00 |
|
|
|
|
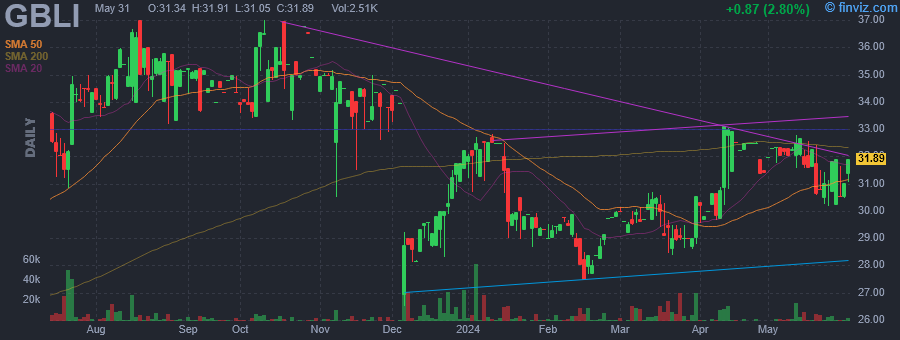
Global Indemnity Group LLC engages in providing diversified insurance and reinsurance services. It operates through the following segments: Commercial Specialty, Reinsurance Operations, and Exited Lines. The Commercial Specialty segment provides specialty and casualty products designed for product lines such as small business binding authority, property brokerage, vacant express and programs. The Specialty Property segment offers specialty personal lines property and casualty insurance products. The Reinsurance Operations segment provides reinsurance solutions through brokers and primary writers including insurance and reinsurance companies. The company was founded in 2003 and is headquartered in Bala Cynwyd, PA. |
| Insider Trading |
Relationship |
Date |
Transaction |
Cost |
#Shares |
Value ($) |
#Shares Total |
SEC Form 4 |
| BROWN JOSEPH W | Chief Executive | May 13 '24 | Buy | 32.47 | 8,000 | 259,745 | 155,404 | May 15 04:02 PM |
|
|
|
 |
| Market Cap | 436.96M | EPS (ttm) | -1.83 |
| P/E | - | EPS this Y | 1.79% |
| Forward P/E | 14.34 | EPS next Y | 289.90% |
| PEG | - | EPS past 5Y | -74.26% |
| P/S | 2.13 | EPS next 5Y | 13.00% |
| P/B | 2.22 | EPS Q/Q | -7.04% |
| Dividend | - | Sales Q/Q | -23.30% |
| Insider Own | 7.72% | Inst Own | 77.29% |
| Insider Trans | 0.27% | Inst Trans | -2.47% |
| Short Float | 24.58% | Earnings | May 09/a |
| Analyst Recom | 2.00 | Target Price | 15.33 |
| Avg Volume | 2.59M | 52W Range | 1.65 - 24.75 |
|
|
|
|
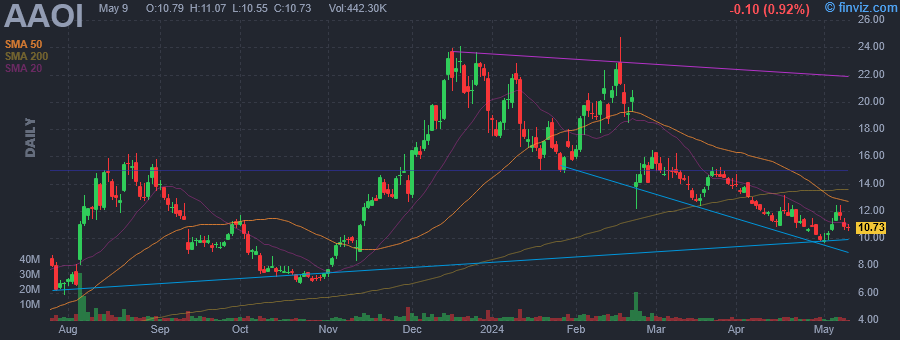
Applied Optoelectronics, Inc. engages in the design and manufacture of optical communications products. Its products include optical devices, such as laser diodes, photodiodes, related modules and circuitry, and equipment for applications in fiber-to-the-home, cable television, point to point communications and wireless. The company was founded by Chih Hsiang Lin on February 28, 1997 and is headquartered in Sugar Land, TX. |
| Insider Trading |
Relationship |
Date |
Transaction |
Cost |
#Shares |
Value ($) |
#Shares Total |
SEC Form 4 |
| Yeh William H | Director | May 14 '24 | Buy | 10.54 | 9,800 | 103,292 | 217,055 | May 15 04:02 PM | | Lin Che-Wei | Director | Mar 18 '24 | Buy | 12.70 | 31,370 | 398,283 | 220,133 | Mar 18 04:05 PM | | Lin Chih-Hsiang (Thompson) | President and CEO | Mar 18 '24 | Buy | 12.66 | 11,780 | 149,169 | 1,218,160 | Mar 18 04:04 PM | | Yeh William H | Director | Mar 18 '24 | Buy | 12.75 | 8,000 | 102,000 | 207,255 | Mar 19 04:20 PM | | Yeh William H | Director | Feb 27 '24 | Buy | 15.29 | 10,000 | 152,900 | 199,255 | Feb 28 04:02 PM |
|
|
| |
 |
| Market Cap | 20.17B | EPS (ttm) | -1.24 |
| P/E | - | EPS this Y | 48.73% |
| Forward P/E | 79.56 | EPS next Y | 115.76% |
| PEG | - | EPS past 5Y | - |
| P/S | 0.50 | EPS next 5Y | - |
| P/B | 0.46 | EPS Q/Q | 9.69% |
| Dividend | - | Sales Q/Q | -6.96% |
| Insider Own | 9.54% | Inst Own | 62.22% |
| Insider Trans | 0.04% | Inst Trans | -0.00% |
| Short Float | 4.79% | Earnings | May 09/b |
| Analyst Recom | 2.14 | Target Price | 12.11 |
| Avg Volume | 31.59M | 52W Range | 7.34 - 14.76 |
|
|
|
|
Warner Bros. Discovery, Inc. is a premier global media and entertainment company, which engages in the provision of a differentiated portfolio of content, brands, and franchises across television, film, streaming, and gaming. It operates through the following segments: Studios, Networks, Direct-to-Consumer (DTC), and Corporate. The Studios segment includes producing and releasing feature films for initial exhibition in theaters, producing and initial licensing television programs to networks services as well as third parties, distributing films and television programs to various third party, internal television, and streaming services, distribution through the home entertainment market related consumer products, and themed experience licensing and interactive gaming. The Networks segment focuses on domestic and international television networks. The DTC segment is involved in premium pay-television and streaming services. The company was founded on June 17, 1985 and is headquartered in New York, NY. |
| Insider Trading |
Relationship |
Date |
Transaction |
Cost |
#Shares |
Value ($) |
#Shares Total |
SEC Form 4 |
| Zeiler Gerhard | President, International | May 13 '24 | Buy | 8.30 | 100,000 | 830,000 | 908,130 | May 15 04:02 PM | | ADVANCE/NEWHOUSE PARTNERSHIP | Director | Dec 14 '23 | Buy | 12.49 | 10,000,000 | 124,900,000 | 14,158,459 | Dec 15 06:52 PM | | Newhouse Steven O | Director | Dec 14 '23 | Buy | 12.49 | 10,000,000 | 124,900,000 | 14,158,459 | Dec 15 06:54 PM | | Newhouse Steven O | Director | Dec 14 '23 | Sale | 12.49 | 10,000,000 | 124,900,000 | 184,023,290 | Dec 15 06:54 PM | | ADVANCE/NEWHOUSE PROGRAMMING P | Director | Dec 14 '23 | Sale | 12.49 | 10,000,000 | 124,900,000 | 184,023,290 | Dec 15 06:56 PM |
|
|
|
 |
| Market Cap | 844.58M | EPS (ttm) | 0.46 |
| P/E | 14.16 | EPS this Y | -21.50% |
| Forward P/E | 8.35 | EPS next Y | 23.25% |
| PEG | - | EPS past 5Y | - |
| P/S | 2.16 | EPS next 5Y | -2.30% |
| P/B | 1.31 | EPS Q/Q | -55.01% |
| Dividend | 6.81% | Sales Q/Q | -2.53% |
| Insider Own | 60.07% | Inst Own | 24.82% |
| Insider Trans | 0.07% | Inst Trans | -0.73% |
| Short Float | 3.06% | Earnings | May 09/a |
| Analyst Recom | 1.75 | Target Price | 8.20 |
| Avg Volume | 367.76K | 52W Range | 5.13 - 8.14 |
|
|
|
|
Granite Ridge Resources, Inc. engages in the exploration, development, and production of oil and natural gas. The company was founded on May 9, 2022 and is headquartered in Dallas, TX. |
| Insider Trading |
Relationship |
Date |
Transaction |
Cost |
#Shares |
Value ($) |
#Shares Total |
SEC Form 4 |
| Farquharson Tyler | Chief Financial Officer | May 14 '24 | Buy | 6.35 | 5,000 | 31,750 | 71,723 | May 15 03:59 PM | | Brandenberg Luke C | President and CEO | May 14 '24 | Buy | 6.25 | 5,000 | 31,250 | 81,633 | May 14 06:18 PM | | Brandenberg Luke C | President and CEO | Mar 15 '24 | Buy | 6.20 | 5,000 | 31,000 | 77,947 | Mar 18 05:35 PM | | Farquharson Tyler | Chief Financial Officer | Mar 15 '24 | Buy | 6.20 | 5,000 | 31,000 | 68,037 | Mar 18 07:28 PM | | MCCARTNEY JOHN | Director | Mar 15 '24 | Buy | 6.19 | 2,000 | 12,380 | 42,839 | Mar 18 05:27 PM |
|
|
|
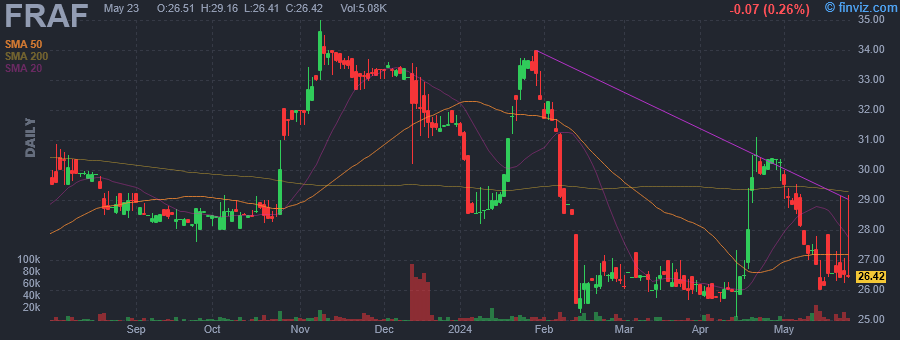 |
| Market Cap | 116.82M | EPS (ttm) | 3.12 |
| P/E | 8.50 | EPS this Y | - |
| Forward P/E | - | EPS next Y | - |
| PEG | - | EPS past 5Y | 17.42% |
| P/S | 1.17 | EPS next 5Y | - |
| P/B | 0.87 | EPS Q/Q | 2.82% |
| Dividend | 4.82% | Sales Q/Q | 41.37% |
| Insider Own | 6.23% | Inst Own | 24.46% |
| Insider Trans | 1.31% | Inst Trans | - |
| Short Float | 0.20% | Earnings | Jan 30/a |
| Analyst Recom | - | Target Price | - |
| Avg Volume | 4.88K | 52W Range | 25.11 - 35.00 |
|
|
|
|
Franklin Financial Services Corp. is a bank holding company, which engages in financial services and offers traditional banking. It offers commercial and retail financial services, including the taking of time, savings and demand deposits, the making of commercial, consumer and mortgage loans, and the providing of safe deposit services. The company was founded on June 1, 1983 and is headquartered in Chambersburg, PA. |
| Insider Trading |
Relationship |
Date |
Transaction |
Cost |
#Shares |
Value ($) |
#Shares Total |
SEC Form 4 |
| Carmack Karen K | SVP | May 15 '24 | Buy | 27.50 | 1 | 28 | 3,030 | May 15 02:45 PM | | Duffey Gregory A | Director | May 03 '24 | Buy | 29.00 | 2,000 | 58,000 | 17,964 | May 07 02:08 PM | | JENNINGS ALLAN E JR | Director | May 01 '24 | Buy | 30.14 | 1,000 | 30,140 | 26,307 | May 03 10:27 AM | | Rzomp Kimberly | Director | May 01 '24 | Buy | 30.14 | 500 | 15,070 | 7,008 | May 03 10:31 AM | | Carroll Charles Benner Jr | COO | Apr 29 '24 | Buy | 30.36 | 50 | 1,518 | 2,550 | Apr 30 09:32 AM |
|
|
|
