 |
| Market Cap | 2.35M | EPS (ttm) | -0.94 |
| P/E | - | EPS this Y | - |
| Forward P/E | - | EPS next Y | - |
| PEG | - | EPS past 5Y | -126.21% |
| P/S | 117.38 | EPS next 5Y | - |
| P/B | 0.06 | EPS Q/Q | -292.20% |
| Dividend | - | Sales Q/Q | - |
| Insider Own | 2.53% | Inst Own | 0.53% |
| Insider Trans | 0.00% | Inst Trans | 1.70% |
| Short Float | 0.58% | Earnings | - |
| Analyst Recom | 1.00 | Target Price | 100.00 |
| Avg Volume | 4.24M | 52W Range | 0.09 - 25.25 |
|
|
|
|
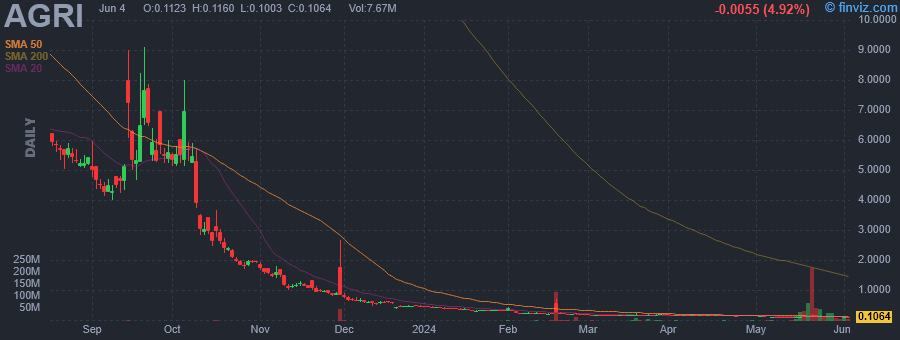
AgriFORCE Growing Systems Ltd. is an agriculture technology company, which engages in the development and utilization of intellectual property (IP) assets for improvement. Its solutions include consulting, air and surface sterilization, and other projects. The company was founded on December 22, 2017 and is headquartered in Vancouver, Canada. |
| Insider Trading |
Relationship |
Date |
Transaction |
Cost |
#Shares |
Value ($) |
#Shares Total |
SEC Form 4 |
| Mueller Ingo Wilhelm | Director | Aug 01 '23 | Sale | 0.13 | 100,000 | 13,000 | 273,577 | Aug 03 04:00 PM | | Mueller Ingo Wilhelm | CEO and Chairman | Jul 20 '23 | Sale | 0.14 | 200,000 | 28,111 | 373,577 | Jul 21 05:26 PM | | Mueller Ingo Wilhelm | CEO and Chairman | Jul 19 '23 | Sale | 0.14 | 200,000 | 28,984 | 573,577 | Jul 21 05:26 PM | | Mueller Ingo Wilhelm | CEO and Chairman | Jul 18 '23 | Sale | 0.16 | 250,000 | 39,040 | 773,577 | Jul 21 05:26 PM |
|
|
 |
 |
| Market Cap | 1.15M | EPS (ttm) | -0.72 |
| P/E | - | EPS this Y | - |
| Forward P/E | - | EPS next Y | - |
| PEG | - | EPS past 5Y | - |
| P/S | 0.03 | EPS next 5Y | 23.00% |
| P/B | 0.17 | EPS Q/Q | - |
| Dividend | - | Sales Q/Q | - |
| Insider Own | 34.94% | Inst Own | 7.50% |
| Insider Trans | 0.00% | Inst Trans | - |
| Short Float | 8.14% | Earnings | Apr 25/b |
| Analyst Recom | 1.00 | Target Price | 70.00 |
| Avg Volume | 484.09K | 52W Range | 0.75 - 10.20 |
|
|
|
|
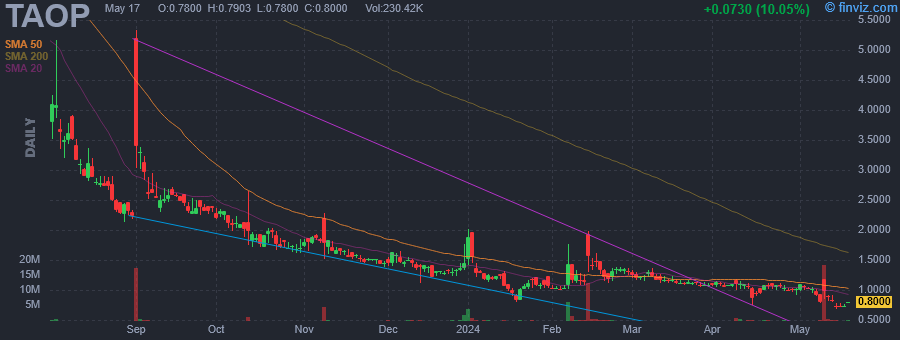
Taoping, Inc. operates as block chain technology and smart cloud services provider. It operates through the following segments: Cloud-based Technology, Blockchain Technology, Traditional Information Technology. The CBT segment includes the company's cloud based products and data storage related services sold to private sectors. The BT segment is the company's Crypto currency mining initiative. The TIT segment is involved in the company's project-based technology products and services sold to the public sector such as Geographic Information System, Digital Public Security Technology, and Digital Hospital Information Systems. The company was founded in 1993 and is headquartered in Hong Kong. |
|
|
 |
| Market Cap | 4.53M | EPS (ttm) | 0.20 |
| P/E | 3.60 | EPS this Y | - |
| Forward P/E | - | EPS next Y | - |
| PEG | - | EPS past 5Y | -47.02% |
| P/S | 0.04 | EPS next 5Y | - |
| P/B | 0.03 | EPS Q/Q | 34.52% |
| Dividend | - | Sales Q/Q | -12.72% |
| Insider Own | 0.76% | Inst Own | 0.41% |
| Insider Trans | 0.00% | Inst Trans | -73.20% |
| Short Float | 0.35% | Earnings | - |
| Analyst Recom | - | Target Price | - |
| Avg Volume | 73.90K | 52W Range | 0.77 - 4.40 |
|
|
|
|
Farmmi, Inc. is a holding company, which engages in e-commerce and technology enterprise that offers trading platforms for agricultural products. Its products include Shiitake Mushroom, Mu Er Mushroom, and other edible fungi and other agricultural products. The company was founded by Ye Fang Zhang and Zheng Yu Wang in 2003 and is headquartered in Lishui, China. |
|
| |
 |
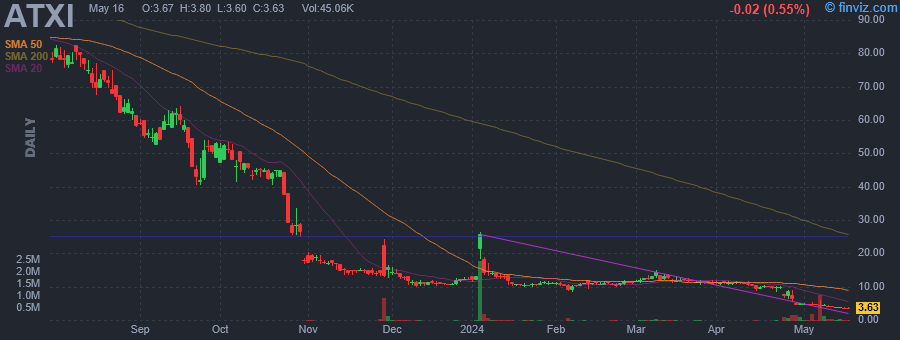
| Market Cap | 260.80M | EPS (ttm) | -7.45 |
| P/E | - | EPS this Y | - |
| Forward P/E | - | EPS next Y | - |
| PEG | - | EPS past 5Y | -1240.46% |
| P/S | 49.12 | EPS next 5Y | - |
| P/B | 0.21 | EPS Q/Q | -2551.62% |
| Dividend | - | Sales Q/Q | -47.31% |
| Insider Own | 18.39% | Inst Own | 6.57% |
| Insider Trans | 0.00% | Inst Trans | -3.35% |
| Short Float | 0.13% | Earnings | Nov 14/b |
| Analyst Recom | 3.00 | Target Price | 13.50 |
| Avg Volume | 47.94K | 52W Range | 3.03 - 33.90 |
|
|
|
|
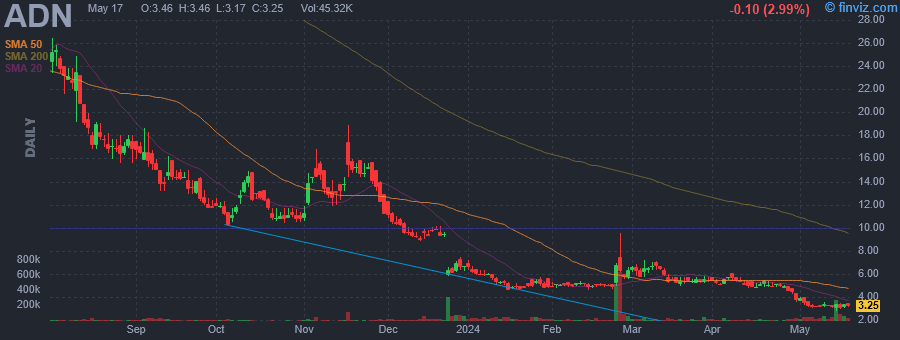
Advent Technologies Holdings, Inc. operates as an advanced materials and technology development company. It develops, manufactures and assembles hydrogen fuel cell components. The company was founded on June 18, 2018 and is headquartered in Boston, MA. |
| Insider Trading |
Relationship |
Date |
Transaction |
Cost |
#Shares |
Value ($) |
#Shares Total |
SEC Form 4 |
| Brackman Kevin L. | CFO | Sep 06 '23 | Sale | 0.53 | 27,771 | 14,746 | 176,477 | Sep 08 05:00 PM | | Gregoriou Vassilios | CEO, Chair | Sep 06 '23 | Sale | 0.53 | 14,157 | 7,517 | 6,367,669 | Sep 08 05:00 PM |
|
|
|
 |
| Market Cap | 143.20M | EPS (ttm) | -1.47 |
| P/E | - | EPS this Y | 28.71% |
| Forward P/E | - | EPS next Y | 37.75% |
| PEG | - | EPS past 5Y | -37.60% |
| P/S | 1.53 | EPS next 5Y | - |
| P/B | 4.37 | EPS Q/Q | 2.69% |
| Dividend | - | Sales Q/Q | -14.29% |
| Insider Own | 55.63% | Inst Own | 29.70% |
| Insider Trans | -0.14% | Inst Trans | 3.88% |
| Short Float | 4.73% | Earnings | May 13/a |
| Analyst Recom | 1.38 | Target Price | 6.71 |
| Avg Volume | 195.72K | 52W Range | 3.04 - 8.80 |
|
|
|
|
Akoya Biosciences, Inc. is a life sciences technology company delivering spatial biology solutions focused on transforming discovery and clinical research. The company offers comprehensive single-cell imaging solutions that allow researchers to phenotype cells with spatial context and visualize how they organize and interact to influence disease progression and treatment response. Akoya offers two distinct solutions, the CODEX and Phenoptics platforms, to serve the diverse needs of researchers across discovery, translational and clinical research. The company was founded by Garry Nolan, Yury Goltsev and Nikolay Samusik in 2015 and is headquartered in Marlborough, MA. |
| Insider Trading |
Relationship |
Date |
Transaction |
Cost |
#Shares |
Value ($) |
#Shares Total |
SEC Form 4 |
| McKelligon Brian | President and CEO | Mar 20 '24 | Option Exercise | 0.30 | 7,500 | 2,272 | 239,368 | Mar 22 05:54 PM | | McKelligon Brian | President and CEO | Mar 20 '24 | Sale | 4.97 | 7,500 | 37,243 | 231,868 | Mar 22 05:54 PM | | McKelligon Brian | President and CEO | Mar 13 '24 | Sale | 4.94 | 7,500 | 37,035 | 224,368 | Mar 14 08:41 PM | | McKelligon Brian | President and CEO | Dec 19 '23 | Option Exercise | 0.30 | 7,500 | 2,272 | 160,063 | Dec 20 07:16 PM | | McKelligon Brian | President and CEO | Dec 19 '23 | Sale | 4.48 | 7,500 | 33,566 | 152,563 | Dec 20 07:16 PM |
|
|
| |
 |
| Market Cap | 4.03M | EPS (ttm) | -5.34 |
| P/E | - | EPS this Y | - |
| Forward P/E | - | EPS next Y | - |
| PEG | - | EPS past 5Y | 62.30% |
| P/S | 2.04 | EPS next 5Y | - |
| P/B | - | EPS Q/Q | 94.28% |
| Dividend | - | Sales Q/Q | -28.34% |
| Insider Own | 8.70% | Inst Own | 11.49% |
| Insider Trans | 12.34% | Inst Trans | -46.15% |
| Short Float | 6.87% | Earnings | - |
| Analyst Recom | 1.00 | Target Price | 4.00 |
| Avg Volume | 455.00K | 52W Range | 0.26 - 49.80 |
|
|
|
|
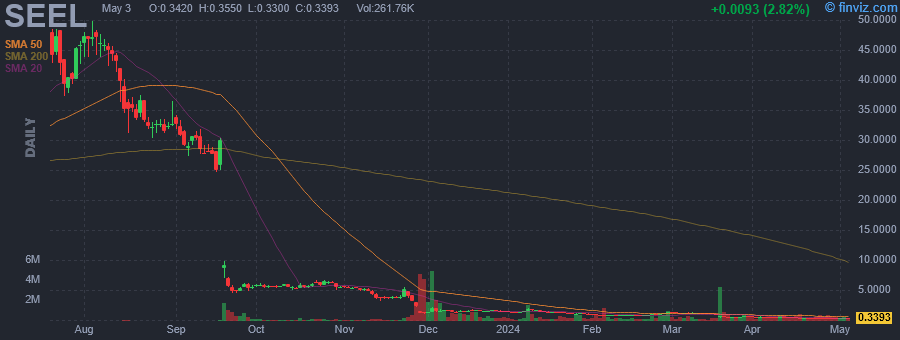
Seelos Therapeutics, Inc. is a clinical-stage biopharmaceutical company. It engages in the development of products that address significant unmet needs in Central Nervous System (CNS) disorders and other rare disorders. The company was founded by Raj Mehra in 1987 and is headquartered in New York, NY. |
| Insider Trading |
Relationship |
Date |
Transaction |
Cost |
#Shares |
Value ($) |
#Shares Total |
SEC Form 4 |
| Mehra Raj | See Remarks | Dec 01 '23 | Buy | 1.32 | 75,757 | 99,999 | 185,142 | Dec 01 04:16 PM | | Golembiewski Michael Joseph | Chief Financial Officer | Nov 30 '23 | Buy | 1.21 | 83,000 | 100,222 | 86,450 | Dec 01 04:16 PM |
|
|
|
 |
| Market Cap | 33.98M | EPS (ttm) | -2.20 |
| P/E | - | EPS this Y | - |
| Forward P/E | - | EPS next Y | - |
| PEG | - | EPS past 5Y | 18.24% |
| P/S | 0.08 | EPS next 5Y | - |
| P/B | 0.60 | EPS Q/Q | -495.69% |
| Dividend | - | Sales Q/Q | 5.16% |
| Insider Own | 26.31% | Inst Own | 45.23% |
| Insider Trans | 0.00% | Inst Trans | 1.44% |
| Short Float | 3.61% | Earnings | May 13/a |
| Analyst Recom | 3.00 | Target Price | 5.00 |
| Avg Volume | 33.26K | 52W Range | 1.81 - 4.00 |
|
|
|
|
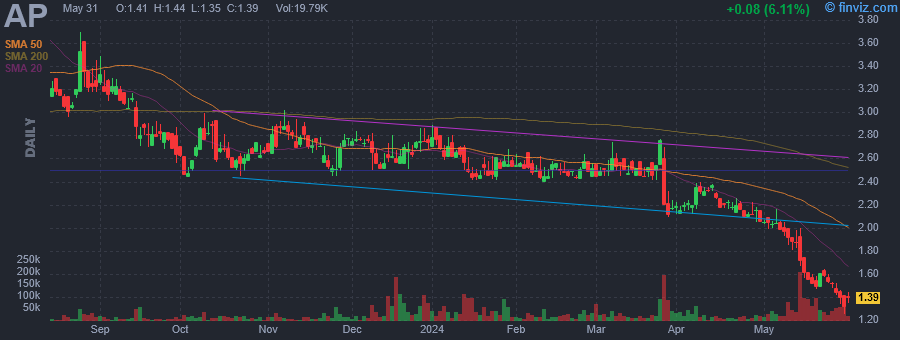
Ampco-Pittsburgh Corp. is engaged in the manufacture and sale of custom designed engineering products. It operates through the Forged and Cast Engineered Products, and Air and Liquid Processing segments. The Forged and Cast Engineered Products segment produces forged hardened steel rolls, cast rolls and open-die forged products. Forged hardened steel rolls are used primarily in cold rolling mills by producers of steel, aluminum and other metals. The Air and Liquid Processing segment includes the Aerofin, Buffalo Air Handling, and Buffalo Pumps divisions. The company was founded in 1929 and is headquartered in Carnegie, PA. |
| Insider Trading |
Relationship |
Date |
Transaction |
Cost |
#Shares |
Value ($) |
#Shares Total |
SEC Form 4 |
| McNair Darrell L | Director | Sep 13 '23 | Buy | 3.12 | 3,000 | 9,360 | 6,640 | Sep 20 12:46 PM | | DiSanto Frederick D. | Director | Jun 29 '23 | Buy | 2.99 | 7,399 | 22,123 | 47,177 | Jul 03 11:41 AM | | DiSanto Frederick D. | Director | Jun 28 '23 | Buy | 2.85 | 918 | 2,616 | 39,778 | Jul 03 11:41 AM | | DiSanto Frederick D. | Director | Jun 23 '23 | Buy | 2.94 | 2,000 | 5,880 | 38,860 | Jun 26 11:35 AM | | DiSanto Frederick D. | Director | Jun 22 '23 | Buy | 2.94 | 5,000 | 14,700 | 36,860 | Jun 26 11:35 AM |
|
|
| |
 |
| Market Cap | 2.30M | EPS (ttm) | 4.87 |
| P/E | 0.79 | EPS this Y | 58.16% |
| Forward P/E | - | EPS next Y | 9.76% |
| PEG | - | EPS past 5Y | 50.07% |
| P/S | - | EPS next 5Y | - |
| P/B | 0.83 | EPS Q/Q | 358.44% |
| Dividend | - | Sales Q/Q | - |
| Insider Own | 11.77% | Inst Own | 2.97% |
| Insider Trans | -89.73% | Inst Trans | - |
| Short Float | 3.23% | Earnings | Mar 18/a |
| Analyst Recom | 1.00 | Target Price | 56.25 |
| Avg Volume | 61.58K | 52W Range | 3.80 - 93.75 |
|
|
|
|
Avenue Therapeutics, Inc. is a specialty pharmaceutical company, which engages in acquiring, licensing, and commercializing products for use in the intensive care hospital setting. It focuses on the development of intravenous tramadol, a potential alternative that could reduce the use of conventional opioids for patients suffering from acute pain. The company was founded on February 9, 2015 and is headquartered in Bay Harbor Islands, FL. |
| Insider Trading |
Relationship |
Date |
Transaction |
Cost |
#Shares |
Value ($) |
#Shares Total |
SEC Form 4 |
| Davidow Robert L | 10% Owner | Dec 11 '23 | Sale | 0.14 | 353,000 | 49,600 | 22,000 | Dec 13 04:02 PM | | Davidow Robert L | 10% Owner | Dec 11 '23 | Sale | 0.14 | 264,000 | 36,960 | 681,000 | Dec 13 04:02 PM | | Fortress Biotech, Inc. | 10% Owner | Sep 08 '23 | Buy | 0.72 | 418,410 | 301,255 | 1,032,390 | Sep 12 09:02 AM | | ROSENWALD LINDSAY A MD | Director | Sep 08 '23 | Buy | 0.72 | 348,675 | 251,046 | 354,318 | Sep 12 09:03 AM |
|
|
|
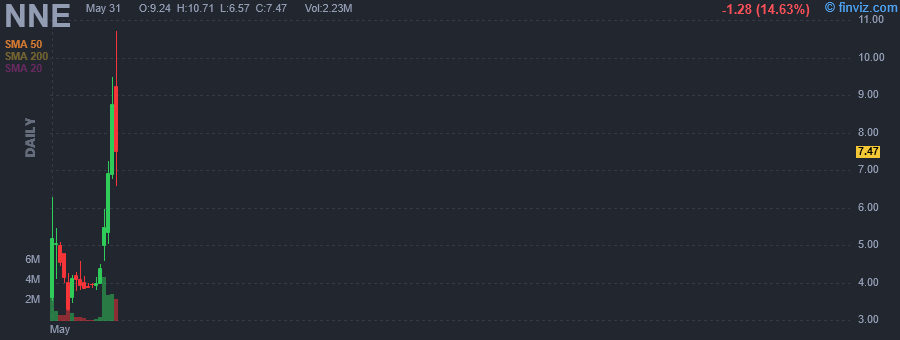 |
| Market Cap | 93.14M | EPS (ttm) | -0.24 |
| P/E | - | EPS this Y | -505.70% |
| Forward P/E | - | EPS next Y | - |
| PEG | - | EPS past 5Y | - |
| P/S | - | EPS next 5Y | - |
| P/B | - | EPS Q/Q | -88.60% |
| Dividend | - | Sales Q/Q | - |
| Insider Own | 47.83% | Inst Own | - |
| Insider Trans | 0.00% | Inst Trans | - |
| Short Float | - | Earnings | - |
| Analyst Recom | - | Target Price | - |
| Avg Volume | 1.80M | 52W Range | 3.51 - 6.27 |
|
|
|
|
NANO Nuclear Energy Inc. operates as a microreactor technology company. The company is developing ZEUS, a solid-core battery reactor, and ODIN, a low-pressure coolant reactor. It is also developing a high-assay low-enriched uranium fabrication facility to supply fuel to the nuclear reactor industry and fuel transportation and nuclear consultation businesses. The company was founded in 2021 and is based in New York, New York. |
|
|
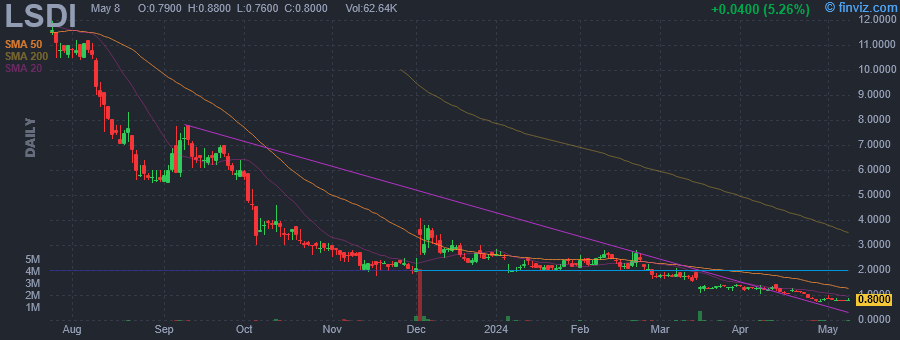 |
| Market Cap | 1.18M | EPS (ttm) | -0.72 |
| P/E | - | EPS this Y | - |
| Forward P/E | - | EPS next Y | - |
| PEG | - | EPS past 5Y | - |
| P/S | 58.96 | EPS next 5Y | - |
| P/B | 145.65 | EPS Q/Q | -78.19% |
| Dividend | - | Sales Q/Q | - |
| Insider Own | 36.91% | Inst Own | 6.72% |
| Insider Trans | 0.00% | Inst Trans | - |
| Short Float | 3.33% | Earnings | - |
| Analyst Recom | 1.00 | Target Price | 14.00 |
| Avg Volume | 52.65K | 52W Range | 0.70 - 17.00 |
|
|
|
|
Lucy Scientific Discovery, Inc. is an early-stage company, which engages in the manufacture of psychotropics contracts. It focuses on the research, development, and manufacture of psychotropics-based medicines. Its products include raw materials, crude extracts, targeted formulations, white and private label products, and single molecule fractions. The company was founded on February 17, 2017 and is headquartered in Victoria, Canada. |
|
|
