 |
| Market Cap | 1.05B | EPS (ttm) | 5.68 |
| P/E | 9.45 | EPS this Y | 4.94% |
| Forward P/E | 7.61 | EPS next Y | 11.56% |
| PEG | 1.04 | EPS past 5Y | 14.89% |
| P/S | 0.65 | EPS next 5Y | 9.08% |
| P/B | - | EPS Q/Q | -0.62% |
| Dividend | 3.28% | Sales Q/Q | -7.68% |
| Insider Own | 2.30% | Inst Own | 102.89% |
| Insider Trans | -5.37% | Inst Trans | -2.17% |
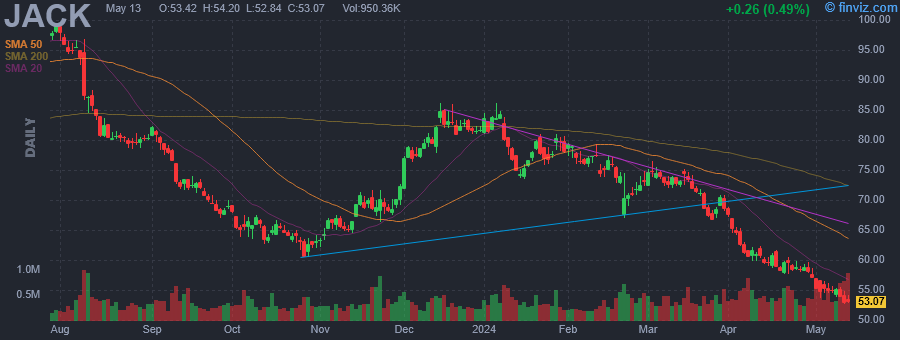
| Short Float | 6.46% | Earnings | May 14/b |
| Analyst Recom | 2.37 | Target Price | 68.44 |
| Avg Volume | 507.13K | 52W Range | 52.63 - 99.56 |
|
|
|
|
Jack in the Box, Inc. engages in developing, operating, and franchising a chain of quick-service and fast-casual restaurants. It operates through the Jack in the Box and Del Taco segments. The Jack in the Box segment offers a selection of distinctive products including classic burgers and other product lines such as Buttery Jack Burgers. The Del Taco segment focuses on both Mexican and American favorites such as burritos and fries. The company was founded by Robert Oscar Peterson in 1951 and is headquartered in San Diego, CA. |
| Insider Trading |
Relationship |
Date |
Transaction |
Cost |
#Shares |
Value ($) |
#Shares Total |
SEC Form 4 |
| Piano Steven | SVP, CHIEF PEOPLE OFFICER | May 13 '24 | Sale | 53.42 | 148 | 7,906 | 9,112 | May 13 05:33 PM | | MURPHY MICHAEL W | Director | Mar 13 '24 | Sale | 72.58 | 1,332 | 96,677 | 71,035 | Mar 13 06:38 PM | | Ostrom Ryan Lee | EVP, Chief Mktng&Digtl Officer | Feb 16 '24 | Sale | 76.06 | 328 | 24,948 | 17,946 | Feb 16 06:10 PM | | HOOPER DAWN E | SVP, Controller | Feb 06 '24 | Sale | 76.53 | 223 | 17,066 | 6,149 | Feb 06 07:04 PM | | HARRIS DARIN S | DIRECTOR & CEO | Dec 21 '23 | Sale | 81.56 | 3,823 | 311,804 | 91,485 | Dec 21 06:35 PM |
|
|
 |
 |
| Market Cap | 137.52M | EPS (ttm) | -1.47 |
| P/E | - | EPS this Y | 28.71% |
| Forward P/E | - | EPS next Y | 37.75% |
| PEG | - | EPS past 5Y | -37.60% |
| P/S | 1.47 | EPS next 5Y | - |
| P/B | 4.20 | EPS Q/Q | 2.69% |
| Dividend | - | Sales Q/Q | -14.29% |
| Insider Own | 55.63% | Inst Own | 29.70% |
| Insider Trans | -0.14% | Inst Trans | 3.88% |
| Short Float | 4.73% | Earnings | May 13/a |
| Analyst Recom | 1.38 | Target Price | 6.71 |
| Avg Volume | 195.72K | 52W Range | 2.78 - 8.80 |
|
|
|
|
Akoya Biosciences, Inc. is a life sciences technology company delivering spatial biology solutions focused on transforming discovery and clinical research. The company offers comprehensive single-cell imaging solutions that allow researchers to phenotype cells with spatial context and visualize how they organize and interact to influence disease progression and treatment response. Akoya offers two distinct solutions, the CODEX and Phenoptics platforms, to serve the diverse needs of researchers across discovery, translational and clinical research. The company was founded by Garry Nolan, Yury Goltsev and Nikolay Samusik in 2015 and is headquartered in Marlborough, MA. |
| Insider Trading |
Relationship |
Date |
Transaction |
Cost |
#Shares |
Value ($) |
#Shares Total |
SEC Form 4 |
| McKelligon Brian | President and CEO | Mar 20 '24 | Option Exercise | 0.30 | 7,500 | 2,272 | 239,368 | Mar 22 05:54 PM | | McKelligon Brian | President and CEO | Mar 20 '24 | Sale | 4.97 | 7,500 | 37,243 | 231,868 | Mar 22 05:54 PM | | McKelligon Brian | President and CEO | Mar 13 '24 | Sale | 4.94 | 7,500 | 37,035 | 224,368 | Mar 14 08:41 PM | | McKelligon Brian | President and CEO | Dec 19 '23 | Option Exercise | 0.30 | 7,500 | 2,272 | 160,063 | Dec 20 07:16 PM | | McKelligon Brian | President and CEO | Dec 19 '23 | Sale | 4.48 | 7,500 | 33,566 | 152,563 | Dec 20 07:16 PM |
|
|
|
 |
| Market Cap | 641.11M | EPS (ttm) | 0.66 |
| P/E | 11.58 | EPS this Y | -18.03% |
| Forward P/E | 8.03 | EPS next Y | 27.32% |
| PEG | 0.58 | EPS past 5Y | 40.40% |
| P/S | 0.80 | EPS next 5Y | 20.00% |
| P/B | 2.76 | EPS Q/Q | -82.37% |
| Dividend | 2.62% | Sales Q/Q | -6.64% |
| Insider Own | 3.10% | Inst Own | 90.60% |
| Insider Trans | -5.38% | Inst Trans | -1.68% |
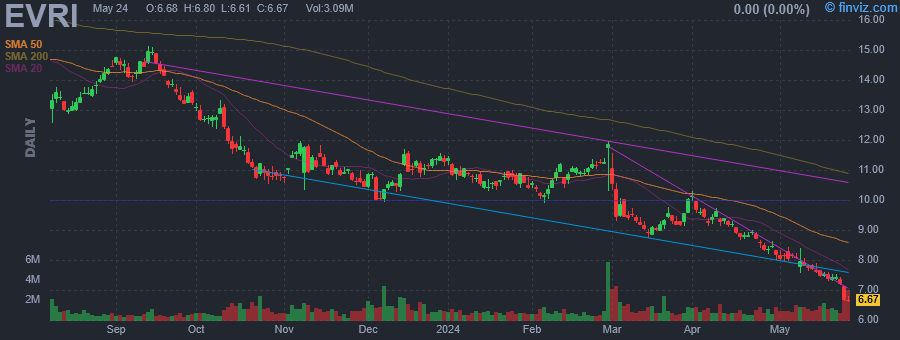
| Short Float | 4.61% | Earnings | May 08/b |
| Analyst Recom | 2.00 | Target Price | 12.00 |
| Avg Volume | 1.18M | 52W Range | 7.57 - 16.08 |
|
|
|
|
Everi Holdings, Inc. engages in the provision of technology solutions to the casino, interactive, and gaming industry. It operates through the Games and Financial Technology Solutions (FinTech) segments. The Games segment focuses on leased gaming equipment, sales of gaming equipment, gaming systems, interactive solutions, and ancillary products and services. The FinTech segment provides access to cash at gaming facilities via ATM cash withdrawals, credit card cash access transactions and point of sale debit card cash access transactions, check-related services, fully integrated kiosks and maintenance services, compliance, audit and data software, casino credit data, and reporting services and other ancillary offerings. The company was founded on February 4, 2004 and is headquartered in Las Vegas, NV. |
| Insider Trading |
Relationship |
Date |
Transaction |
Cost |
#Shares |
Value ($) |
#Shares Total |
SEC Form 4 |
| TAYLOR RANDY L | President & CEO | May 14 '24 | Sale | 7.65 | 28,713 | 219,634 | 585,281 | May 14 09:03 PM | | EHRLICH DEAN A | EVP, Games Business Leader | May 14 '24 | Sale | 7.67 | 6,337 | 48,613 | 163,622 | May 14 09:05 PM | | Labay Mark F. | EVP, CFO | May 14 '24 | Sale | 7.68 | 5,120 | 39,332 | 159,660 | May 14 09:04 PM | | Rumbolz Michael D | Executive Chairman | May 14 '24 | Sale | 7.60 | 5,040 | 38,304 | 1,082,062 | May 14 09:04 PM | | Lowenhar-Fisher Kate C. | EVP, Chief Legal Officer | May 14 '24 | Sale | 7.65 | 4,742 | 36,279 | 50,151 | May 14 09:05 PM |
|
|
| |
 |
| Market Cap | 534.95M | EPS (ttm) | 0.17 |
| P/E | 64.09 | EPS this Y | -0.28% |
| Forward P/E | 21.59 | EPS next Y | 37.84% |
| PEG | - | EPS past 5Y | - |
| P/S | 2.42 | EPS next 5Y | - |
| P/B | 6.77 | EPS Q/Q | 126.64% |
| Dividend | - | Sales Q/Q | 5.24% |
| Insider Own | 35.21% | Inst Own | 79.02% |
| Insider Trans | -0.01% | Inst Trans | 0.02% |
| Short Float | 18.15% | Earnings | May 15/b |
| Analyst Recom | 1.67 | Target Price | 18.00 |
| Avg Volume | 468.46K | 52W Range | 10.82 - 20.00 |
|
|
|
|
European Wax Center, Inc. engages in the business of managing franchisee and operation of out-of-home waxing services by number of centers and system-wide sales. The firm is also involved in selling franchises, distributing facial and body waxing products to franchisees which are used to perform waxing services, and providing branded facial and body waxing products directly to consumers. The company was founded in 2004 and is headquartered in Plano, TX. |
| Insider Trading |
Relationship |
Date |
Transaction |
Cost |
#Shares |
Value ($) |
#Shares Total |
SEC Form 4 |
| Thomassee Cindy | CAO and Controller | Mar 11 '24 | Sale | 14.76 | 1,200 | 17,706 | 86,900 | Mar 12 04:00 PM |
|
|
|
 |
| Market Cap | 6.50B | EPS (ttm) | -4.83 |
| P/E | - | EPS this Y | - |
| Forward P/E | - | EPS next Y | - |
| PEG | - | EPS past 5Y | - |
| P/S | 0.90 | EPS next 5Y | - |
| P/B | - | EPS Q/Q | -19.78% |
| Dividend | - | Sales Q/Q | 19.89% |
| Insider Own | - | Inst Own | - |
| Insider Trans | - | Inst Trans | - |
| Short Float | - | Earnings | - |
| Analyst Recom | - | Target Price | - |
| Avg Volume | 5.96M | 52W Range | 25.51 - 32.24 |
|
|
|
|
ZEEKR Intelligent Technology Holding Ltd. engages in the commercialization and sale of electric vehicles and batteries, and provision of automotive related research and development services through its subsidiaries. It operates through the following segments: ZEEKR, Viridi, and China-Euro Vehicle Technology (CEVT). The ZEEKR segment deals with operations and distribution of vehicles mainly located in People's Republic of China (PRC) and Europe, and certain electric vehicle research and development services primarily within PRC. The Viridi segment includes batteries and other components manufacturing operations located in PRC, with batteries and other component distributed to Europe and PRC. The CEVT segment focuses on research and development operation located in Sweden, with service delivered primarily to related parties in China. The company was founded by Shu Fu Li, Cong Hui An, Dong Hui Li, and Sheng Yue Gui on March 31, 2021 and is headquartered in Ningbo, China. |
|
| |
 |
| Market Cap | 2.55B | EPS (ttm) | -0.40 |
| P/E | - | EPS this Y | 26.04% |
| Forward P/E | 26.64 | EPS next Y | 12.02% |
| PEG | - | EPS past 5Y | 2.84% |
| P/S | 4.04 | EPS next 5Y | 19.72% |
| P/B | 1.97 | EPS Q/Q | 183.65% |
| Dividend | - | Sales Q/Q | 15.81% |
| Insider Own | 54.95% | Inst Own | 41.42% |
| Insider Trans | -11.73% | Inst Trans | -3.51% |
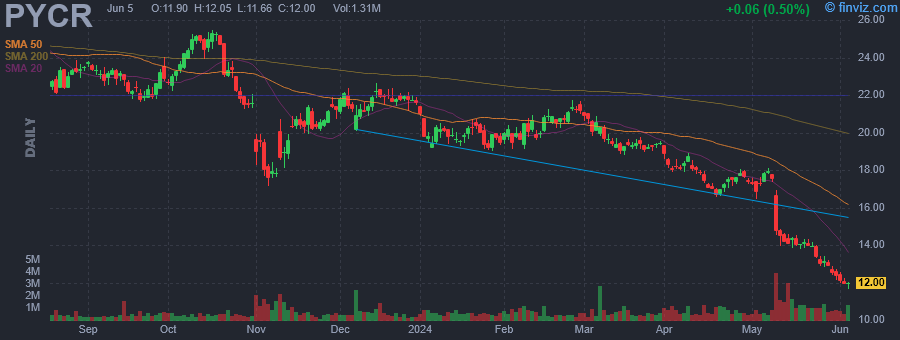
| Short Float | 8.92% | Earnings | May 08/a |
| Analyst Recom | 2.33 | Target Price | 23.38 |
| Avg Volume | 872.97K | 52W Range | 13.92 - 27.50 |
|
|
|
|
Paycor HCM, Inc. operates as a holding company, which engages in the development and provision of a software-as-a-service platform. It offers human capital management solutions for small and medium-sized businesses. Its products include human resources and payroll software, workforce management, benefits administration, talent management, and employee engagement. The company was founded on August 24, 2018, and is headquartered in Cincinnati, OH. |
| Insider Trading |
Relationship |
Date |
Transaction |
Cost |
#Shares |
Value ($) |
#Shares Total |
SEC Form 4 |
| Geene Alice L | See Remarks | Apr 04 '24 | Sale | 18.39 | 1,577 | 28,994 | 107,581 | Apr 05 05:13 PM | | Corr Jonathan | Director | Apr 04 '24 | Sale | 18.30 | 1,508 | 27,595 | 18,480 | Apr 05 05:12 PM | | PRIDE GP, INC. | 10% Owner | Mar 06 '24 | Sale | 20.05 | 8,000,000 | 160,368,000 | 0 | Mar 08 04:26 PM | | Geene Alice L | See Remarks | Jan 19 '24 | Sale | 20.15 | 1,428 | 28,780 | 111,543 | Jan 22 05:46 PM | | Corr Jonathan | Director | Jan 16 '24 | Sale | 19.66 | 1,508 | 29,647 | 19,988 | Jan 16 05:43 PM |
|
|
|
 |
| Market Cap | 19.80M | EPS (ttm) | -2.69 |
| P/E | - | EPS this Y | 33.14% |
| Forward P/E | - | EPS next Y | 12.27% |
| PEG | - | EPS past 5Y | - |
| P/S | 1.26 | EPS next 5Y | - |
| P/B | 0.50 | EPS Q/Q | 43.65% |
| Dividend | - | Sales Q/Q | 10.58% |
| Insider Own | 11.91% | Inst Own | 15.61% |
| Insider Trans | -0.39% | Inst Trans | -24.09% |
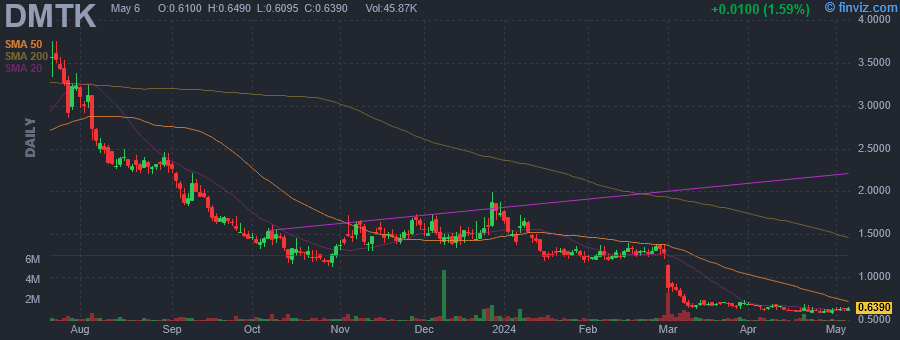
| Short Float | 10.15% | Earnings | May 14/a |
| Analyst Recom | 2.20 | Target Price | 2.28 |
| Avg Volume | 285.74K | 52W Range | 0.57 - 3.90 |
|
|
|
|
DermTech, Inc. engages in the development and sale of products for the diagnosis and treatment of skin diseases. It markets and develops products that facilitate diagnosis and management of various skin conditions, including skin cancer, inflammatory diseases, and aging-related conditions. Its products and services include melanoma test, smart sticker, and telemedicine option for melanoma test. The company was founded in 1995 and is headquartered in San Diego, CA. |
| Insider Trading |
Relationship |
Date |
Transaction |
Cost |
#Shares |
Value ($) |
#Shares Total |
SEC Form 4 |
| Sun Kevin M | Chief Financial Officer | Dec 11 '23 | Sale | 1.45 | 447 | 648 | 277,499 | Dec 11 08:02 PM | | Ibarra Claudia | Chief Operating Officer | Dec 11 '23 | Sale | 1.45 | 331 | 480 | 193,547 | Dec 11 08:02 PM | | Ibarra Claudia | Chief Operating Officer | Dec 08 '23 | Sale | 1.41 | 2,607 | 3,676 | 193,878 | Dec 11 08:02 PM | | Sun Kevin M | Chief Financial Officer | Dec 07 '23 | Sale | 1.53 | 4,979 | 7,618 | 277,946 | Dec 11 08:02 PM | | Ibarra Claudia | Chief Operating Officer | Dec 07 '23 | Sale | 1.53 | 3,911 | 5,984 | 196,485 | Dec 11 08:02 PM |
|
|
| |
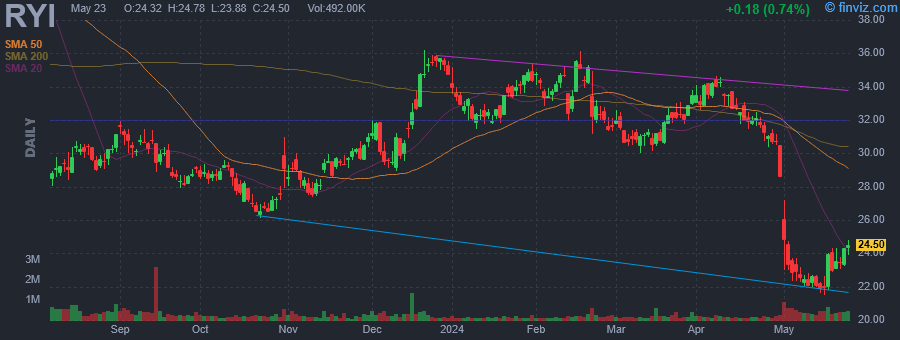 |
| Market Cap | 759.58M | EPS (ttm) | 2.58 |
| P/E | 8.56 | EPS this Y | -90.56% |
| Forward P/E | 10.19 | EPS next Y | 463.64% |
| PEG | 27.62 | EPS past 5Y | 7.80% |
| P/S | 0.15 | EPS next 5Y | 0.31% |
| P/B | 0.85 | EPS Q/Q | -117.59% |
| Dividend | 3.39% | Sales Q/Q | -11.87% |
| Insider Own | 15.27% | Inst Own | 84.15% |
| Insider Trans | -0.32% | Inst Trans | -1.07% |
| Short Float | 2.52% | Earnings | Apr 30/a |
| Analyst Recom | 3.00 | Target Price | 28.00 |
| Avg Volume | 282.71K | 52W Range | 21.65 - 44.70 |
|
|
|
|
Ryerson Holding Corp. engages in the processing and distribution of industrial metals. It processes and distributes products in stainless steel, aluminum carbon steel and alloy steels, and a limited line of nickel and red metals in various shapes and forms. The firm serves end-markets including oil and gas, industrial equipment, transportation equipment, heavy equipment, and electrical machinery. It also offers value-added processing and fabrication services such as sawing, slitting, blanking, cutting to length, leveling, flame cutting, laser cutting, edge trimming, edge rolling, roll forming, tube manufacturing, polishing, shearing, forming, stamping, punching, rolling shell plate to radius. The company was founded in 1842 and is headquartered in Chicago, IL. |
| Insider Trading |
Relationship |
Date |
Transaction |
Cost |
#Shares |
Value ($) |
#Shares Total |
SEC Form 4 |
| Lehner Edward J. | President & CEO | May 06 '24 | Option Exercise | 16.50 | 1,250 | 20,625 | 603,228 | May 06 06:51 PM | | Lehner Edward J. | President & CEO | May 03 '24 | Option Exercise | 16.50 | 2,500 | 41,250 | 601,978 | May 06 06:51 PM | | Burbach Michael | Chief Operating Officer | May 02 '24 | Buy | 23.75 | 4,000 | 95,000 | 226,263 | May 03 04:44 PM | | Sundarrajan Alagu | Chief Information Officer | Mar 31 '24 | Option Exercise | 0.00 | 15,479 | 0 | 25,963 | Apr 02 05:11 PM | | Claussen James J | Executive Vice President & CFO | Mar 31 '24 | Option Exercise | 0.00 | 35,463 | 0 | 81,850 | Apr 02 05:14 PM |
|
|
|
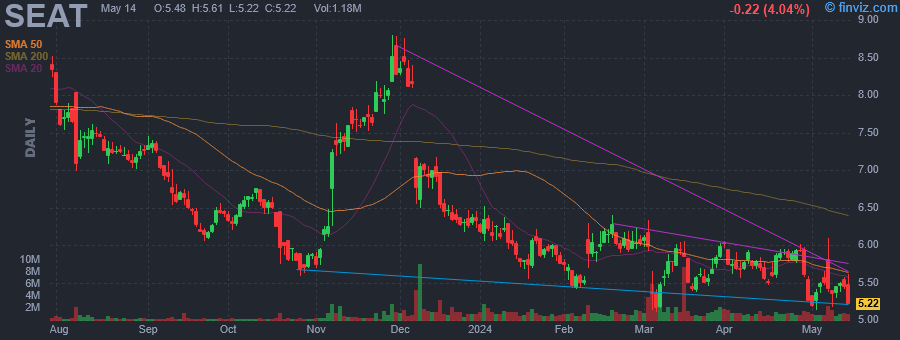 |
| Market Cap | 690.33M | EPS (ttm) | 0.10 |
| P/E | 50.93 | EPS this Y | -43.23% |
| Forward P/E | 13.99 | EPS next Y | 28.01% |
| PEG | 7.67 | EPS past 5Y | - |
| P/S | 0.93 | EPS next 5Y | 6.64% |
| P/B | 4.98 | EPS Q/Q | -28.94% |
| Dividend | - | Sales Q/Q | 18.50% |
| Insider Own | 45.19% | Inst Own | 45.59% |
| Insider Trans | -28.19% | Inst Trans | -6.16% |
| Short Float | 13.13% | Earnings | May 07/b |
| Analyst Recom | 1.69 | Target Price | 9.38 |
| Avg Volume | 1.62M | 52W Range | 5.11 - 9.70 |
|
|
|
|
Vivid Seats, Inc. operates as an online ticket marketplace, which engages in the provision of different selections of events and tickets in North America. It operates through the following segments: Marketplace and Resale. The Marketplace segment acts as an intermediary between event ticket buyers and ticket sellers. The Resale segment acquires tickets to resell on secondary ticket marketplaces, including its own. Its partners include Caesars Entertainment, RollingStone, Marriott Bonvoy, Capital One, American Airlines and others. The company was founded in 2001 and is headquartered in Chicago, IL. |
| Insider Trading |
Relationship |
Date |
Transaction |
Cost |
#Shares |
Value ($) |
#Shares Total |
SEC Form 4 |
| Epstein Emily T | General Counsel | May 13 '24 | Sale | 5.55 | 1,381 | 7,665 | 34,243 | May 13 07:01 PM | | Bakal Riva | Chief Strategy Officer | Apr 22 '24 | Sale | 5.90 | 1,136 | 6,702 | 97,670 | Apr 23 05:59 PM | | Pickus Edward | Chief Accounting Officer | Apr 22 '24 | Sale | 5.90 | 537 | 3,168 | 35,434 | Apr 23 05:58 PM | | Wagner Jonathan Miles | Chief Technology Officer | Mar 12 '24 | Sale | 5.71 | 29,588 | 168,947 | 139,925 | Mar 13 04:26 PM | | Bakal Riva | Chief Strategy Officer | Mar 12 '24 | Sale | 5.71 | 2,051 | 11,711 | 94,955 | Mar 13 04:20 PM |
|
|
|
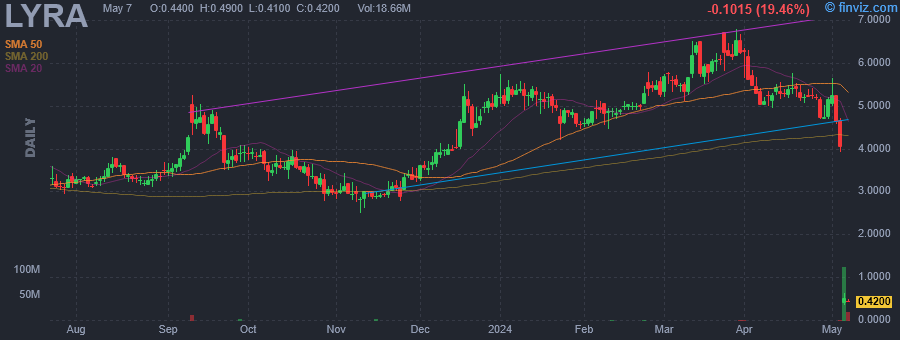 |
| Market Cap | 22.56M | EPS (ttm) | -1.25 |
| P/E | - | EPS this Y | 4.10% |
| Forward P/E | - | EPS next Y | 23.31% |
| PEG | - | EPS past 5Y | -21.63% |
| P/S | 13.43 | EPS next 5Y | -1.60% |
| P/B | 0.29 | EPS Q/Q | 20.51% |
| Dividend | - | Sales Q/Q | 29.76% |
| Insider Own | 23.67% | Inst Own | 61.03% |
| Insider Trans | 0.00% | Inst Trans | -0.18% |
| Short Float | 0.89% | Earnings | Apr 30/a |
| Analyst Recom | 2.83 | Target Price | 3.96 |
| Avg Volume | 2.79M | 52W Range | 0.35 - 6.79 |
|
|
|
|
Lyra Therapeutics, Inc. is a clinical-stage therapeutics company. It develops novel integrated drug and delivery solutions for the localized treatment of patients with ear, nose and throat, or ENT, diseases. The firms proprietary XTreo deliver medicines. The company was founded by Carmichael S. Roberts, George M. Whitesides, and Robert S. Langer in November 2005 and is headquartered in Watertown, MA. |
| Insider Trading |
Relationship |
Date |
Transaction |
Cost |
#Shares |
Value ($) |
#Shares Total |
SEC Form 4 |
| Waksal Harlan | Executive Chair | Nov 10 '23 | Buy | 2.96 | 25,000 | 74,095 | 261,966 | Nov 13 05:29 PM | | PERCEPTIVE ADVISORS LLC | Director | May 31 '23 | Buy | 2.49 | 3,610,832 | 8,999,999 | 11,469,117 | Jun 02 04:11 PM | | ANDERSON EDWARD T | Director | May 31 '23 | Buy | 2.43 | 1,805,416 | 4,387,161 | 2,521,745 | Jun 02 04:11 PM | | NBVM GP, LLC | 10% Owner | May 31 '23 | Buy | 2.43 | 1,805,416 | 4,387,161 | 2,521,745 | Jun 02 04:15 PM |
|
|
|
