


Finviz charts now feature Analyst Ratings markers showing the latest Wall Street upgrades and downgrades. This new feature adds another layer of clarity, context, and depth to your analysis: see analyst actions alongside price in real-time.
Here’s what members can now view on every Finviz stock chart (See AAPL):
- Analyst Ratings (New)
- Earnings reports data with beat & miss
- Dividends data
- Hundreds of indicators and overlays
- And much more
No additional tabs needed. No cross-referencing dates. Just Wall Street ratings shown on every chart aligned perfectly with each candle for seamless before and after research.
How to Chart Analyst Ratings
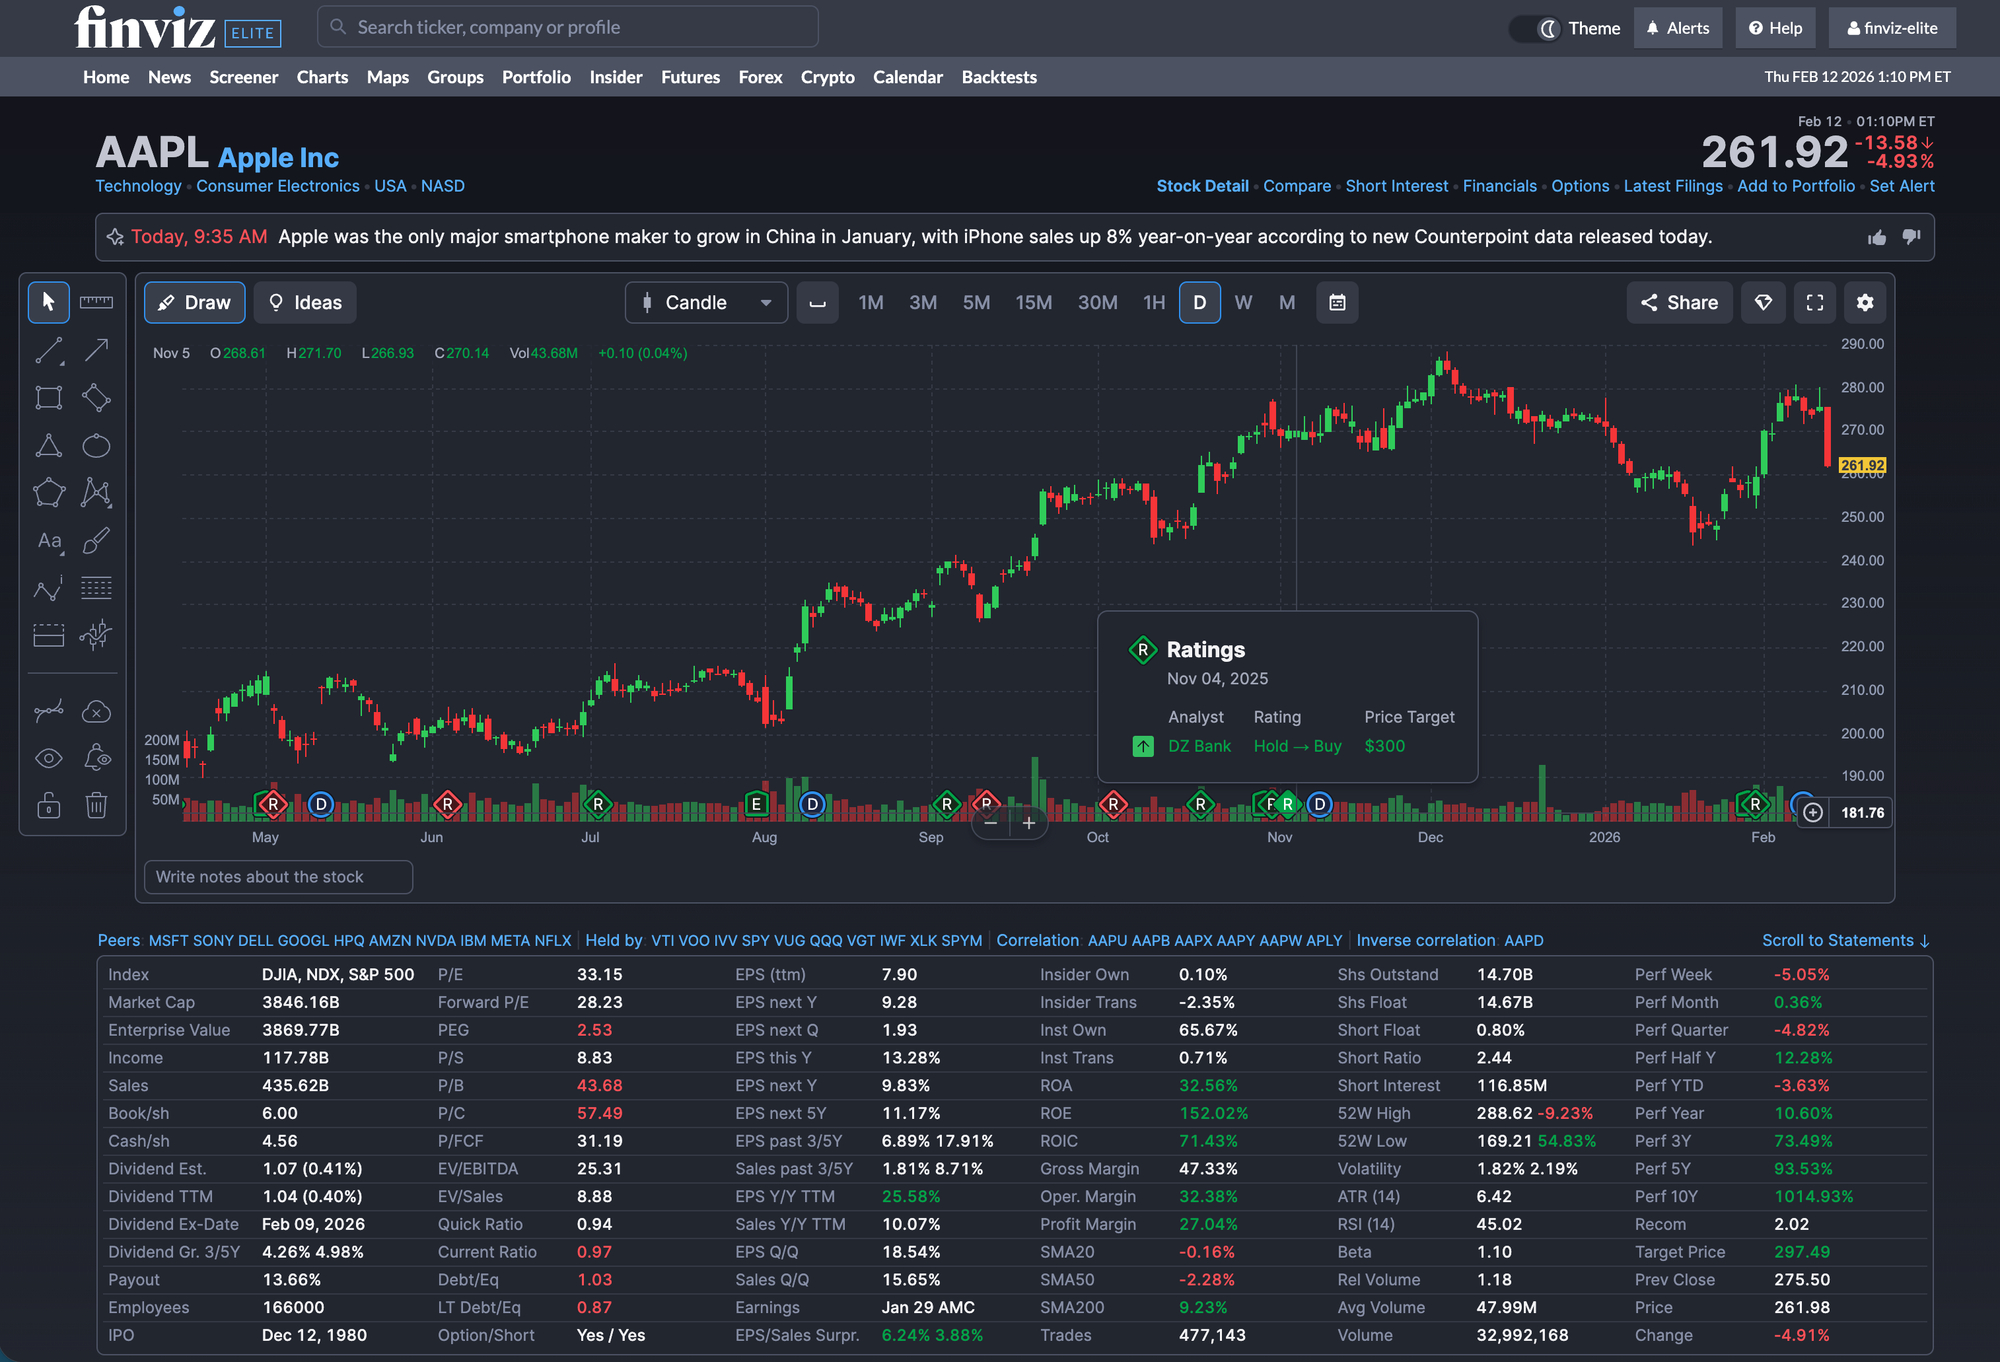
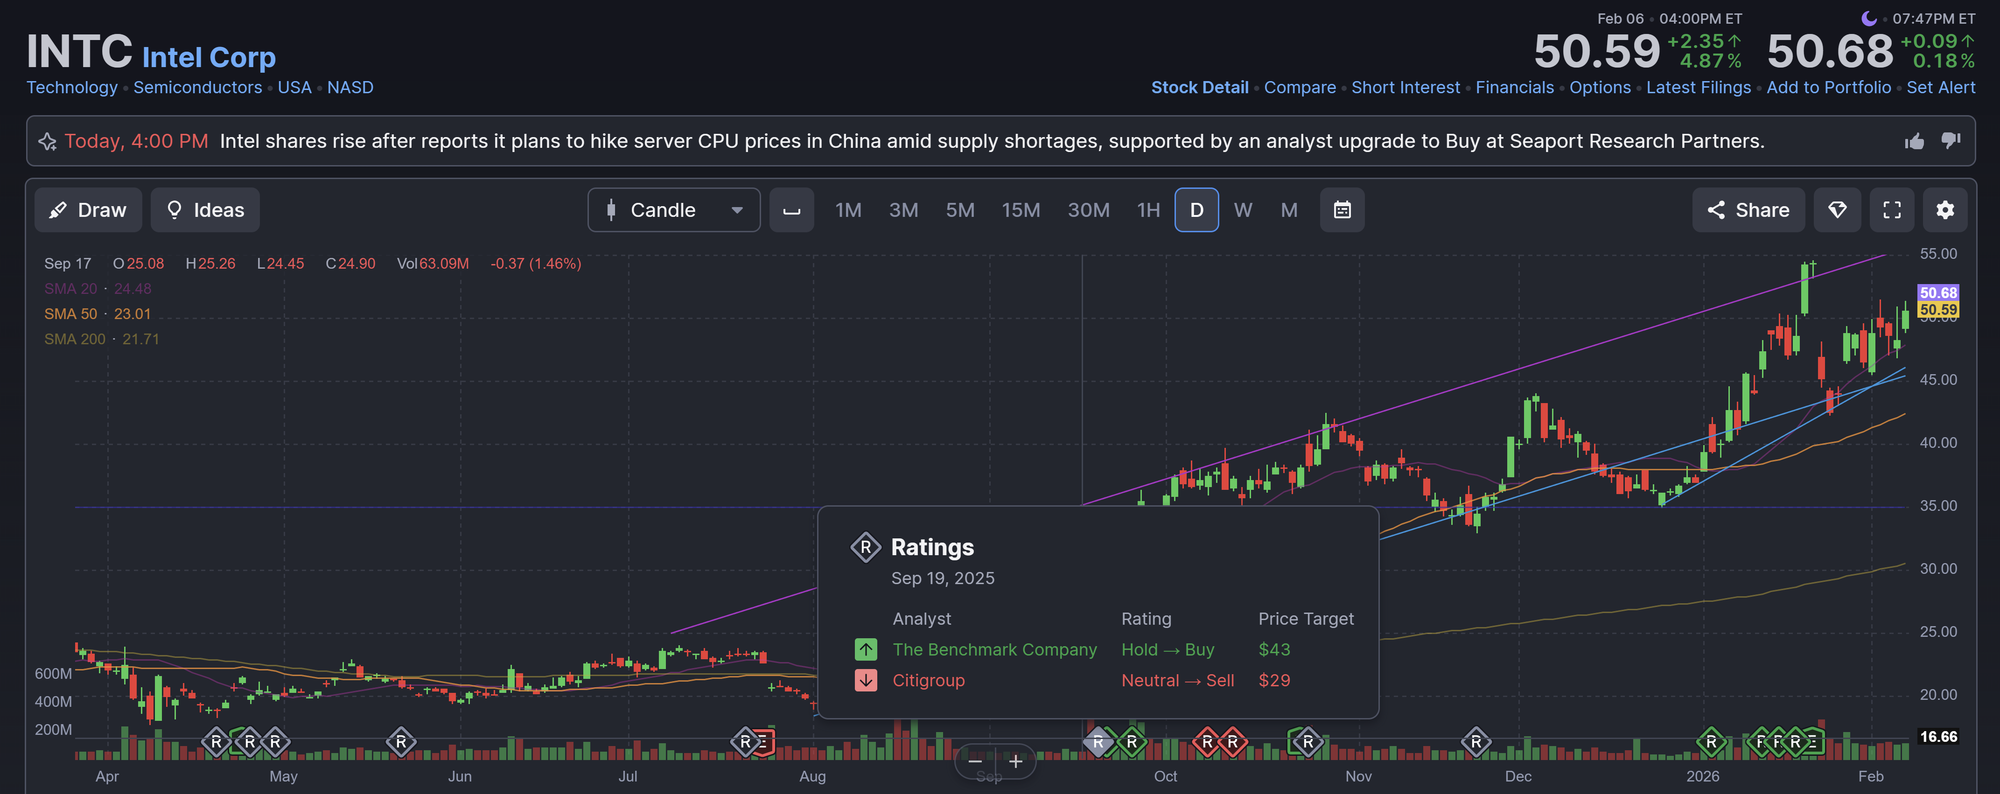
Every Wall Street stock rating now appears as a visual marker on the chart. Click a Rating marker and you’ll see:
- Analyst name
- Rating change (for example, Hold → Buy)
- Price target
This data is neatly anchored to the precise candle when the update occurred. For example, check out this chart of Apple on the Finviz AAPL page:
Or this chart of Intel on the Finviz INTC page:
Analyst Ratings, Earnings, and Price
Upgrades and downgrades don’t happen in isolation. Wall Street always has a reason. These upgrades and downgrades play out within the broader price structure both from technicals and fundamentals driven by earnings. An upgrade near resistance can signal something different than after a breakout earnings report.
Here's what you can visually connect:
- Earnings gaps
- Post-report trend continuation or reversal
- Analyst reactions that follow
Was the move already priced in? Did analysts revise targets before or after the earnings report? Now you can answer these questions.
The Bigger Picture
Finviz charts continue to evolve beyond price visualizations now bringing technical structure, fundamental context, and key catalysts into a single dynamic view.
We're excited to see how you utilize this new Analyst Ratings tool. Thanks for reading!
Finviz Team