


Finding great stocks is one thing. Choosing between them is where the best investors outperform their peers, especially against those who do not compare stocks and ETFs in the correct way.
Today, we're announcing our new Compare feature for stocks and ETFs. This new tool turns stock comparisons into a beautiful process that's fast, visual, and incredibly clear. It's unlike anything else in the market today, and it's only for you, the Finviz Elite member.
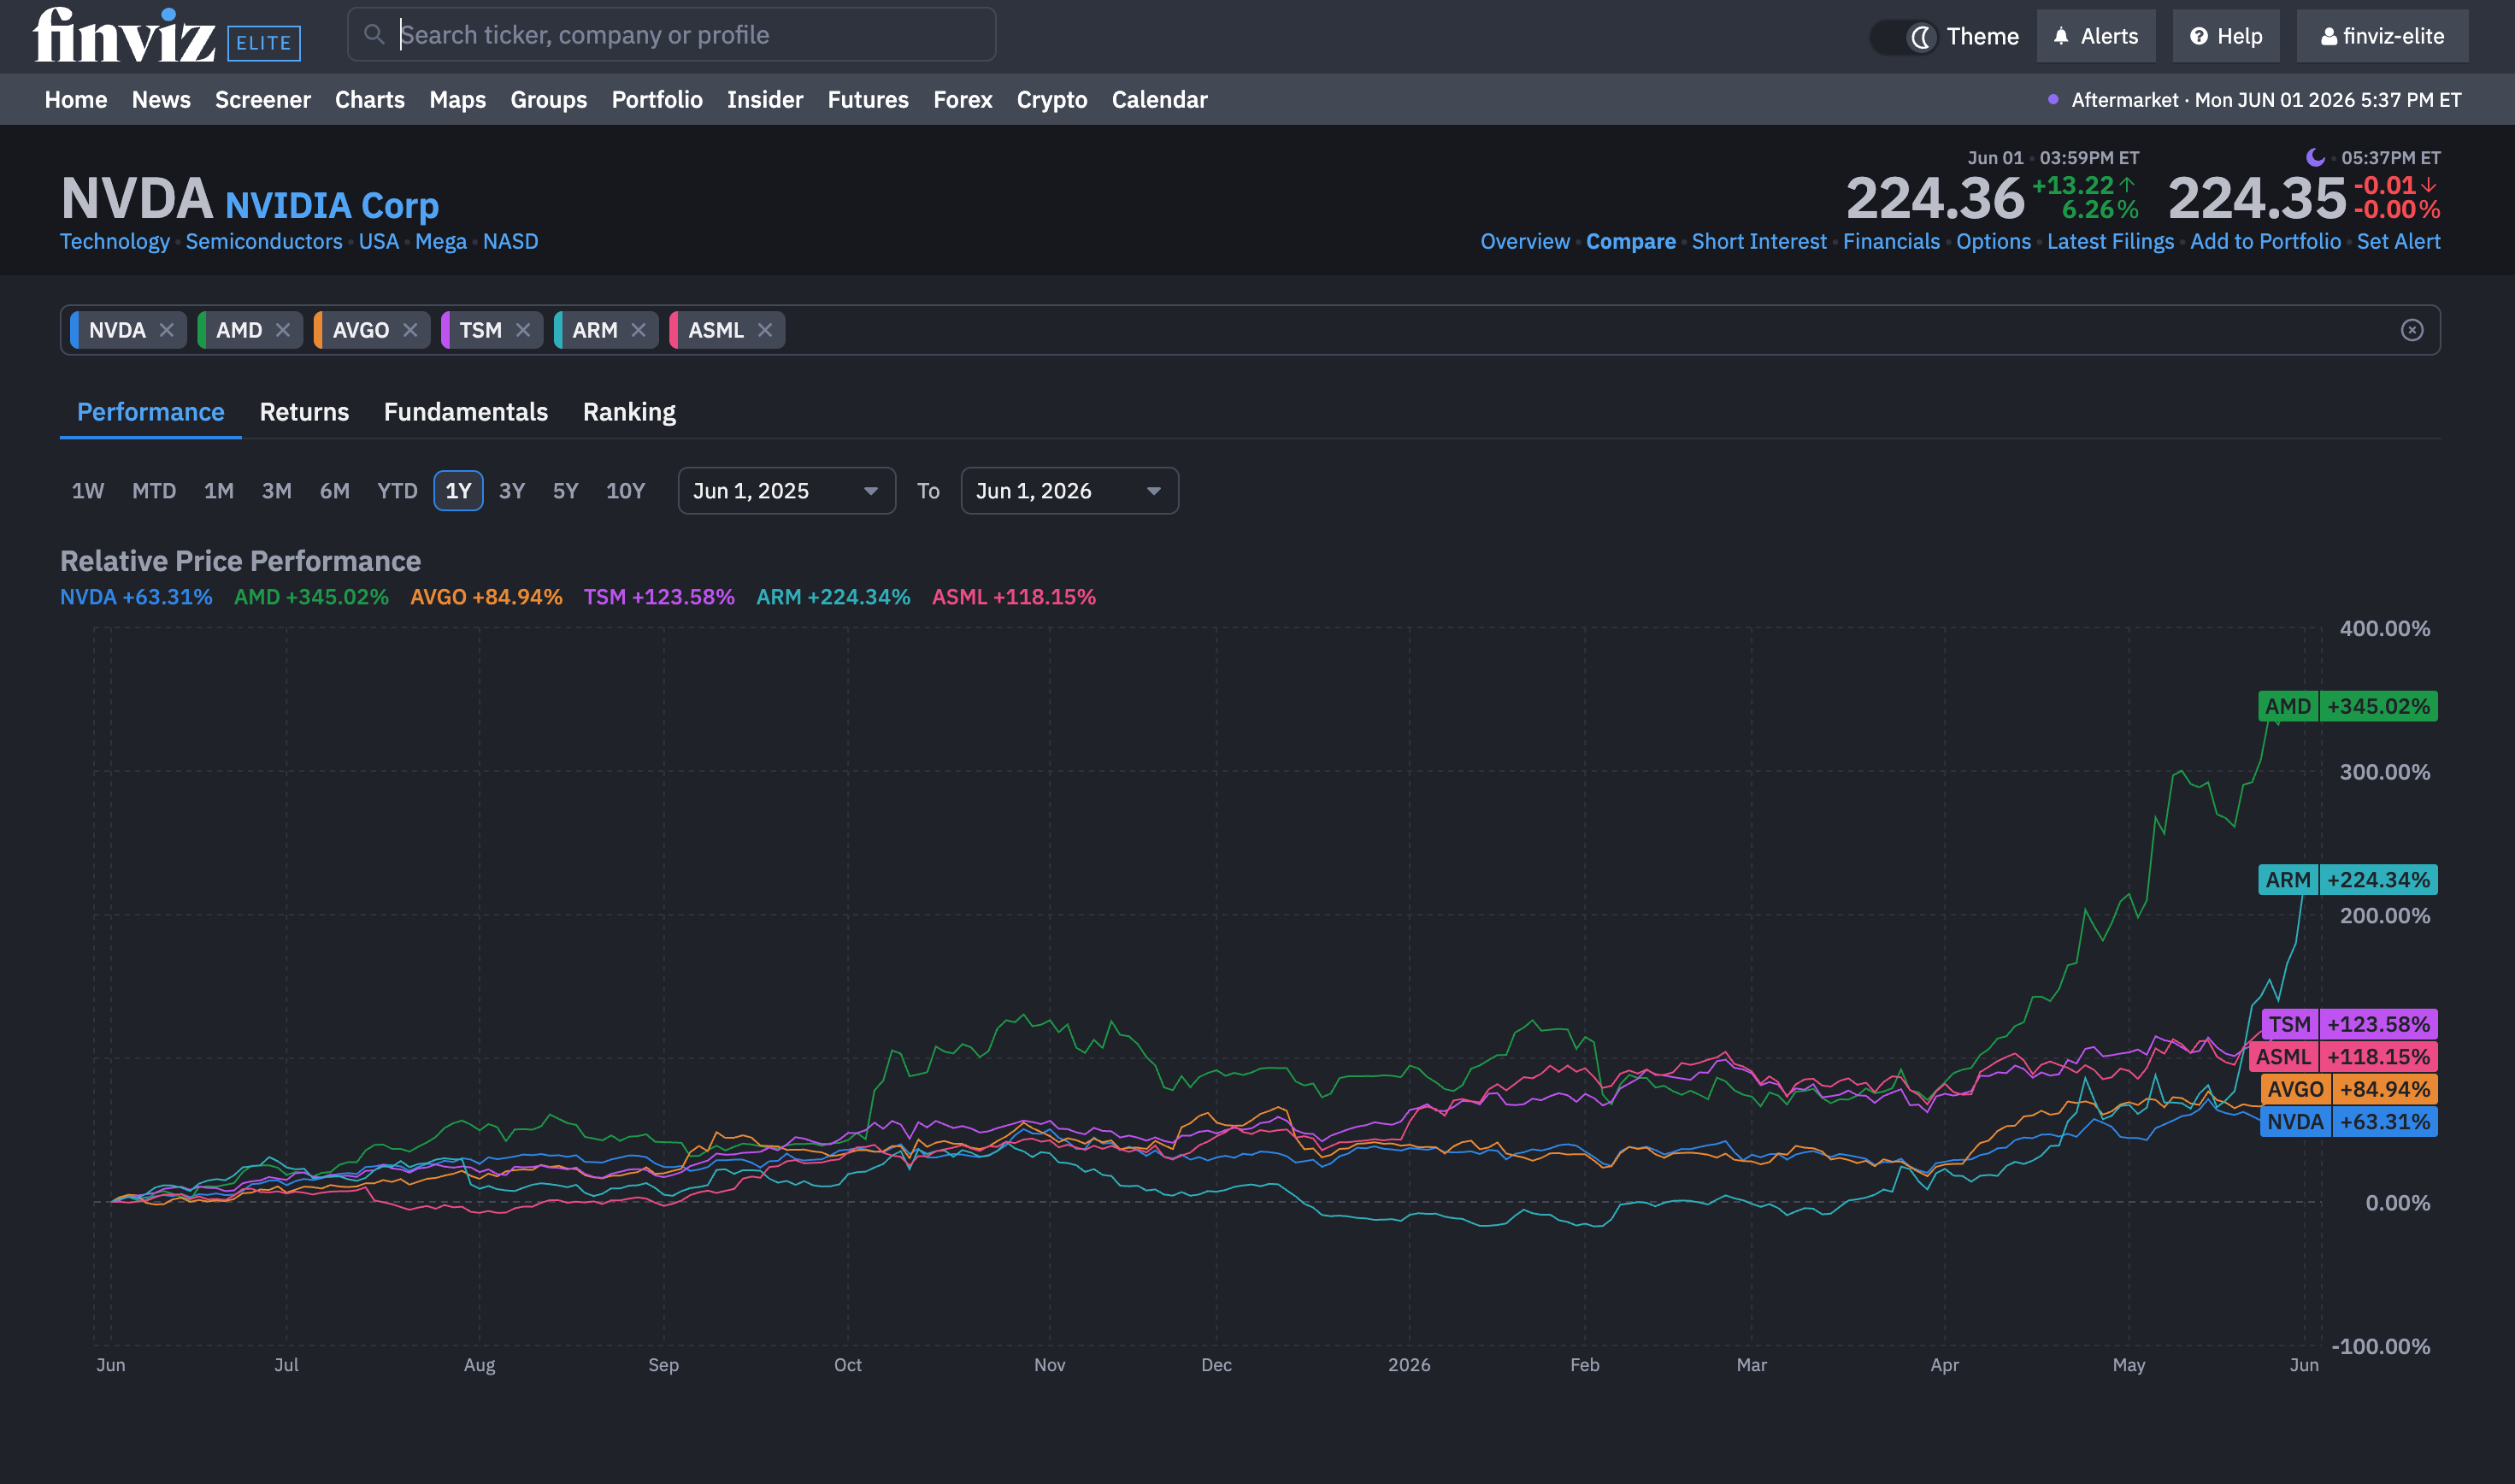
Let's start with the basics. First, head over the Compare tool, which you can find on any stock or ETF page i.e. NVIDIA Compare and enter in the stocks you want to compare in real-time – like this:
Based on your feedback, we've upgraded how you interact with each comparison adding all of the following features and capabilities:
- Comparison charts now fully support zoom and pan, allowing you to seamlessly investigate specific price action zones.
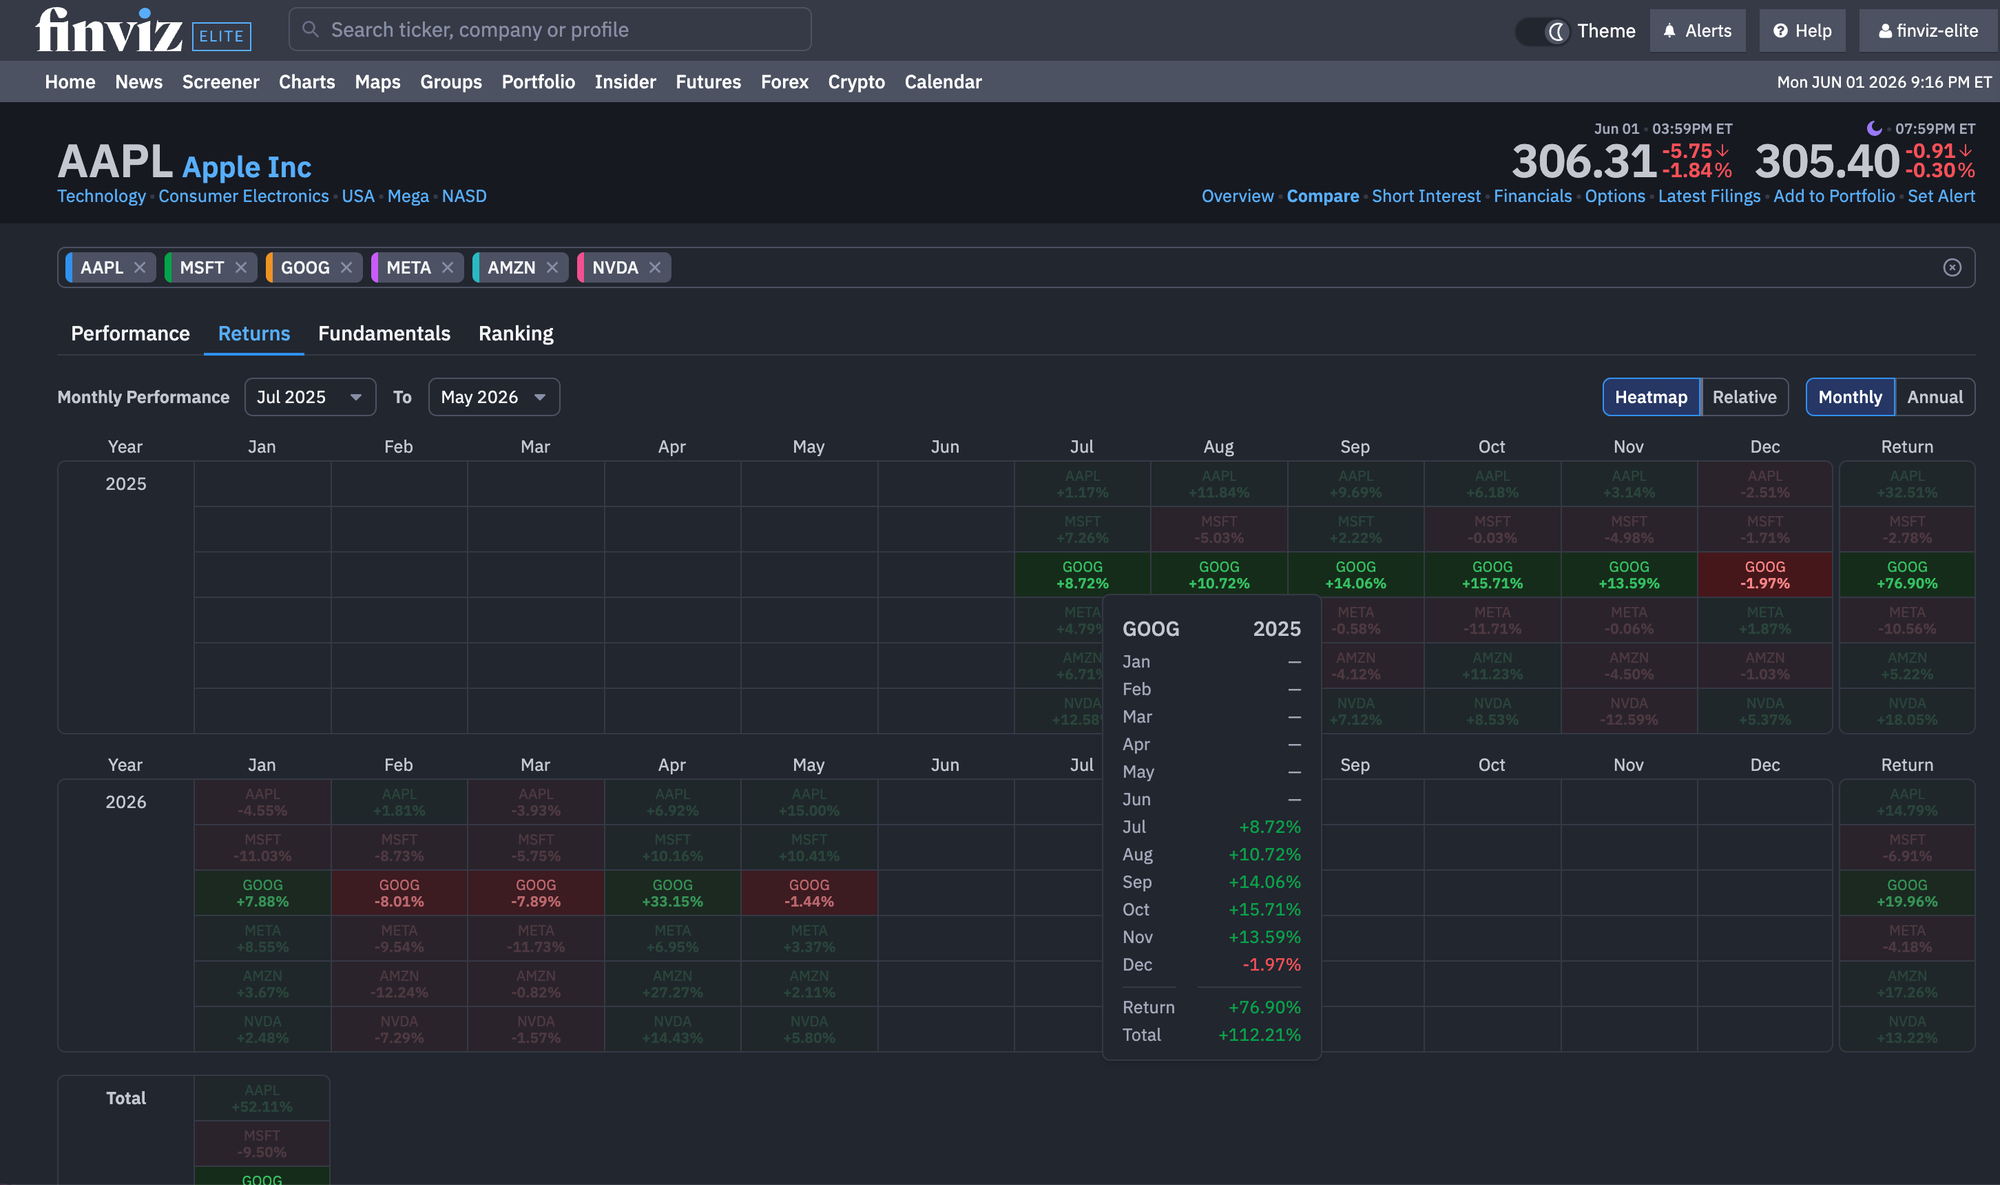
- The Returns tab includes several new enhancements, including a monthly returns Heatmap with mouse-hover highlighting that allows users to quickly identify each stock being compared and view its corresponding returns.
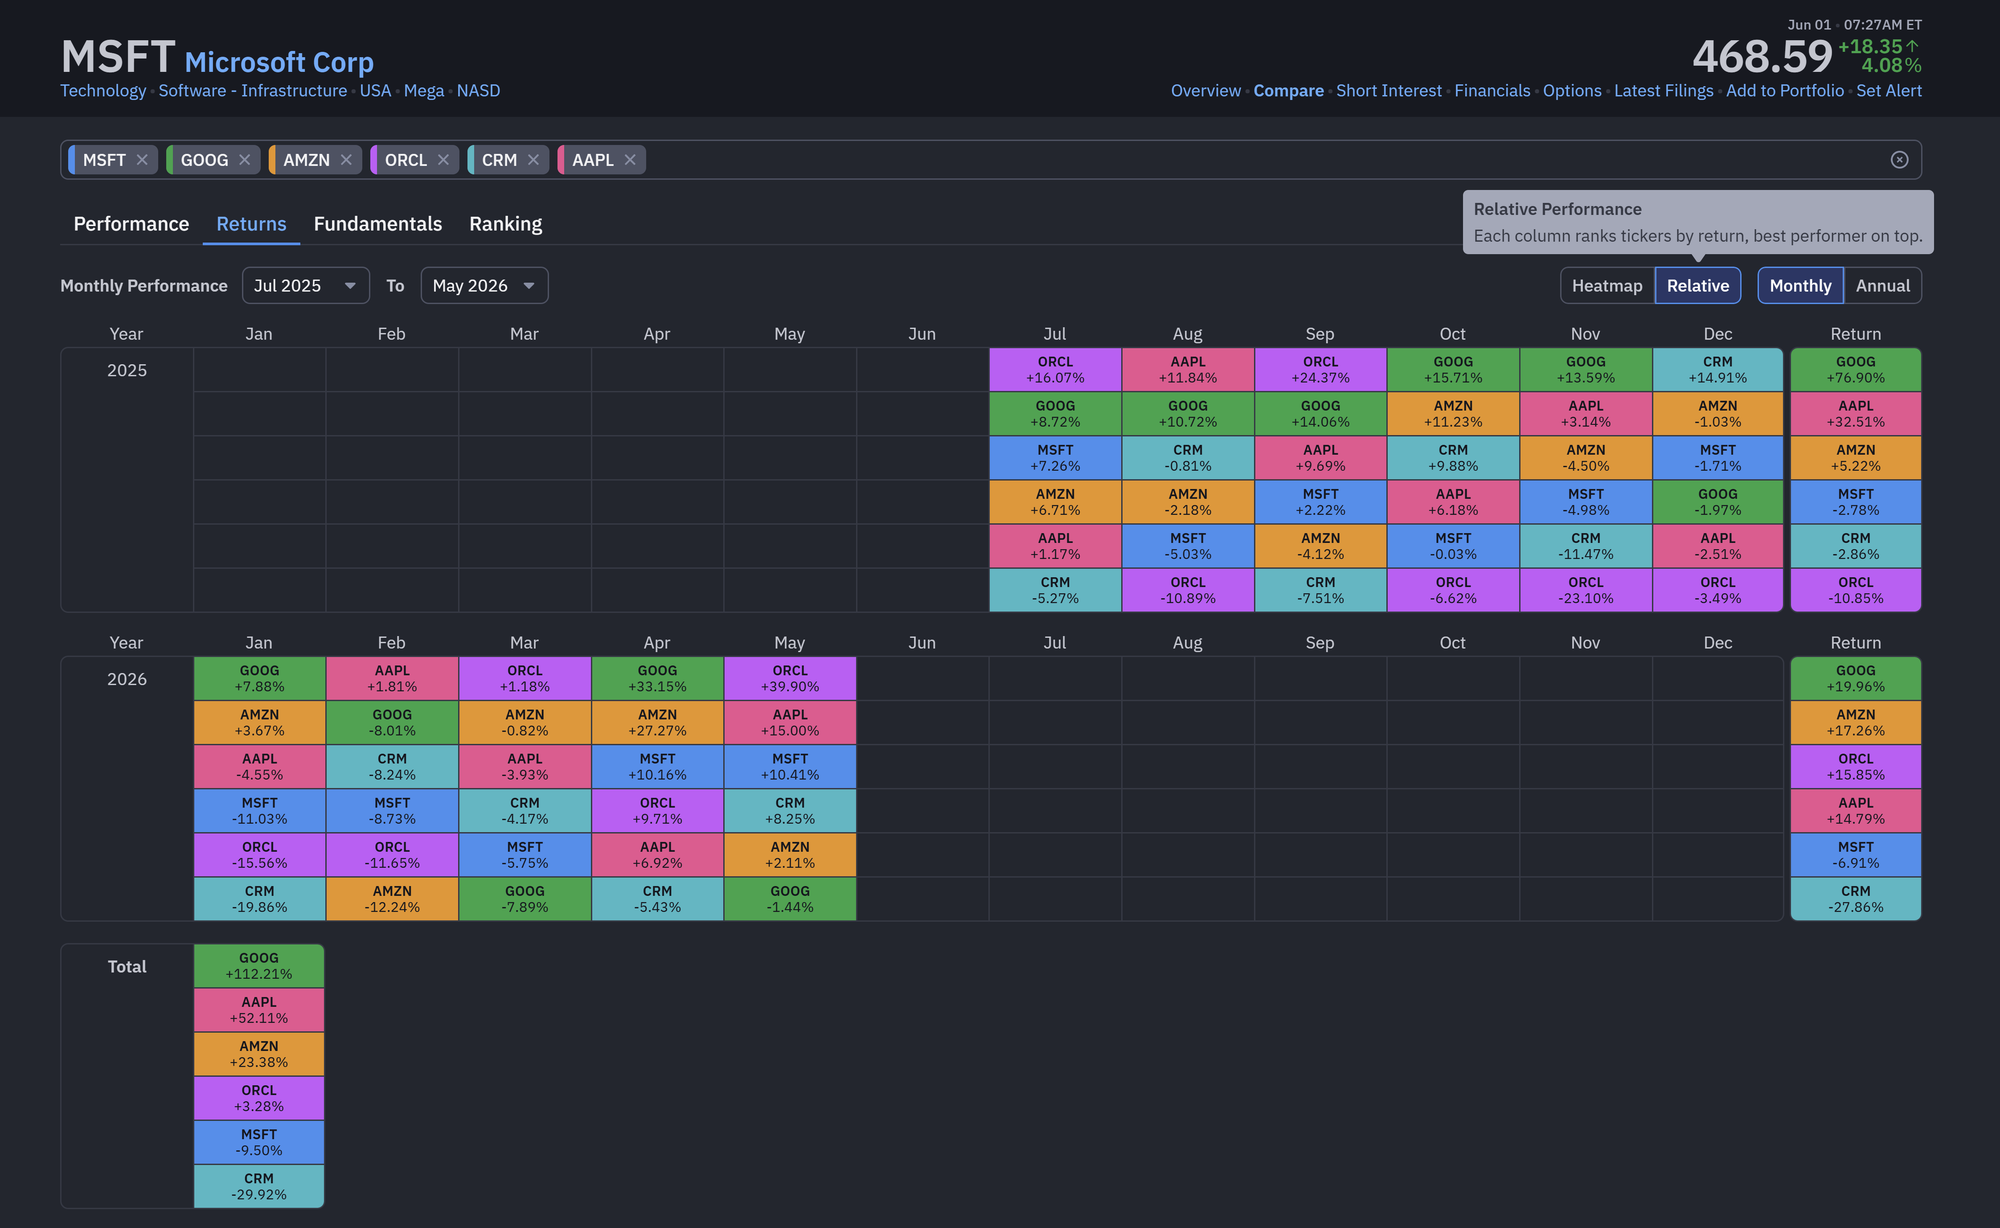
- The Returns tab also now includes Relative Performance visuals, making it effortless to identify which stocks led the comparison by month or year. It also comes equipped with a similar mouse-hover feature in the Heatmap tab.
- Use our restored month-level date selector to dial in exact periods (e.g., March 2020 to April 2025). Your custom date ranges sync perfectly when switching between Monthly and Annual views.
Check out the Relative Performance view:
And here's Heatmap view with our mouse hover enabled:
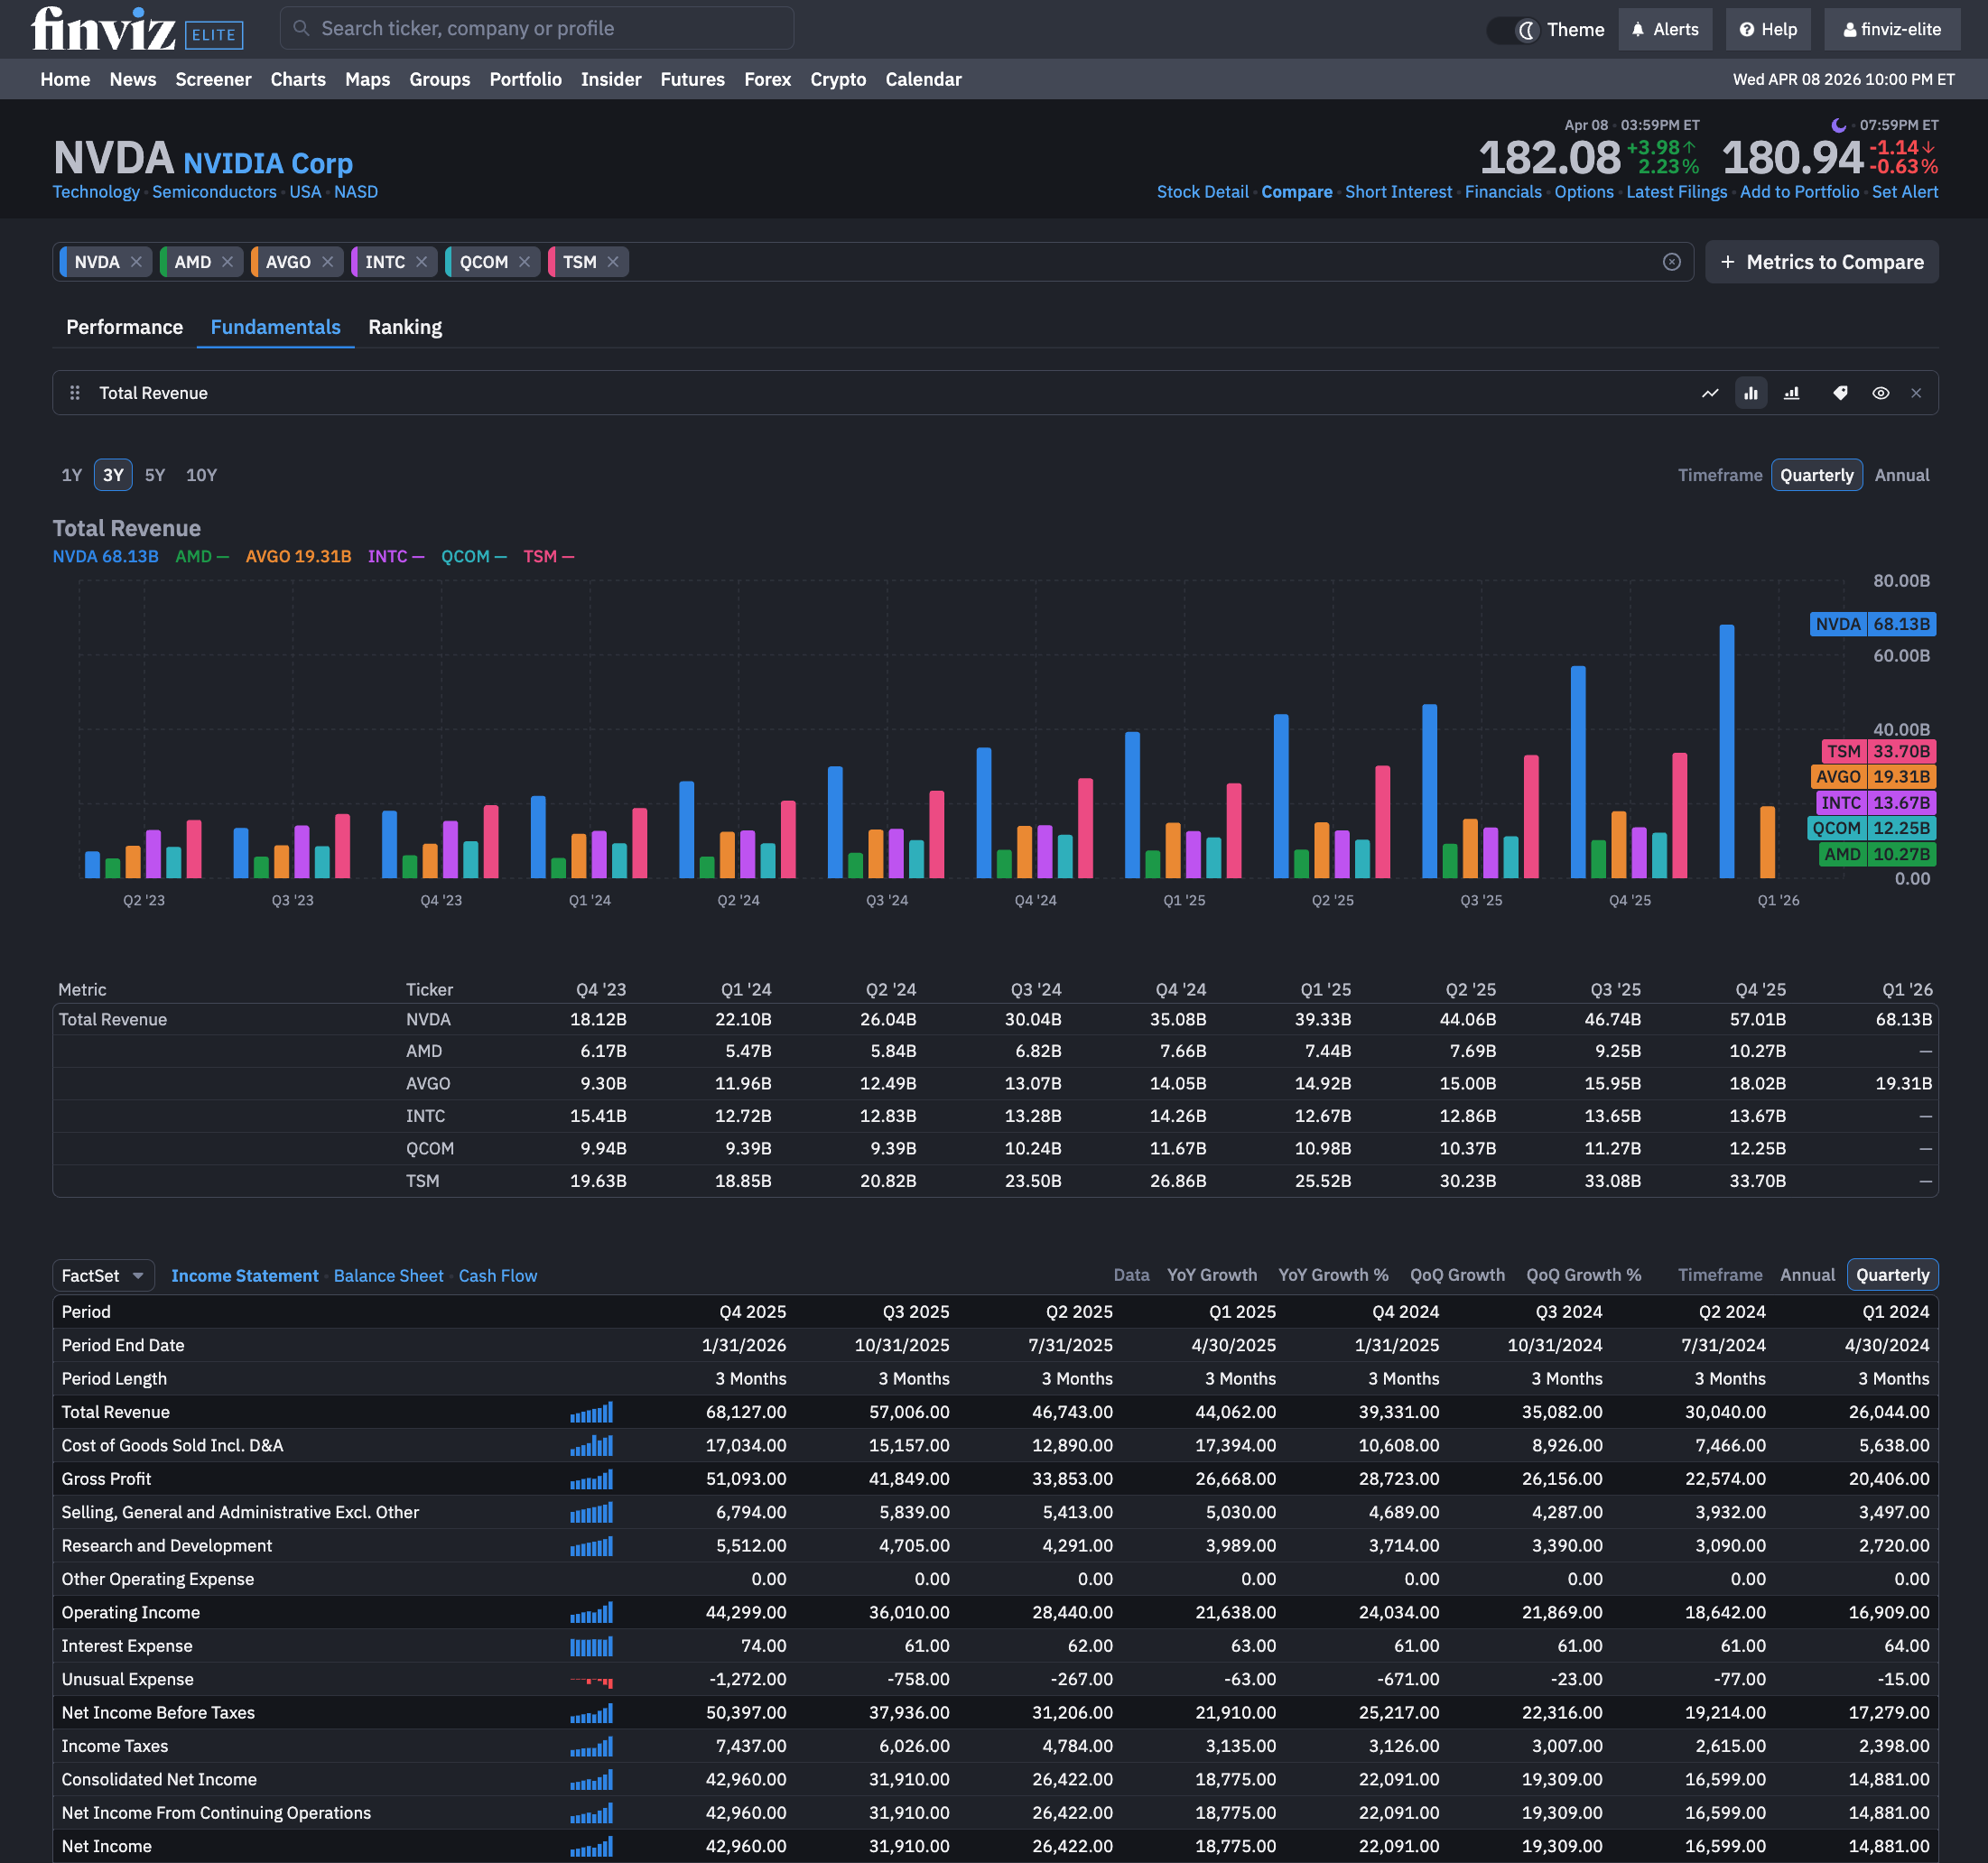
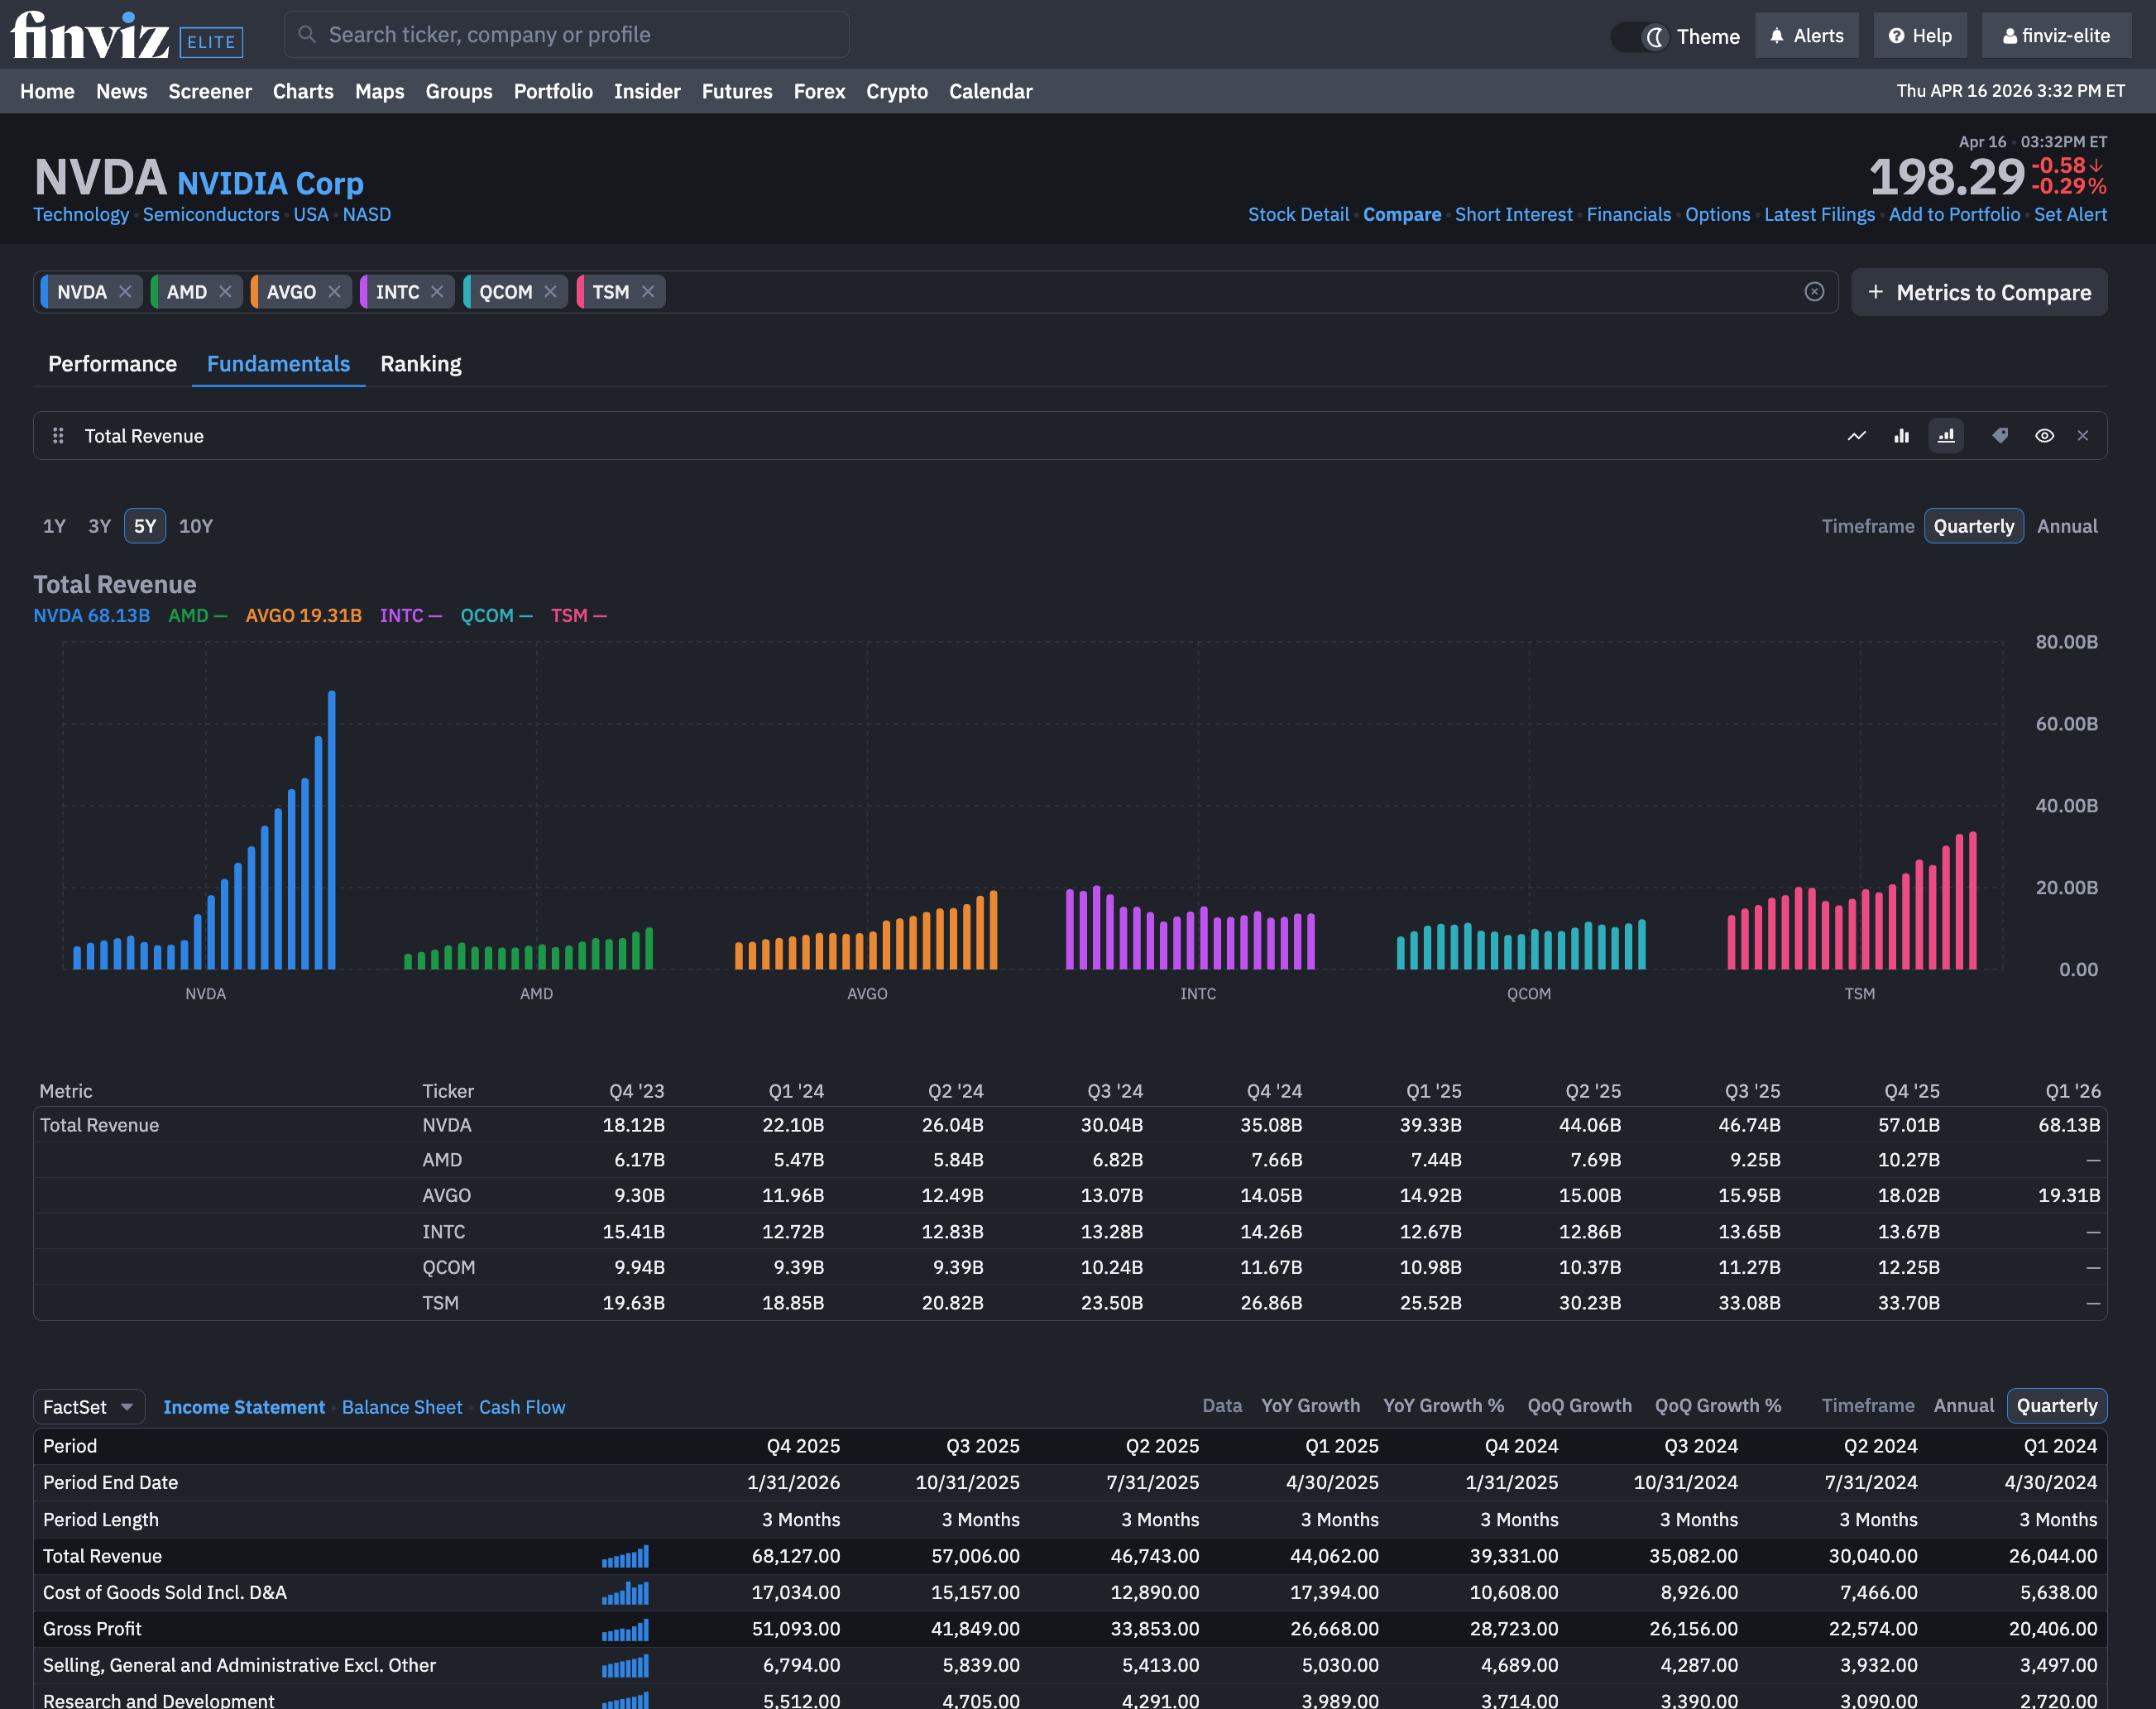
From here, the updates to our Compare tool only get better. Instead of jumping between pages, trying to remember revenue figures or building spreadsheets manually, every fundamental data point is organized into the Compare tool. To get started, just click the Fundamentals tab on the Compare tool:
With our Compare capabilities for fundamentals, any investor can now see the following:
- Fundamental metrics like total revenue, EPS, and more all as a bar chart
- Quick customizations to compare any fundamental metrics including more advanced tools like Free Cash Flow, Gross Profit, and other items on the Income Statement or Balance Sheet
- The ability to Compare fundamental metrics across various stocks in terms of yearly or quarterly performance
As a bonus, when comparing Fundamentals, you can pick the chart view you want including a new feature we call Stacked, which stacks the fundamental bars by each stock rather than a comparison for each year or quarter:
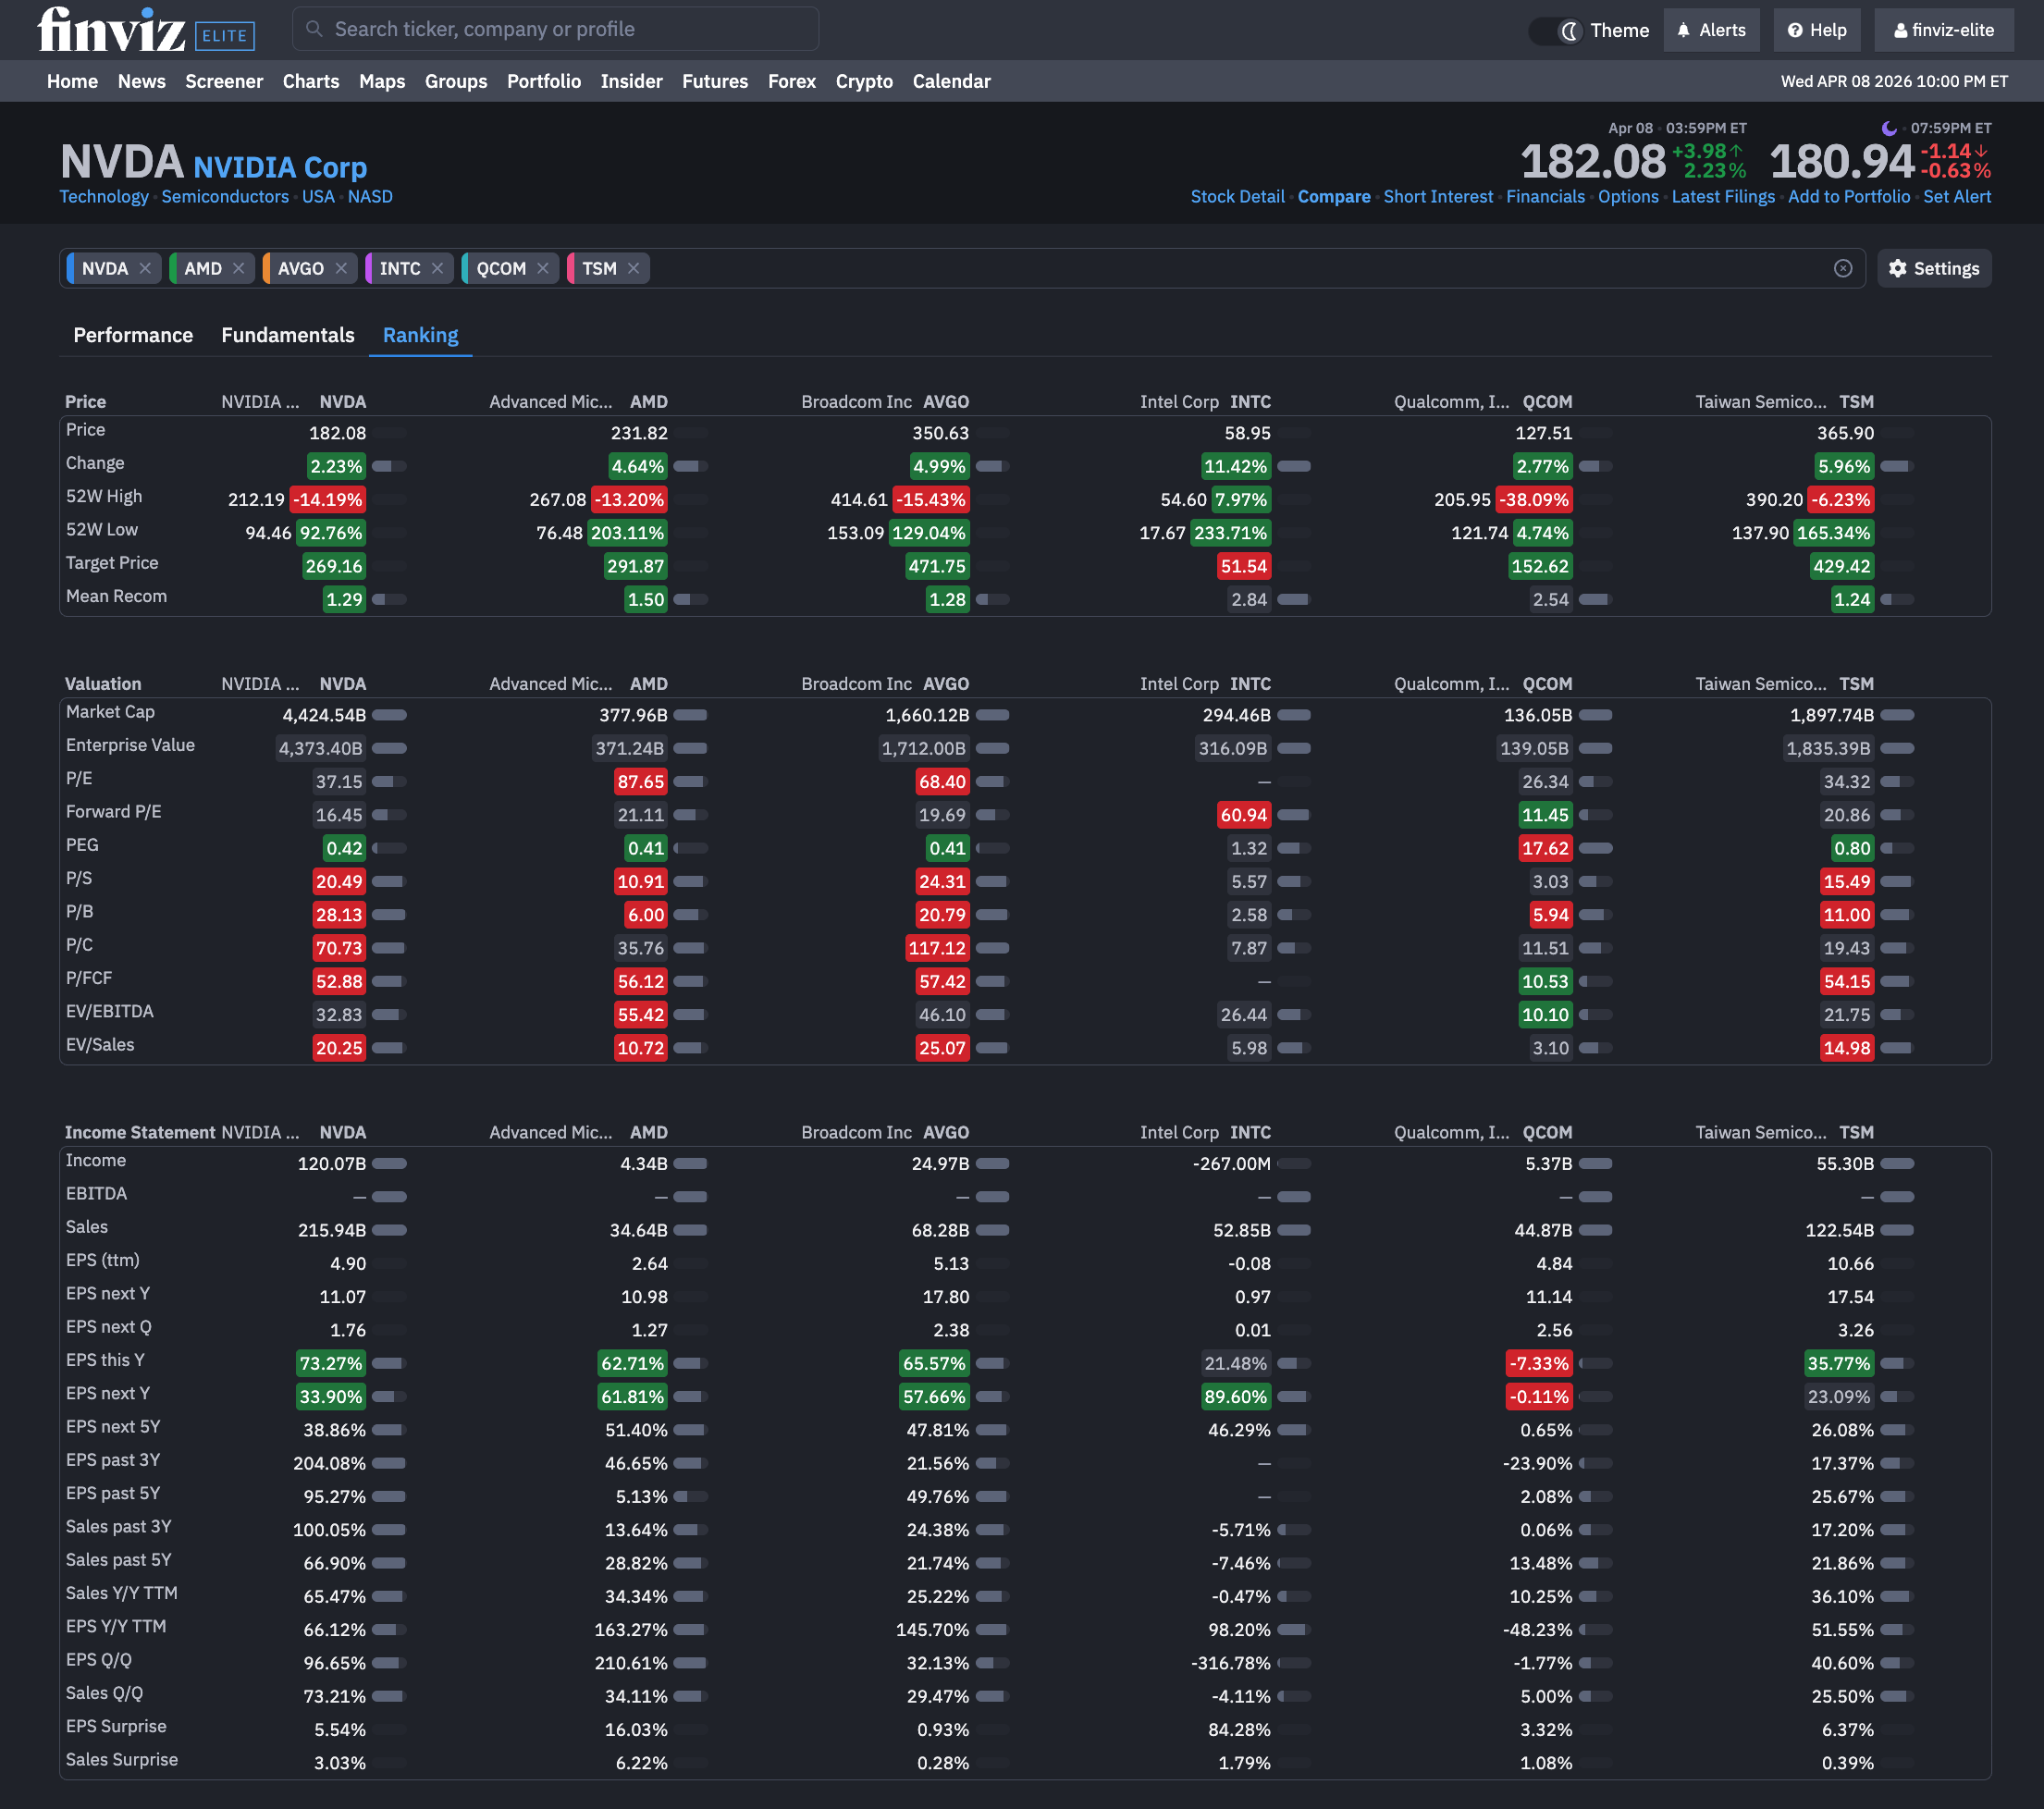
We've also added an advanced Ranking feature that separates our Compare tool from all others. The Ranking features shows how each stock in your comparison ranks for various metrics across price action and fundamentals. This allows for a holistic view:
Great investors don’t just find ideas. They compare them, refine them, and select the best.
Compare helps you do exactly that.
Finviz Team