|
|
|

|
|||||
|
|
|
Signet Jewelers Limited SIG posted impressive second-quarter fiscal 2026 results, wherein the top and bottom lines beat the Zacks Consensus Estimate. Additionally, both revenues and earnings increased year over year. Same-store sales increased 2% from the year-ago period. Driven by the fiscal second-quarter results, Signet has raised its fiscal 2026 outlook.
SIG reported adjusted earnings of $1.61 per share, surpassing the Zacks Consensus Estimate of $1.21. Also, the bottom line increased 28.8% from adjusted earnings of $1.25 in the year-ago period.
This jewelry retailer generated total sales of $1,535.1 million, beating the consensus estimate of $1,498 million. Also, the top line increased 3% year over year. The metric increased 2.6% at constant currency. Merchandise average unit retail (“AUR”) rose approximately 9% year over year, driven by a 4% increase in Bridal and a 12% increase in Fashion.

Signet Jewelers Limited price-consensus-eps-surprise-chart | Signet Jewelers Limited Quote
The gross profit in the fiscal first quarter amounted to $591.9 million, up 4.5% from $566.3 million in the year-ago quarter. The gross margin increased 60 basis points (bps) year over year to 38.6% in the quarter under review, primarily driven by gross merchandise margin expansion and leverage on fixed costs.
Selling, general and administrative (SG&A) expenses were $505.3 million, up 1.4% from $498.4 million in the prior-year quarter. Meanwhile, SG&A expenses, as a percentage of sales, were 32.9%, reflecting a 50-bps reduction year over year.
SIG reported adjusted operating income of $85.4 million, up 24.5% from $68.6 million in the year-ago quarter. The adjusted operating margin increased 100 bps to 5.6%.
Sales in the North American segment increased 2.1% year over year to $1.43 billion, which beat the Zacks Consensus Estimate of $1.40 billion. Same-store sales increased 2% year over year.
Sales in the International segment increased 6.1% year over year to $91.8 million, surpassing the consensus estimate of $85 million. Same-store sales increased 0.8% year over year. Sales increased 0.4% on a constant-currency basis.
As of Aug. 2, 2025, the North American segment had 2,364 stores, a decrease from 2,379 in February 2025 due to eight openings and 23 closures. The International segment had 259 stores, down from 263 after four closures and no openings. Overall, Signet had 2,623 stores, down from 2,642, following eight openings and 27 closures.
SIG ended the fiscal second quarter with cash and cash equivalents of $281.4 million and inventories of $1.99 billion. Total shareholders’ equity was $1.73 billion at the end of the fiscal second quarter.
As of Aug.2, 2025, net cash used was $89 million in operating activities.
In the fiscal second quarter, Signet repurchased approximately 446 thousand common shares for $32 million. During the past six months, the company repurchased approximately 2.5 million shares for $150 million. The company has approximately $570 million remaining under the current share repurchase authorization.
For the third quarter of fiscal 2026, Signet expects total sales to be in the range of $1.34-$1.38 billion. Same-store sales are estimated to be between a decline of 1.25% and an increase of 1.25% year over year.
Adjusted operating income is anticipated to be between $3 million and $17 million, while adjusted EBITDA is expected in the range of $49-$63 million.
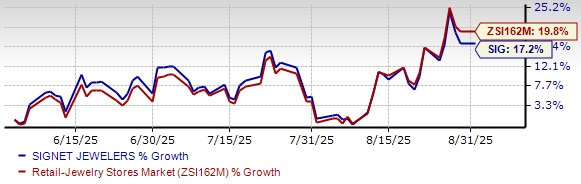
SIG Stock Past Three-Month Performance
Signet has updated its fiscal 2026 guidance. Total sales are now expected in the range of $6.67-$6.82 billion compared with the previous band of $6.57-$6.80 billion. Same-store sales are estimated between a decline of 0.75% and an increase of 1.75% compared with the prior range of decline of 2% and an increase of 1.5%.
Adjusted operating income is now anticipated to be between $445 million and $515 million, up from $430-$510 million expected previously. Adjusted EBITDA is forecasted at $630-$700 million compared with the earlier range of $615-$695 million. Adjusted EPS is expected to be between $8.04 and $9.57, an increase from the prior guidance of $7.70-$9.38. The company continues to expect capital expenditures to be between $145 million and $160 million.
This Zacks Rank #3 (Hold) company’s shares have gained 17.2% in the past three months compared with the industry’s 19.8% growth.
Some better-ranked stocks are Levi Strauss & Co. LEVI, Sally Beauty Holdings, Inc. SBH, and The TJX Companies, Inc. TJX.
Levi Strauss designs and markets jeans, casual wear and related accessories. It flaunts a Zacks Rank of 1 (Strong Buy) at present. You can see the complete list of today’s Zacks #1 Rank stocks here.
The Zacks Consensus Estimate for Levi Strauss’ current financial-year earnings indicates growth of 4% from the year-ago actual. LEVI delivered a trailing four-quarter average earnings surprise of 25.9%.
Sally Beauty is an international specialty retailer and distributor of professional beauty supplies. It currently carries a Zacks Rank #2 (Buy).
The Zacks Consensus Estimate for Sally Beauty’s fiscal 2025 earnings implies growth of 8.9% from the year-ago actuals. SBH delivered a trailing four-quarter average earnings surprise of 8.3%.
The TJX Companies is a leading off-price retailer of apparel and home fashions. It carries a Zacks Rank #2 at present.
The Zacks Consensus Estimate for The TJX Companies’ current fiscal-year earnings and sales indicates growth of 7% and 5.4%, respectively, from the year-ago actuals. TJX delivered a trailing four-quarter average earnings surprise of 5.4%.
Want the latest recommendations from Zacks Investment Research? Today, you can download 7 Best Stocks for the Next 30 Days. Click to get this free report
This article originally published on Zacks Investment Research (zacks.com).
| Apr-12 | |
| Apr-10 | |
| Apr-09 | |
| Apr-09 | |
| Apr-08 | |
| Apr-08 | |
| Apr-08 | |
| Apr-08 | |
| Apr-08 | |
| Apr-08 | |
| Apr-08 | |
| Apr-08 |
Levi Strauss raises FY26 outlook after strong first-quarter performance
LEVI +10.65%
Retail Insight Network
|
| Apr-08 | |
| Apr-08 | |
| Apr-07 |
Join thousands of traders who make more informed decisions with our premium features. Real-time quotes, advanced visualizations, alerts, and much more.
Learn more about Finviz Elite