|
|
|

|
|||||
|
|
|
From a technical perspective, DNOW (DNOW) is looking like an interesting pick, as it just reached a key level of support. DNOW recently overtook the 20-day moving average, and this suggests a short-term bullish trend.
The 20-day simple moving average is a popular investing tool. Traders like this SMA because it offers a look back at a stock's price over a shorter period and helps smooth out price fluctuations. The 20-day can also show more trend reversal signals than longer-term moving averages.
Similar to other SMAs, if a stock's price moves above the 20-day, the trend is considered positive, while price falling below the moving average can signal a downward trend.
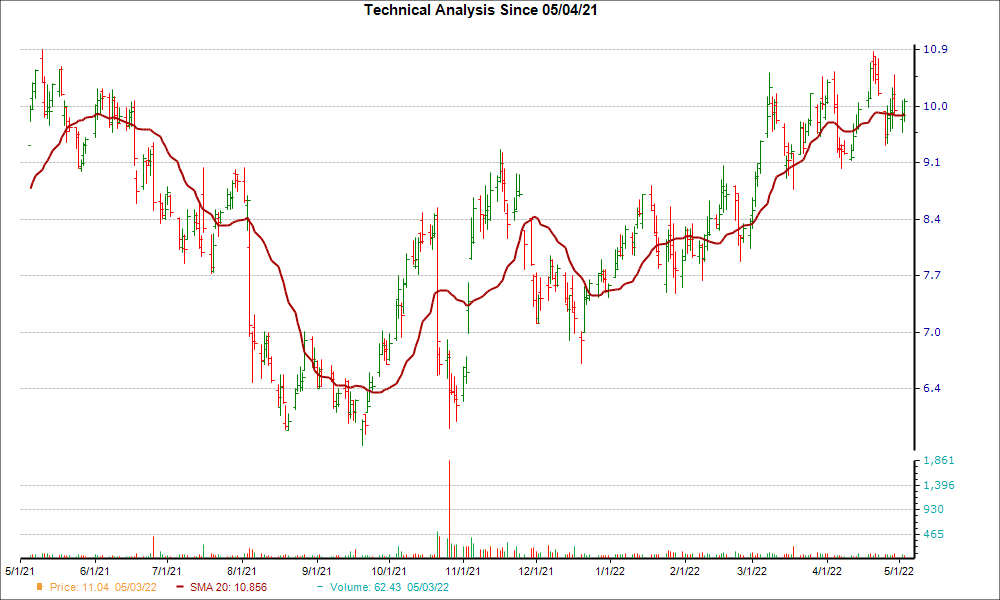
Shares of DNOW have been moving higher over the past four weeks, up 5.6%. Plus, the company is currently a Zacks Rank #2 (Buy) stock, suggesting that DNOW could be poised for a continued surge.
The bullish case only gets stronger once investors take into account DNOW's positive earnings estimate revisions. There have been 2 revisions higher for the current fiscal year compared to none lower, and the consensus estimate has moved up as well.
Investors should think about putting DNOW on their watchlist given the ultra-important technical indicator and positive move in earnings estimate revisions.
Want the latest recommendations from Zacks Investment Research? Today, you can download 7 Best Stocks for the Next 30 Days. Click to get this free report
This article originally published on Zacks Investment Research (zacks.com).
| Jul-08 | |
| May-21 | |
| May-08 | |
| May-07 | |
| May-07 | |
| May-04 | |
| Apr-21 | |
| Mar-03 | |
| Mar-02 | |
| Feb-20 | |
| Feb-20 | |
| Feb-20 | |
| Feb-20 | |
| Feb-20 | |
| Feb-20 |
Join thousands of traders who make more informed decisions with our premium features. Real-time quotes, advanced visualizations, alerts, and much more.
Learn more about Finviz Elite