|
|
|

|
|||||
|
|
|

Rail transportation company Greenbrier (NYSE:GBX) fell short of the market’s revenue expectations in Q3 CY2025, with sales falling 27.9% year on year to $759.5 million. The company’s full-year revenue guidance of $2.95 billion at the midpoint came in 6.5% below analysts’ estimates. Its GAAP profit of $1.16 per share was 1.7% below analysts’ consensus estimates.
Is now the time to buy Greenbrier? Find out by accessing our full research report, it’s free for active Edge members.
Having designed the industry’s first double-decker railcar in the 1980s, Greenbrier (NYSE:GBX) supplies the freight rail transportation industry with railcars and related services.
A company’s long-term sales performance is one signal of its overall quality. Any business can experience short-term success, but top-performing ones enjoy sustained growth for years. Over the last five years, Greenbrier grew its sales at a sluggish 3% compounded annual growth rate. This was below our standard for the industrials sector and is a rough starting point for our analysis.
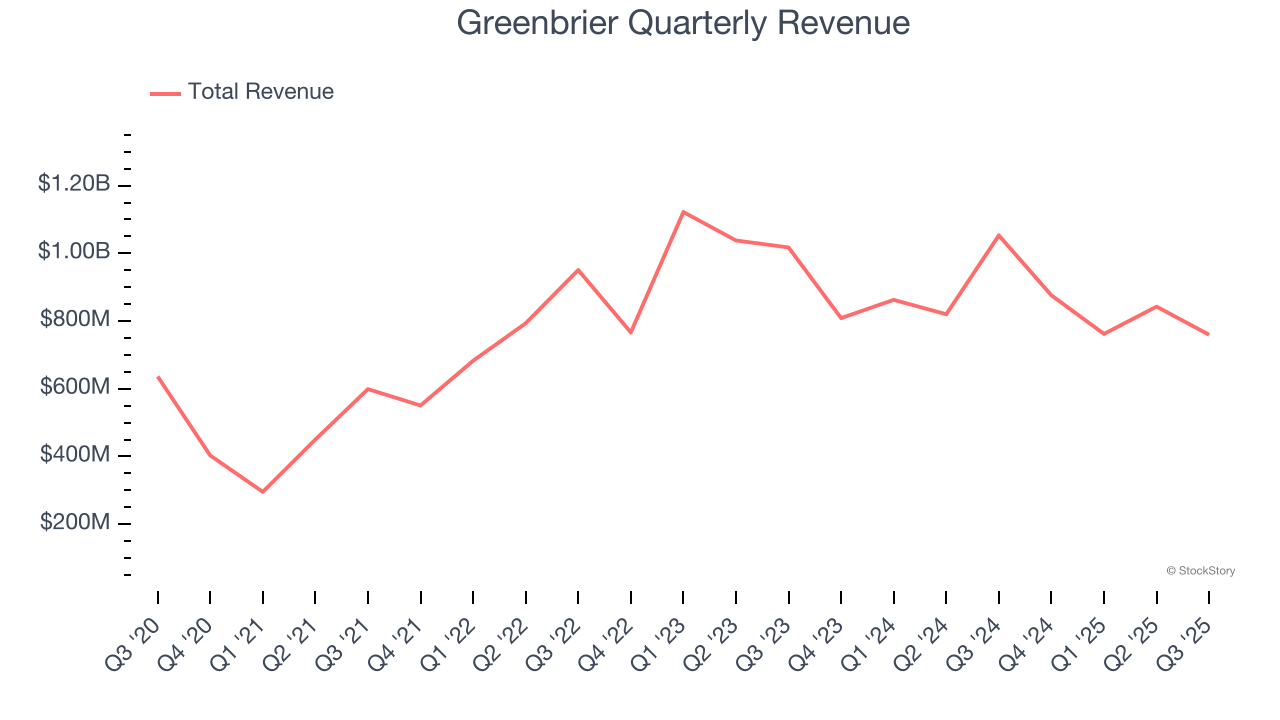
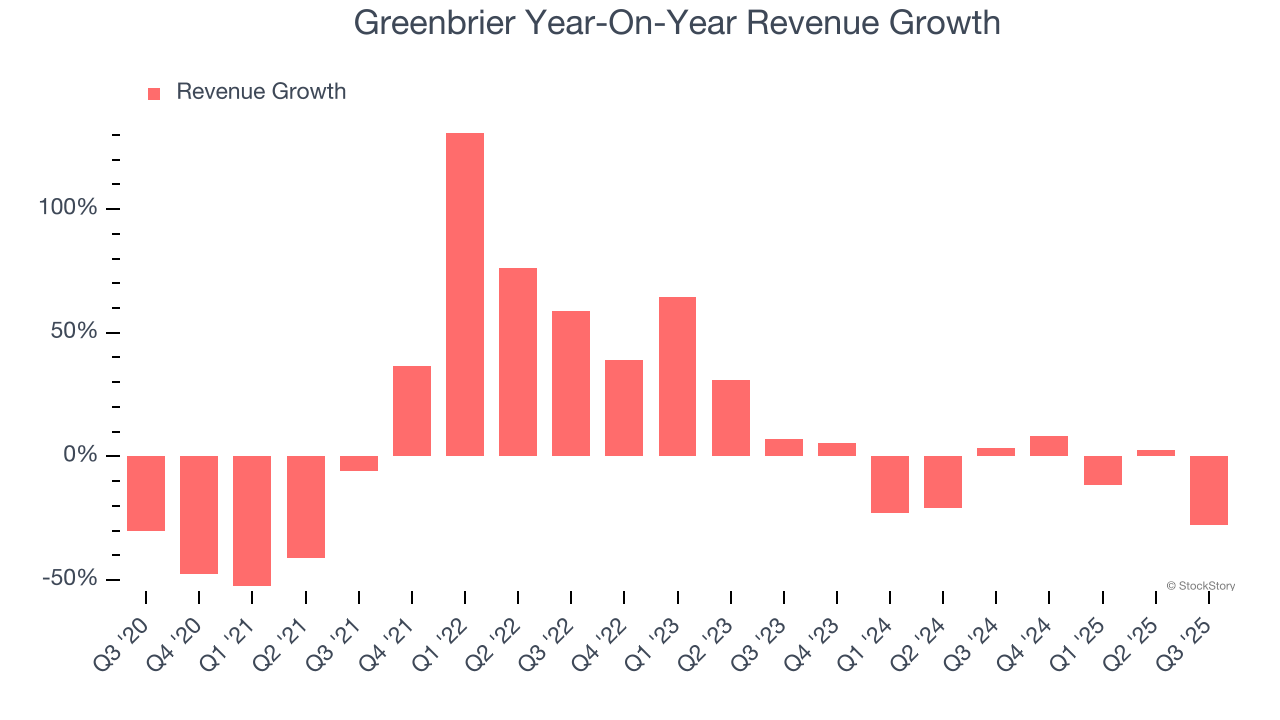
We at StockStory place the most emphasis on long-term growth, but within industrials, a half-decade historical view may miss cycles, industry trends, or a company capitalizing on catalysts such as a new contract win or a successful product line. Greenbrier’s performance shows it grew in the past but relinquished its gains over the last two years, as its revenue fell by 9.4% annually. Greenbrier isn’t alone in its struggles as the Heavy Transportation Equipment industry experienced a cyclical downturn, with many similar businesses observing lower sales at this time.
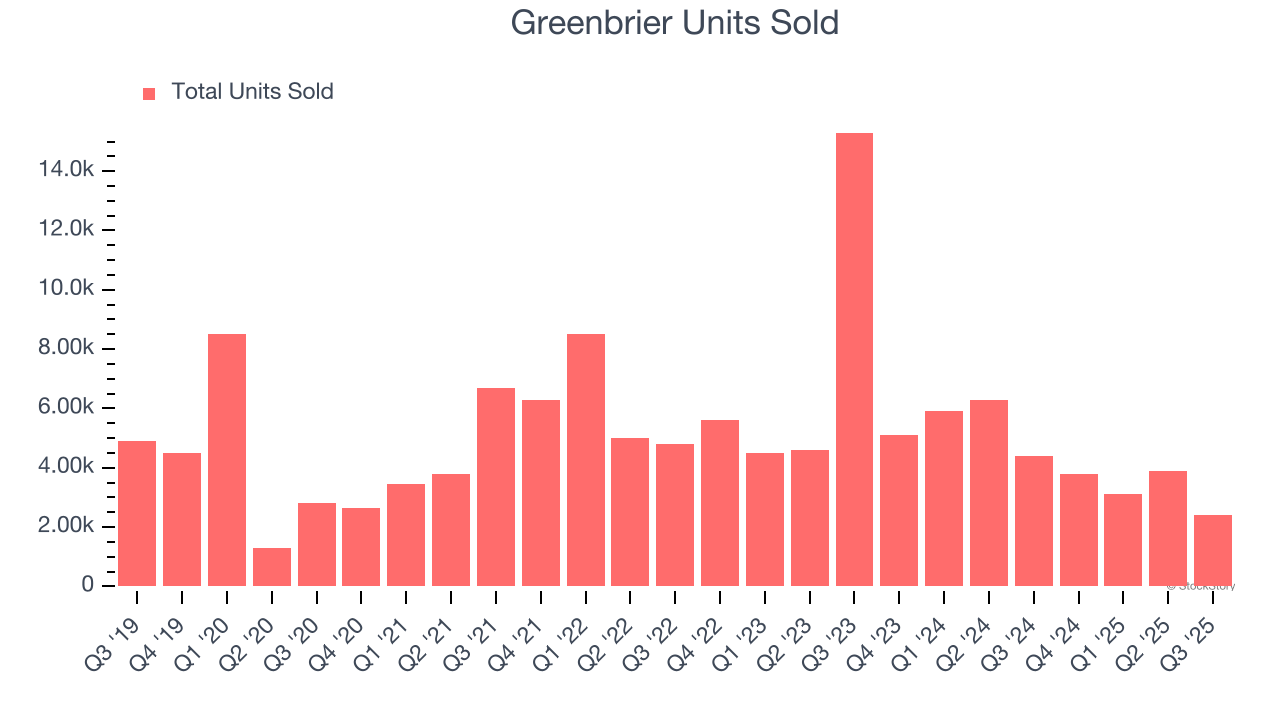
Greenbrier also reports its number of units sold, which reached 2,400 in the latest quarter. Over the last two years, Greenbrier’s units sold averaged 21.1% year-on-year declines. Because this number is lower than its revenue growth, we can see the company benefited from price increases.
This quarter, Greenbrier missed Wall Street’s estimates and reported a rather uninspiring 27.9% year-on-year revenue decline, generating $759.5 million of revenue.
Looking ahead, sell-side analysts expect revenue to grow 1.5% over the next 12 months. Although this projection suggests its newer products and services will spur better top-line performance, it is still below the sector average.
Unless you’ve been living under a rock, it should be obvious by now that generative AI is going to have a huge impact on how large corporations do business. While Nvidia and AMD are trading close to all-time highs, we prefer a lesser-known (but still profitable) stock benefiting from the rise of AI. Click here to access our free report one of our favorites growth stories.
Operating margin is a key measure of profitability. Think of it as net income - the bottom line - excluding the impact of taxes and interest on debt, which are less connected to business fundamentals.
Greenbrier was profitable over the last five years but held back by its large cost base. Its average operating margin of 6.6% was weak for an industrials business. This result isn’t too surprising given its low gross margin as a starting point.
On the plus side, Greenbrier’s operating margin rose by 8.8 percentage points over the last five years, as its sales growth gave it operating leverage.
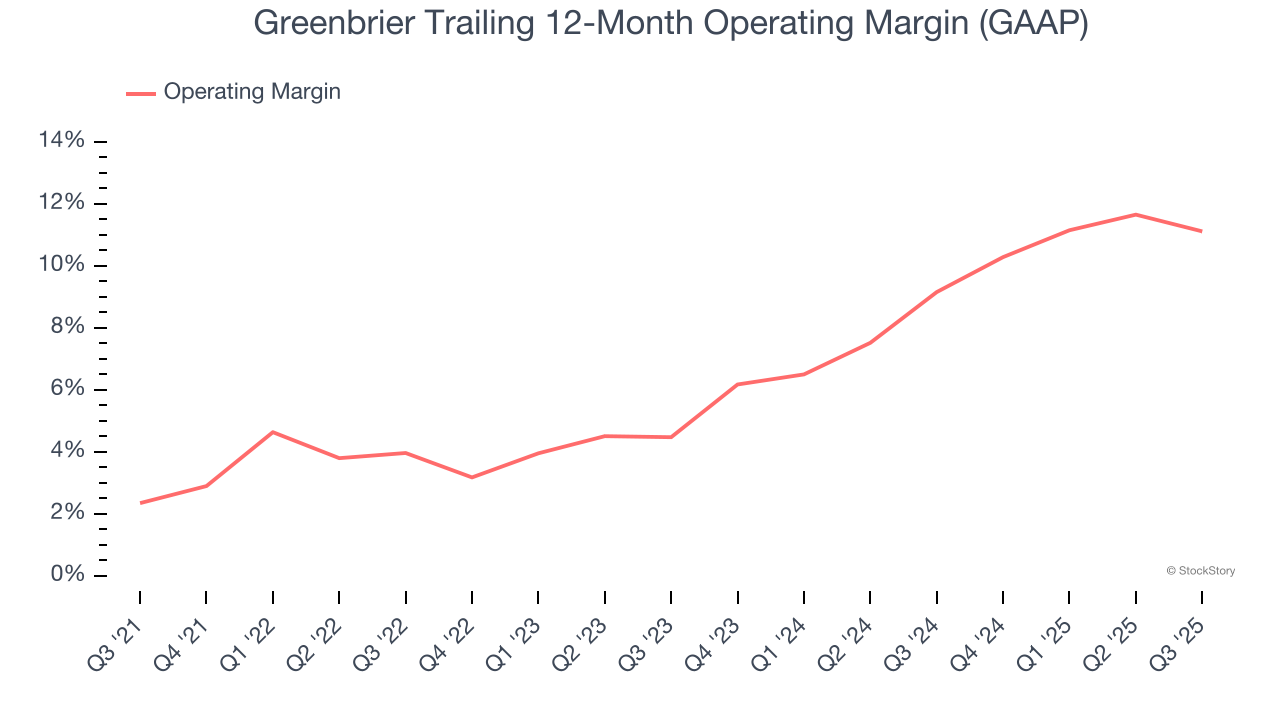
This quarter, Greenbrier generated an operating margin profit margin of 9.5%, down 2.3 percentage points year on year. Since Greenbrier’s operating margin decreased more than its gross margin, we can assume it was less efficient because expenses such as marketing, R&D, and administrative overhead increased.
Revenue trends explain a company’s historical growth, but the long-term change in earnings per share (EPS) points to the profitability of that growth – for example, a company could inflate its sales through excessive spending on advertising and promotions.
Greenbrier’s EPS grew at an astounding 33.9% compounded annual growth rate over the last five years, higher than its 3% annualized revenue growth. This tells us the company became more profitable on a per-share basis as it expanded.
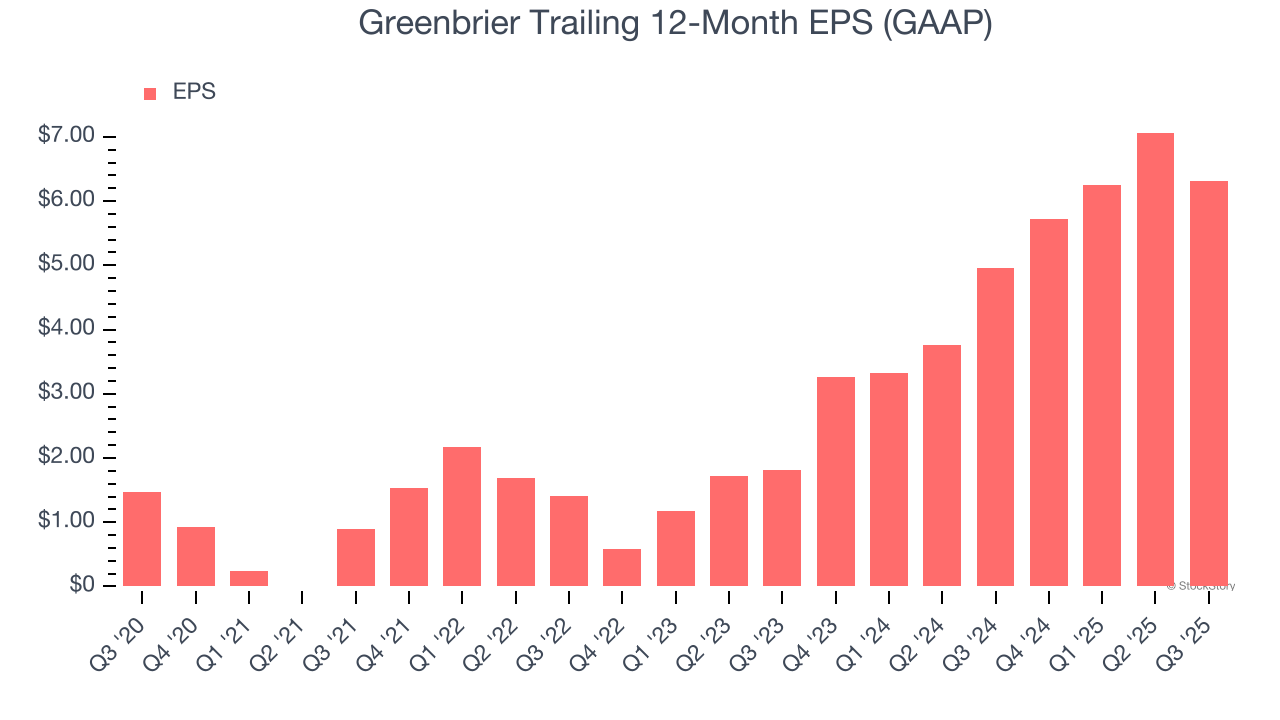
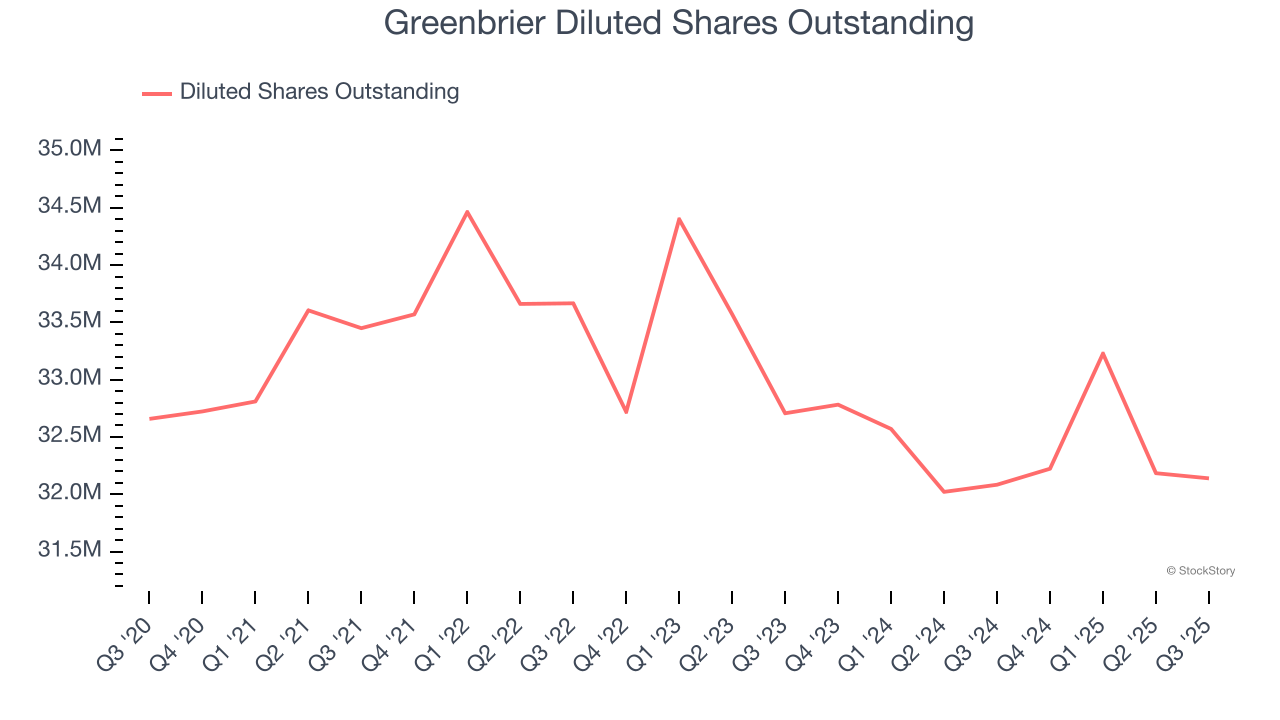
We can take a deeper look into Greenbrier’s earnings quality to better understand the drivers of its performance. As we mentioned earlier, Greenbrier’s operating margin declined this quarter but expanded by 8.8 percentage points over the last five years. Its share count also shrank by 1.6%, and these factors together are positive signs for shareholders because improving profitability and share buybacks turbocharge EPS growth relative to revenue growth.
Like with revenue, we analyze EPS over a more recent period because it can provide insight into an emerging theme or development for the business.
For Greenbrier, its two-year annual EPS growth of 86.1% was higher than its five-year trend. We love it when earnings growth accelerates, especially when it accelerates off an already high base.
In Q3, Greenbrier reported EPS of $1.16, down from $1.92 in the same quarter last year. This print slightly missed analysts’ estimates, but we care more about long-term EPS growth than short-term movements. We also like to analyze expected EPS growth based on Wall Street analysts’ consensus projections, but there is insufficient data.
We were impressed by how significantly Greenbrier blew past analysts’ EBITDA expectations this quarter. On the other hand, its revenue, EPS, and full-year guidance for both metrics missed. Overall, this was a softer quarter. The stock traded down 6% to $42.54 immediately following the results.
Greenbrier’s earnings report left more to be desired. Let’s look forward to see if this quarter has created an opportunity to buy the stock. The latest quarter does matter, but not nearly as much as longer-term fundamentals and valuation, when deciding if the stock is a buy. We cover that in our actionable full research report which you can read here, it’s free for active Edge members.
| Jul-23 | |
| Jul-22 | |
| Jul-06 | |
| Jul-02 | |
| Jul-02 | |
| Jul-02 | |
| Jul-01 | |
| Jul-01 | |
| Jul-01 | |
| Jul-01 | |
| Jun-16 | |
| May-21 | |
| May-05 | |
| Apr-08 | |
| Apr-07 |
Join thousands of traders who make more informed decisions with our premium features. Real-time quotes, advanced visualizations, alerts, and much more.
Learn more about Finviz Elite