|
|
|

|
|||||
|
|
|

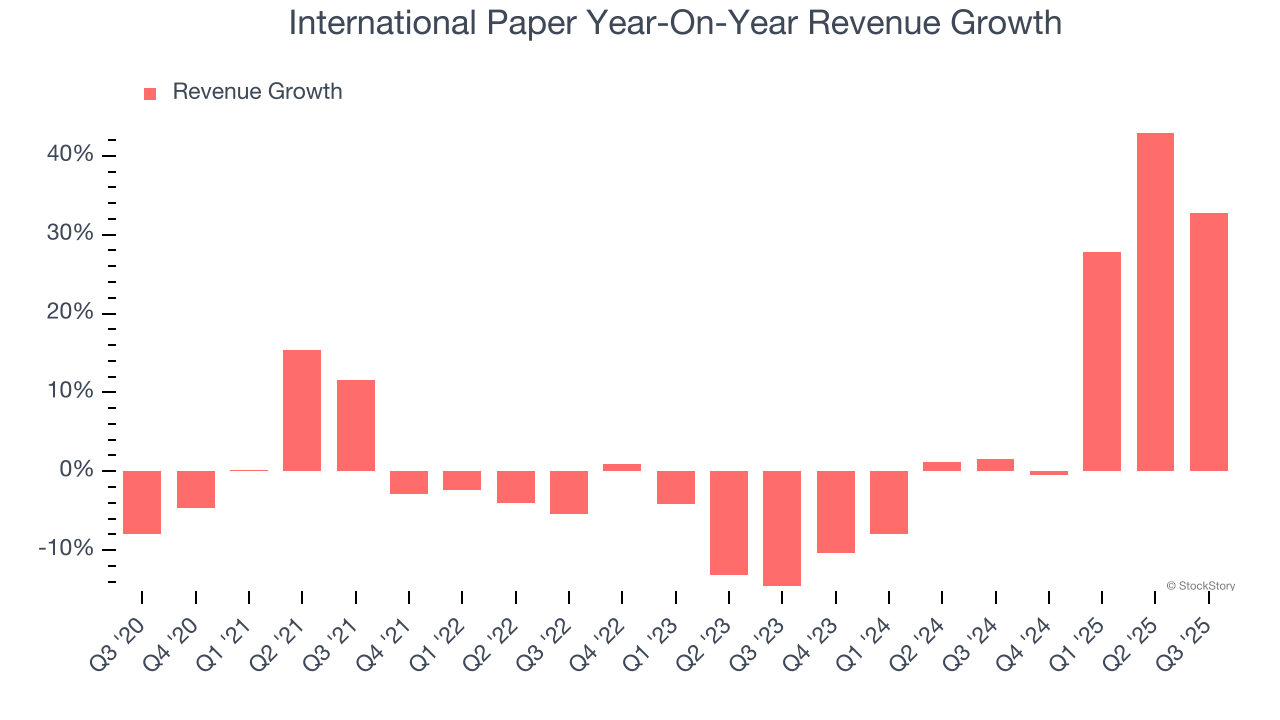
Packaging and materials company International Paper (NYSE:IP) fell short of the markets revenue expectations in Q3 CY2025, but sales rose 32.8% year on year to $6.22 billion. Its non-GAAP loss of $0.43 per share was significantly below analysts’ consensus estimates.
Is now the time to buy International Paper? Find out by accessing our full research report, it’s free for active Edge members.
Established in 1898, International Paper (NYSE:IP) produces containerboard, pulp, paper, and materials used in packaging and printing applications.
Reviewing a company’s long-term sales performance reveals insights into its quality. Any business can experience short-term success, but top-performing ones enjoy sustained growth for years. Over the last five years, International Paper grew its sales at a sluggish 2.4% compounded annual growth rate. This fell short of our benchmarks and is a rough starting point for our analysis.
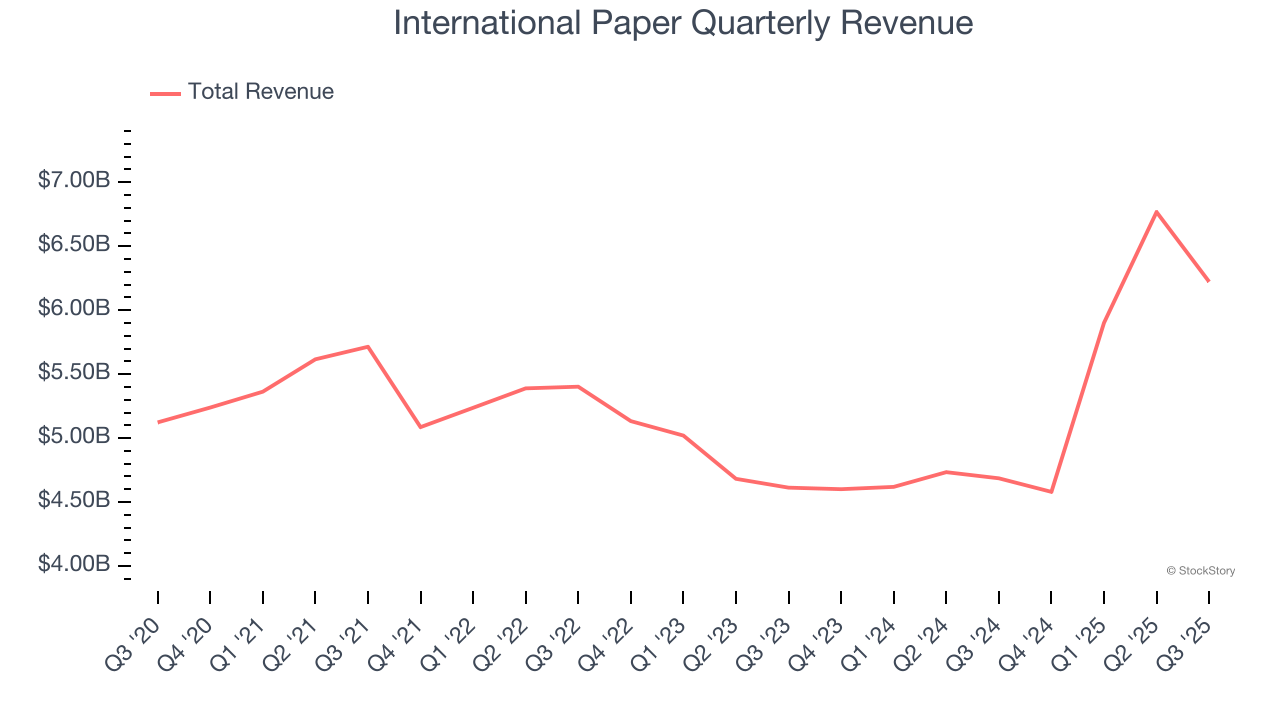
We at StockStory place the most emphasis on long-term growth, but within industrials, a half-decade historical view may miss cycles, industry trends, or a company capitalizing on catalysts such as a new contract win or a successful product line. International Paper’s annualized revenue growth of 9.9% over the last two years is above its five-year trend, suggesting its demand recently accelerated.
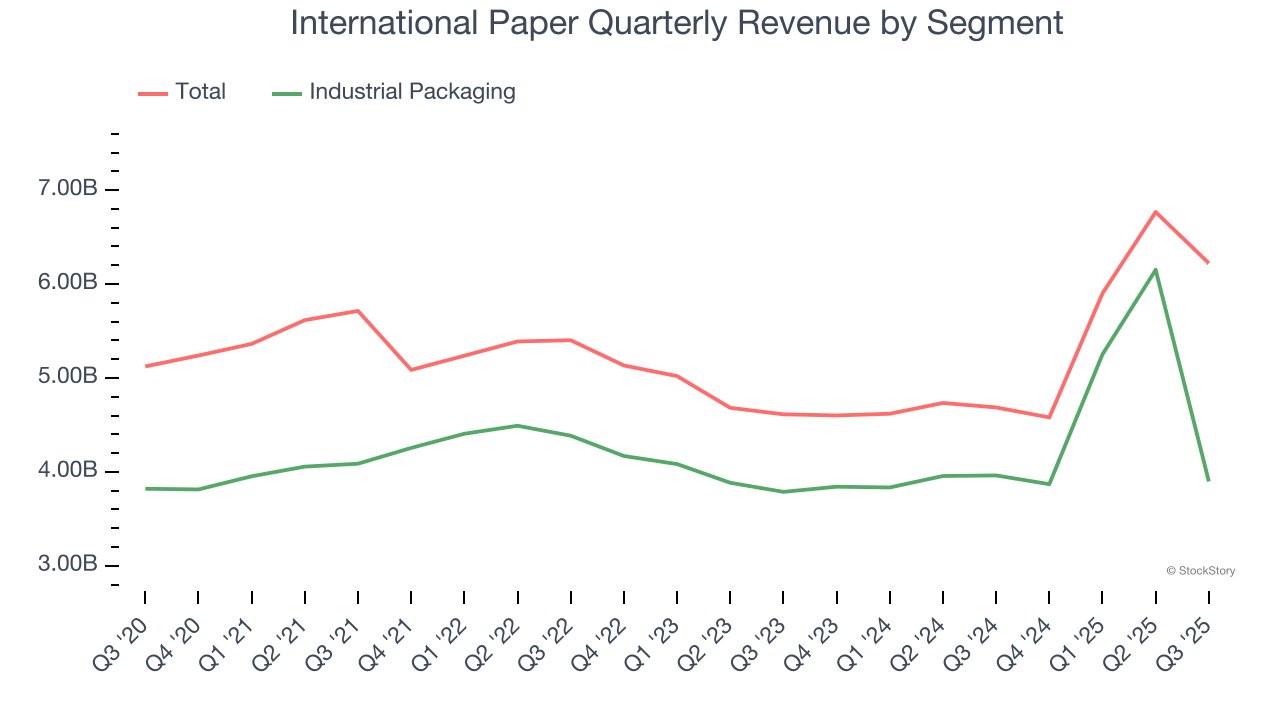
We can dig further into the company’s revenue dynamics by analyzing its most important segment, Industrial Packaging. Over the last two years, International Paper’s Industrial Packaging revenue (containers, displays, bins) averaged 10.5% year-on-year growth.
This quarter, International Paper pulled off a wonderful 32.8% year-on-year revenue growth rate, but its $6.22 billion of revenue fell short of Wall Street’s rosy estimates.
Looking ahead, sell-side analysts expect revenue to grow 10% over the next 12 months, similar to its two-year rate. This projection is particularly noteworthy for a company of its scale and indicates the market sees success for its products and services.
Today’s young investors won’t have read the timeless lessons in Gorilla Game: Picking Winners In High Technology because it was written more than 20 years ago when Microsoft and Apple were first establishing their supremacy. But if we apply the same principles, then enterprise software stocks leveraging their own generative AI capabilities may well be the Gorillas of the future. So, in that spirit, we are excited to present our Special Free Report on a profitable, fast-growing enterprise software stock that is already riding the automation wave and looking to catch the generative AI next.
Operating margin is an important measure of profitability as it shows the portion of revenue left after accounting for all core expenses – everything from the cost of goods sold to advertising and wages. It’s also useful for comparing profitability across companies with different levels of debt and tax rates because it excludes interest and taxes.
International Paper was profitable over the last five years but held back by its large cost base. Its average operating margin of 4.5% was weak for an industrials business.
Analyzing the trend in its profitability, International Paper’s operating margin decreased by 10.7 percentage points over the last five years. This raises questions about the company’s expense base because its revenue growth should have given it leverage on its fixed costs, resulting in better economies of scale and profitability. International Paper’s performance was poor no matter how you look at it - it shows that costs were rising and it couldn’t pass them onto its customers.
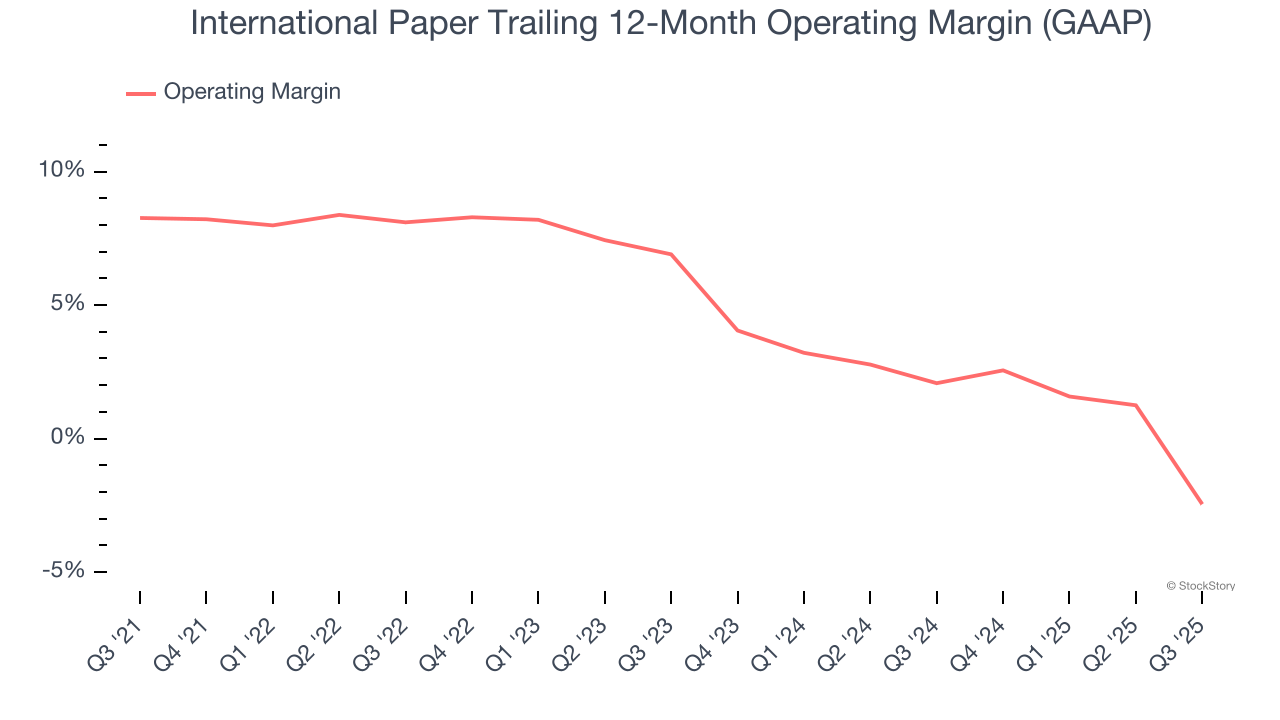
In Q3, International Paper generated an operating margin profit margin of negative 10.8%, down 14.6 percentage points year on year. Conversely, its revenue and gross margin actually rose, so we can assume it was less efficient because its operating expenses like marketing, R&D, and administrative overhead grew faster than its revenue.
We track the long-term change in earnings per share (EPS) for the same reason as long-term revenue growth. Compared to revenue, however, EPS highlights whether a company’s growth is profitable.
Sadly for International Paper, its EPS declined by 14.9% annually over the last five years while its revenue grew by 2.4%. This tells us the company became less profitable on a per-share basis as it expanded.
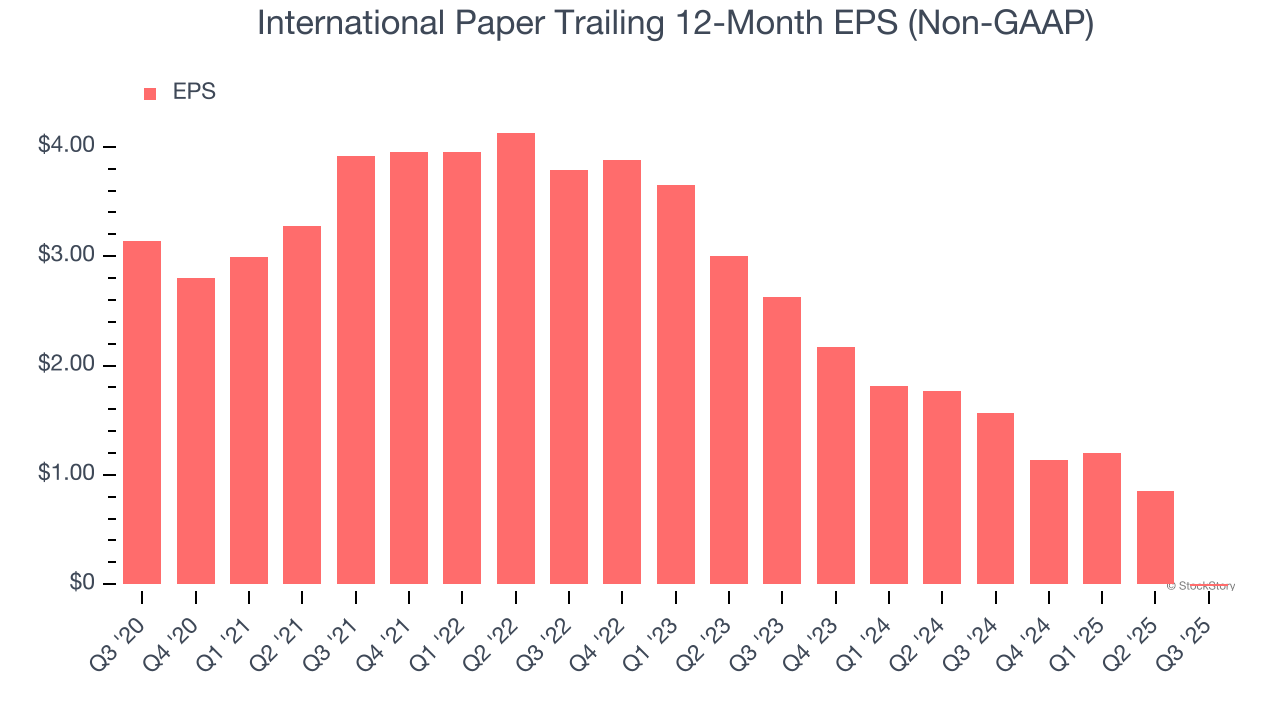
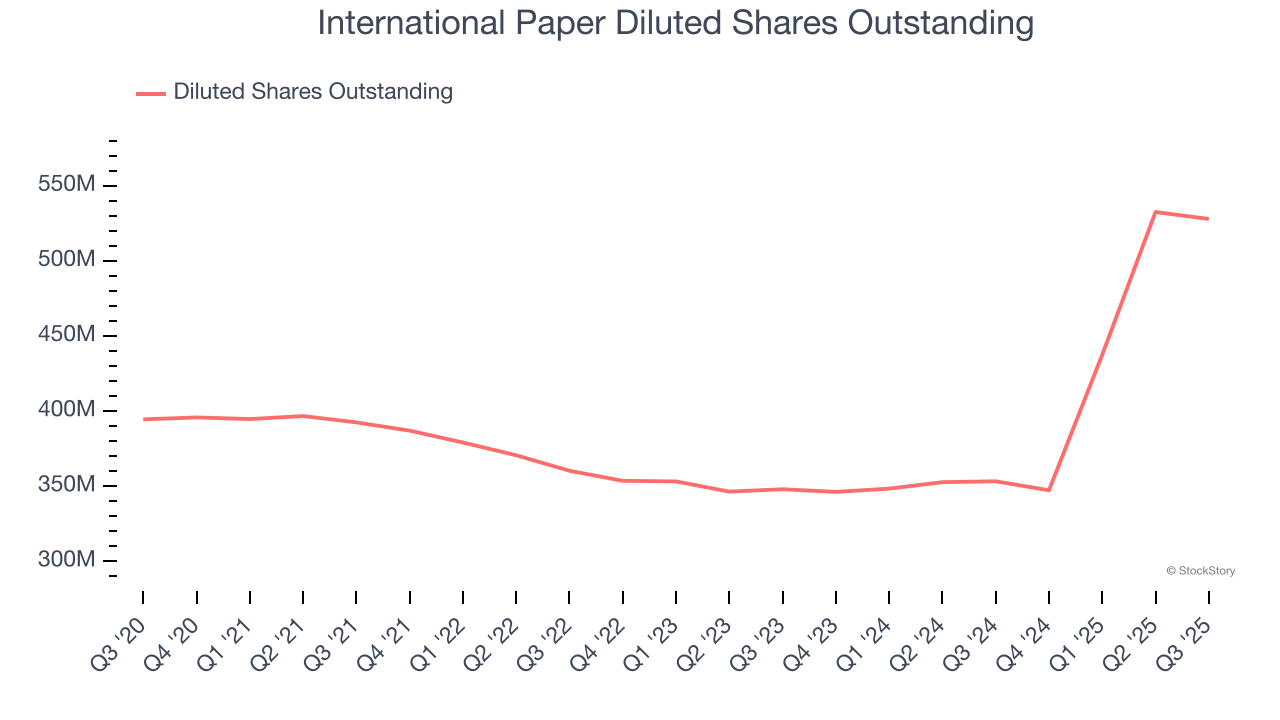
We can take a deeper look into International Paper’s earnings to better understand the drivers of its performance. As we mentioned earlier, International Paper’s operating margin declined by 10.7 percentage points over the last five years. Its share count also grew by 33.8%, meaning the company not only became less efficient with its operating expenses but also diluted its shareholders.
Like with revenue, we analyze EPS over a shorter period to see if we are missing a change in the business.
For International Paper, its two-year annual EPS declines of 41.7% show it’s continued to underperform. These results were bad no matter how you slice the data.
In Q3, International Paper reported adjusted EPS of negative $0.43, down from $0.44 in the same quarter last year. This print missed analysts’ estimates. Over the next 12 months, Wall Street is optimistic. Analysts forecast International Paper’s full-year EPS of negative $0.02 will flip to positive $2.77.
We struggled to find many positives in these results. Its and its revenue fell short of Wall Street’s estimates, leading to an EPS shortfall versus expectations. Overall, this quarter could have been better. The stock traded down 8.5% to $40.50 immediately after reporting.
The latest quarter from International Paper’s wasn’t that good. One earnings report doesn’t define a company’s quality, though, so let’s explore whether the stock is a buy at the current price. When making that decision, it’s important to consider its valuation, business qualities, as well as what has happened in the latest quarter. We cover that in our actionable full research report which you can read here, it’s free for active Edge members.
| Apr-17 | |
| Apr-17 | |
| Apr-16 | |
| Apr-10 | |
| Apr-08 | |
| Apr-03 | |
| Apr-02 | |
| Apr-01 | |
| Mar-31 | |
| Mar-23 | |
| Mar-20 | |
| Mar-20 | |
| Mar-20 | |
| Mar-20 | |
| Mar-18 |
Join thousands of traders who make more informed decisions with our premium features. Real-time quotes, advanced visualizations, alerts, and much more.
Learn more about Finviz Elite