|
|
|

|
|||||
|
|
|

Kitchen product manufacturer Middleby (NYSE:MIDD) reported revenue ahead of Wall Streets expectations in Q3 CY2025, with sales up 4.2% year on year to $982.1 million. The company expects next quarter’s revenue to be around $1.01 billion, close to analysts’ estimates. Its non-GAAP profit of $2.37 per share was 14.5% above analysts’ consensus estimates.
Is now the time to buy Middleby? Find out by accessing our full research report, it’s free for active Edge members.
Holding a Guinness World Record for creating the world’s fastest conveyor pizza oven, Middleby (NYSE:MIDD) is a food service and equipment manufacturer.
A company’s long-term performance is an indicator of its overall quality. Any business can experience short-term success, but top-performing ones enjoy sustained growth for years. Over the last five years, Middleby grew its sales at a decent 8.6% compounded annual growth rate. Its growth was slightly above the average industrials company and shows its offerings resonate with customers.
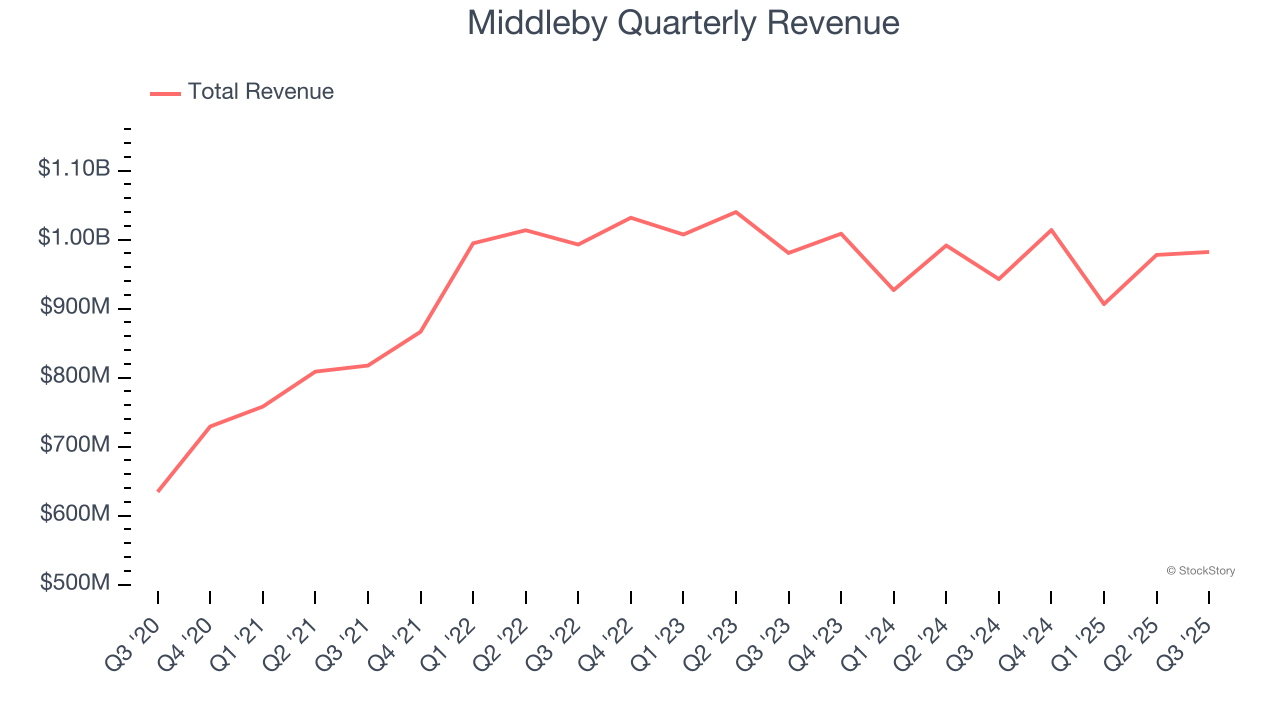
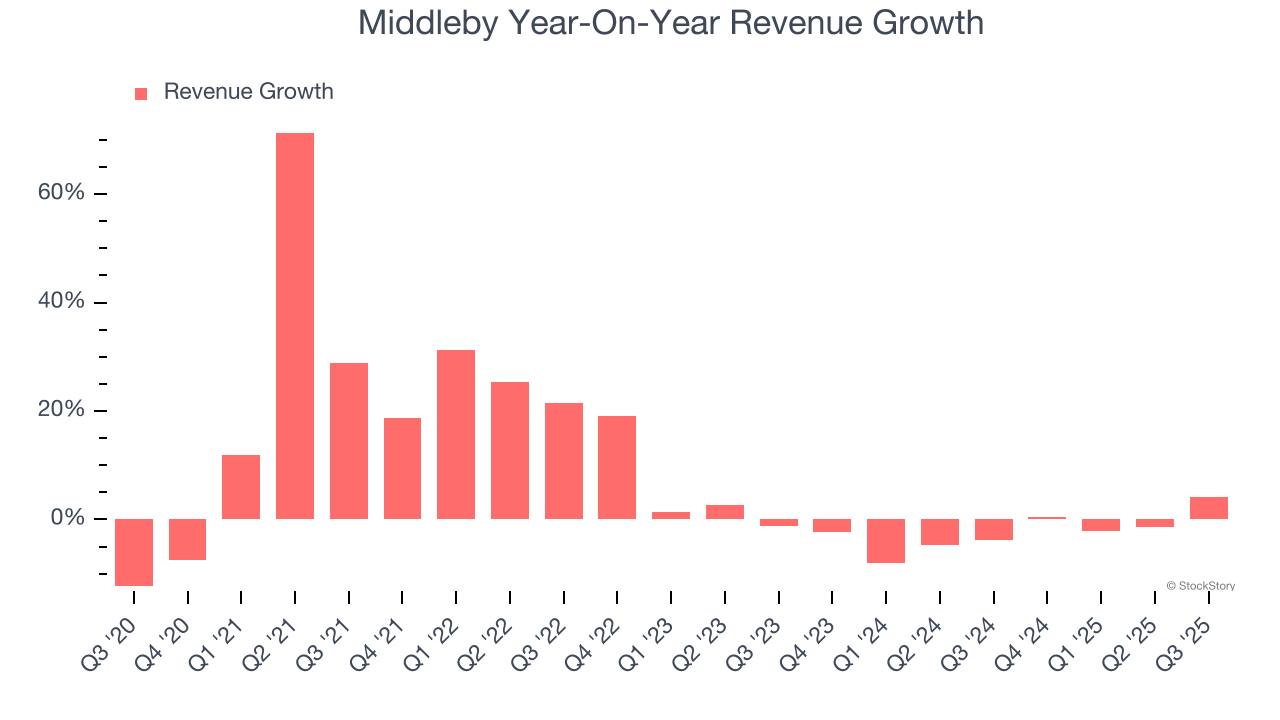
We at StockStory place the most emphasis on long-term growth, but within industrials, a half-decade historical view may miss cycles, industry trends, or a company capitalizing on catalysts such as a new contract win or a successful product line. Middleby’s recent performance marks a sharp pivot from its five-year trend as its revenue has shown annualized declines of 2.2% over the last two years.
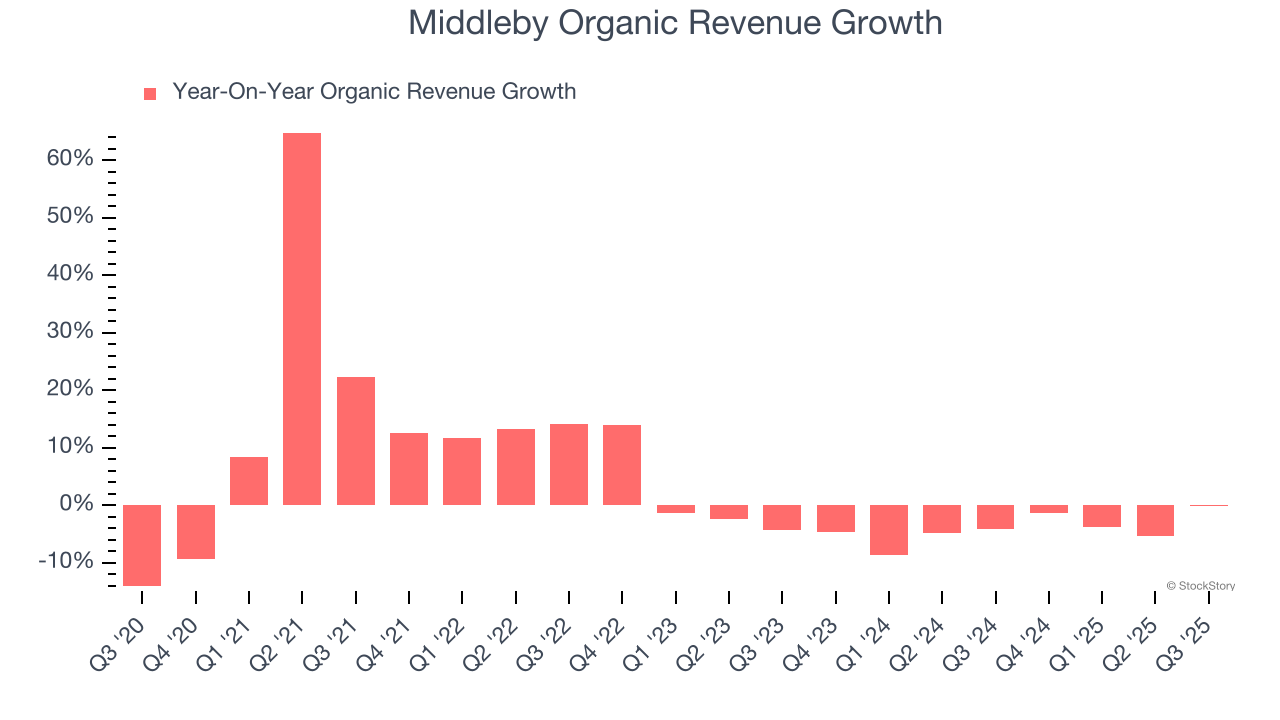
We can better understand the company’s sales dynamics by analyzing its organic revenue, which strips out one-time events like acquisitions and currency fluctuations that don’t accurately reflect its fundamentals. Over the last two years, Middleby’s organic revenue averaged 4.1% year-on-year declines. Because this number is lower than its two-year revenue growth, we can see that some mixture of acquisitions and foreign exchange rates boosted its headline results.
This quarter, Middleby reported modest year-on-year revenue growth of 4.2% but beat Wall Street’s estimates by 2.2%. Company management is currently guiding for flat sales next quarter.
Looking further ahead, sell-side analysts expect revenue to grow 2% over the next 12 months. While this projection implies its newer products and services will spur better top-line performance, it is still below average for the sector.
Microsoft, Alphabet, Coca-Cola, Monster Beverage—all began as under-the-radar growth stories riding a massive trend. We’ve identified the next one: a profitable AI semiconductor play Wall Street is still overlooking. Go here for access to our full report.
Middleby has been an efficient company over the last five years. It was one of the more profitable businesses in the industrials sector, boasting an average operating margin of 12.7%. This result isn’t surprising as its high gross margin gives it a favorable starting point.
Looking at the trend in its profitability, Middleby’s operating margin decreased by 21.1 percentage points over the last five years. This raises questions about the company’s expense base because its revenue growth should have given it leverage on its fixed costs, resulting in better economies of scale and profitability.

This quarter, Middleby generated an operating margin profit margin of negative 56.4%, down 74.8 percentage points year on year. Since Middleby’s operating margin decreased more than its gross margin, we can assume it was less efficient because expenses such as marketing, R&D, and administrative overhead increased.
Revenue trends explain a company’s historical growth, but the long-term change in earnings per share (EPS) points to the profitability of that growth – for example, a company could inflate its sales through excessive spending on advertising and promotions.
Middleby’s EPS grew at a remarkable 13.2% compounded annual growth rate over the last five years, higher than its 8.6% annualized revenue growth. However, this alone doesn’t tell us much about its business quality because its operating margin didn’t improve.
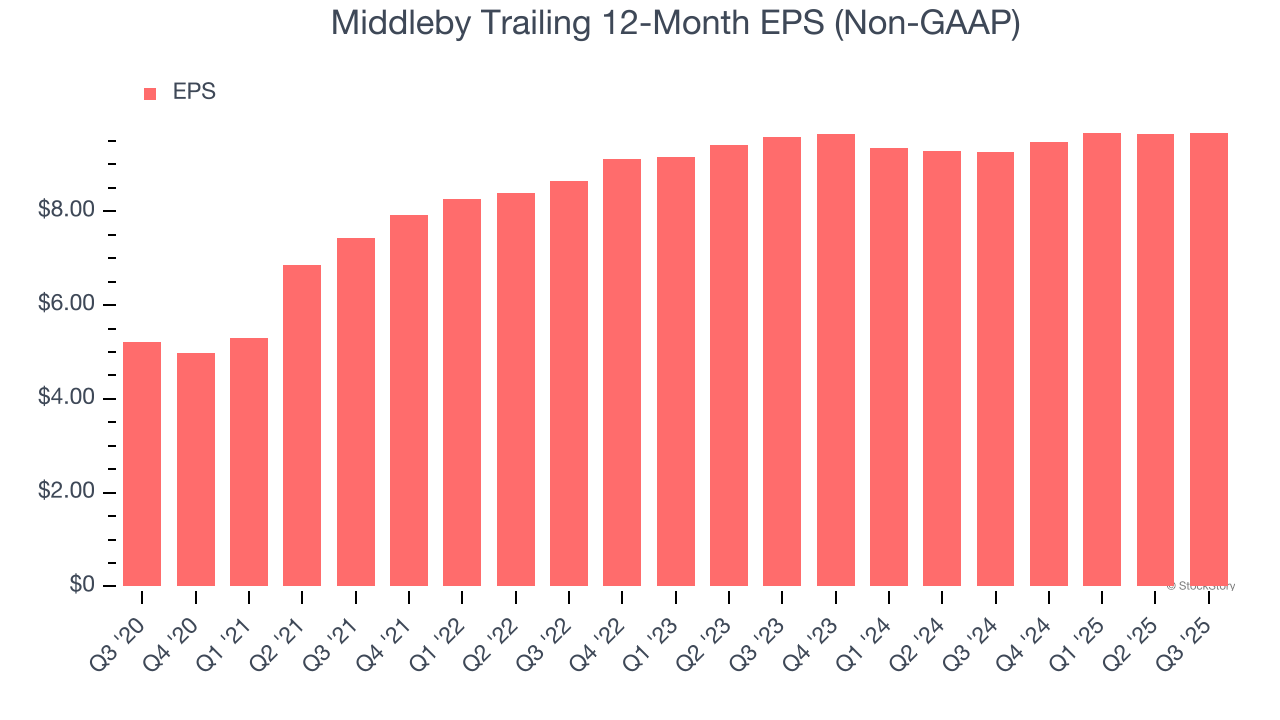
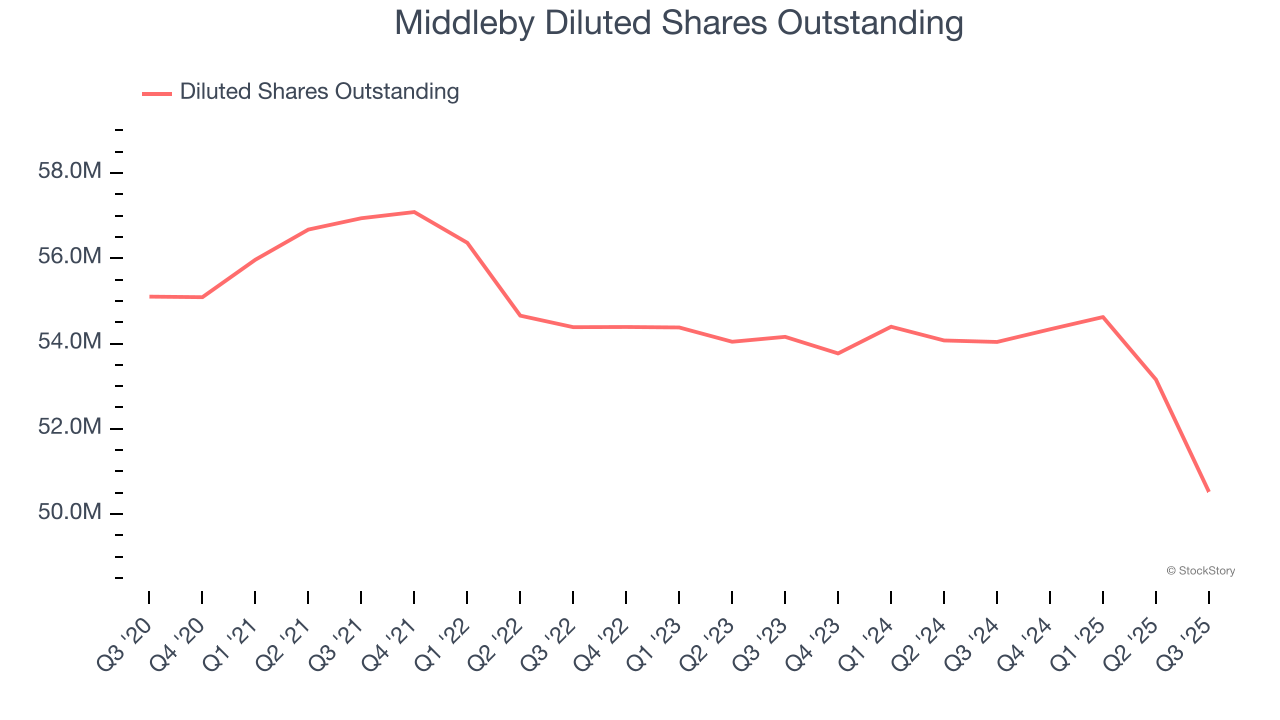
Diving into the nuances of Middleby’s earnings can give us a better understanding of its performance. A five-year view shows that Middleby has repurchased its stock, shrinking its share count by 8.3%. This tells us its EPS outperformed its revenue not because of increased operational efficiency but financial engineering, as buybacks boost per share earnings.
Like with revenue, we analyze EPS over a shorter period to see if we are missing a change in the business.
For Middleby, EPS didn’t budge over the last two years, a regression from its five-year trend. We hope it can revert to earnings growth in the coming years.
In Q3, Middleby reported adjusted EPS of $2.37, up from $2.33 in the same quarter last year. This print easily cleared analysts’ estimates, and shareholders should be content with the results. Over the next 12 months, Wall Street expects Middleby’s full-year EPS of $9.68 to shrink by 7%.
We enjoyed seeing Middleby beat analysts’ revenue expectations this quarter. We were also glad its EPS outperformed Wall Street’s estimates. On the other hand, its EBITDA guidance for next quarter missed. Overall, this print had some key positives. The stock traded up 2.8% to $127 immediately after reporting.
Indeed, Middleby had a rock-solid quarterly earnings result, but is this stock a good investment here? If you’re making that decision, you should consider the bigger picture of valuation, business qualities, as well as the latest earnings. We cover that in our actionable full research report which you can read here, it’s free for active Edge members.
| Jul-09 | |
| Jul-07 | |
| Jul-06 | |
| Jul-06 | |
| Jul-02 | |
| Jun-29 | |
| Jun-22 | |
| Jun-17 | |
| May-12 | |
| May-11 | |
| May-07 | |
| May-07 | |
| May-07 | |
| May-07 | |
| May-04 |
Join thousands of traders who make more informed decisions with our premium features. Real-time quotes, advanced visualizations, alerts, and much more.
Learn more about Finviz Elite