|
|
|

|
|||||
|
|
|
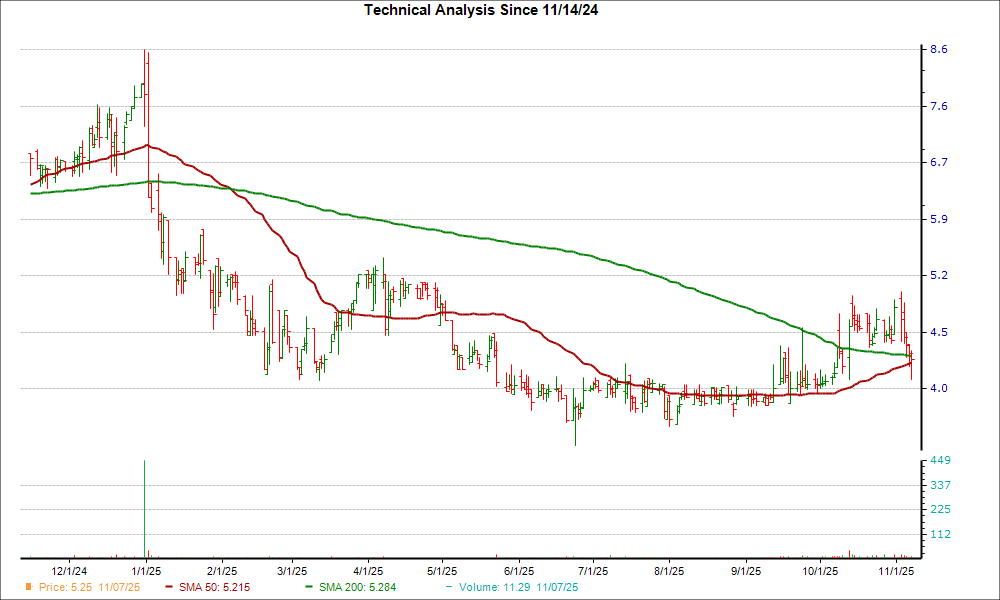
Nexa Resources S.A. (NEXA) reached a significant support level, and could be a good pick for investors from a technical perspective. Recently, NEXA's 50-day simple moving average broke out above its 200-day moving average; this is known as a "golden cross."
A golden cross is a technical chart pattern that can signify a potential bullish breakout. It's formed from a crossover involving a security's short-term moving average breaking above a longer-term moving average, with the most common moving averages being the 50-day and the 200-day, since bigger time periods tend to form stronger breakouts.
Golden crosses have three key stages that investors look out for. It starts with a downtrend in a stock's price that eventually bottoms out, followed by the stock's shorter moving average crossing over its longer moving average and triggering a trend reversal. The final stage is when a stock continues the upward climb to higher prices.
This kind of chart pattern is the opposite of a death cross, which is a technical event that suggests future bearish price movement.
NEXA has rallied 13.4% over the past four weeks, and the company is a #3 (Hold) on the Zacks Rank at the moment. This combination indicates NEXA could be poised for a breakout.
The bullish case solidifies once investors consider NEXA's positive earnings outlook. For the current quarter, no earnings estimate has been cut compared to 3 revisions higher in the past 60 days. The Zacks Consensus Estimate has increased too.
Investors should think about putting NEXAon their watchlist given the ultra-important technical indicator and positive move in earnings estimates.
Want the latest recommendations from Zacks Investment Research? Today, you can download 7 Best Stocks for the Next 30 Days. Click to get this free report
This article originally published on Zacks Investment Research (zacks.com).
| Jul-02 | |
| Jun-25 | |
| May-29 | |
| May-13 | |
| May-07 | |
| May-06 | |
| Apr-24 | |
| Apr-21 | |
| Mar-26 | |
| Mar-26 | |
| Mar-10 | |
| Mar-10 | |
| Mar-09 | |
| Mar-06 | |
| Mar-05 |
Join thousands of traders who make more informed decisions with our premium features. Real-time quotes, advanced visualizations, alerts, and much more.
Learn more about Finviz Elite