|
|
|

|
|||||
|
|
|

RV manufacturer Thor Industries (NYSE:THO) reported Q3 CY2025 results topping the market’s revenue expectations, with sales up 11.5% year on year to $2.39 billion. On the other hand, the company’s full-year revenue guidance of $9.25 billion at the midpoint came in 2.3% below analysts’ estimates. Its GAAP profit of $0.41 per share was significantly above analysts’ consensus estimates.
Is now the time to buy THOR Industries? Find out by accessing our full research report, it’s free for active Edge members.
"The quarter finished stronger than we expected, and we are excited about the impact of the actions we are taking to improve the strength of our business and control what we can control so that when the market rebounds we will bounce back stronger than ever. Our 2025 Open House event in September was another success and represented a marked improvement versus last year as I heard great dealer feedback on the new products on display, in particular the new Keystone Montana and Heartland Bighorn products," stated Bob Martin, President and Chief Executive Officer of THOR Industries.
Created through the acquisition and merger of various RV manufacturers, THOR Industries manufactures and sells a range of recreational vehicles, including motorhomes and travel trailers, catering to consumers seeking the freedom and comfort of the RV lifestyle.
A company’s long-term performance is an indicator of its overall quality. Even a bad business can shine for one or two quarters, but a top-tier one grows for years. Over the last five years, THOR Industries grew its sales at a sluggish 2.8% compounded annual growth rate. This fell short of our benchmarks and is a tough starting point for our analysis.
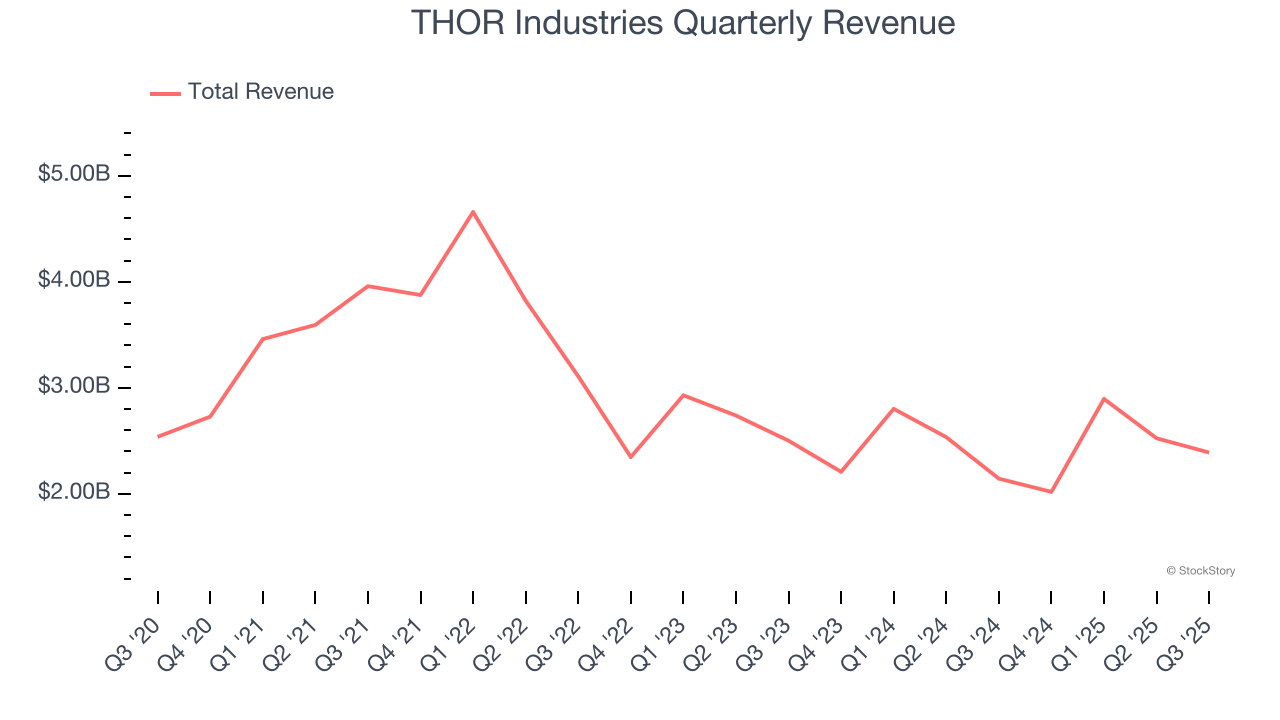
Long-term growth is the most important, but within industrials, a half-decade historical view may miss new industry trends or demand cycles. THOR Industries’s performance shows it grew in the past but relinquished its gains over the last two years, as its revenue fell by 3.3% annually.
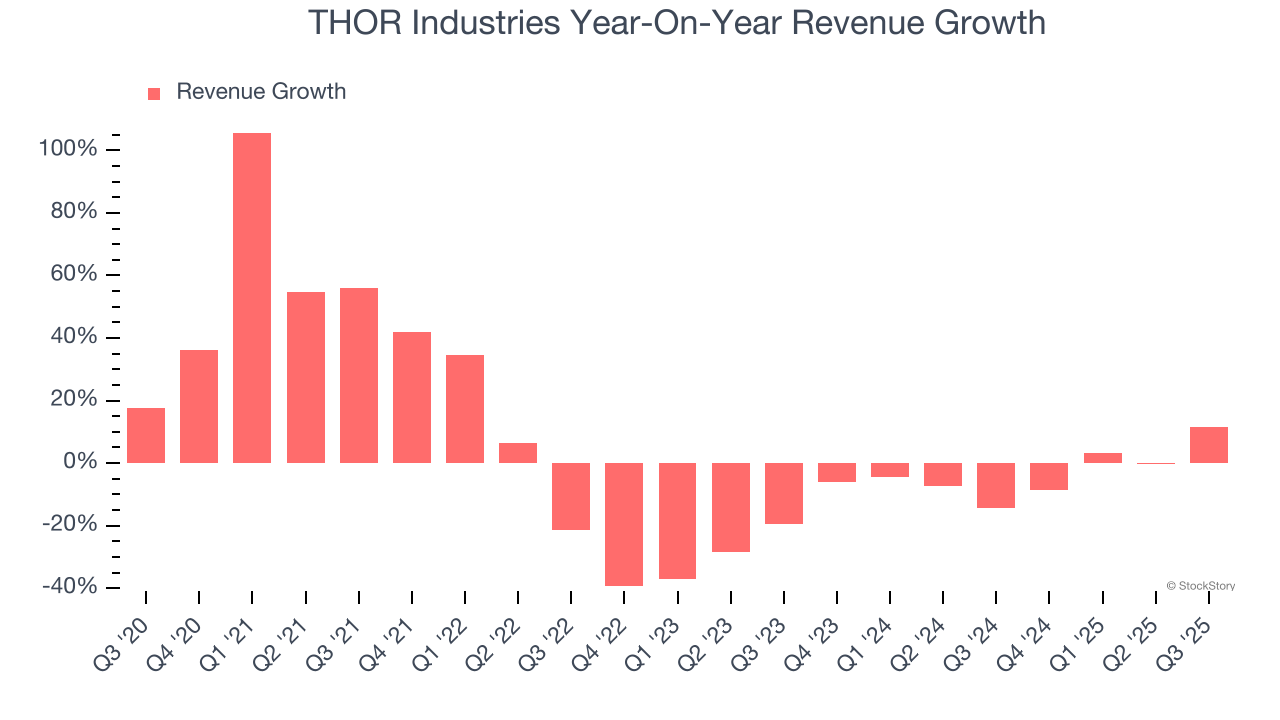
This quarter, THOR Industries reported year-on-year revenue growth of 11.5%, and its $2.39 billion of revenue exceeded Wall Street’s estimates by 15.4%.
Looking ahead, sell-side analysts expect revenue to decline by 2.2% over the next 12 months, similar to its two-year rate. Although this projection is better than its two-year trend, it’s tough to feel optimistic about a company facing demand difficulties.
Software is eating the world and there is virtually no industry left that has been untouched by it. That drives increasing demand for tools helping software developers do their jobs, whether it be monitoring critical cloud infrastructure, integrating audio and video functionality, or ensuring smooth content streaming. Click here to access a free report on our 3 favorite stocks to play this generational megatrend.
Operating margin is one of the best measures of profitability because it tells us how much money a company takes home after procuring and manufacturing its products, marketing and selling those products, and most importantly, keeping them relevant through research and development.
THOR Industries was profitable over the last five years but held back by its large cost base. Its average operating margin of 6.2% was weak for an industrials business. This result isn’t too surprising given its low gross margin as a starting point.
Looking at the trend in its profitability, THOR Industries’s operating margin decreased by 4.1 percentage points over the last five years. This raises questions about the company’s expense base because its revenue growth should have given it leverage on its fixed costs, resulting in better economies of scale and profitability. THOR Industries’s performance was poor no matter how you look at it - it shows that costs were rising and it couldn’t pass them onto its customers.
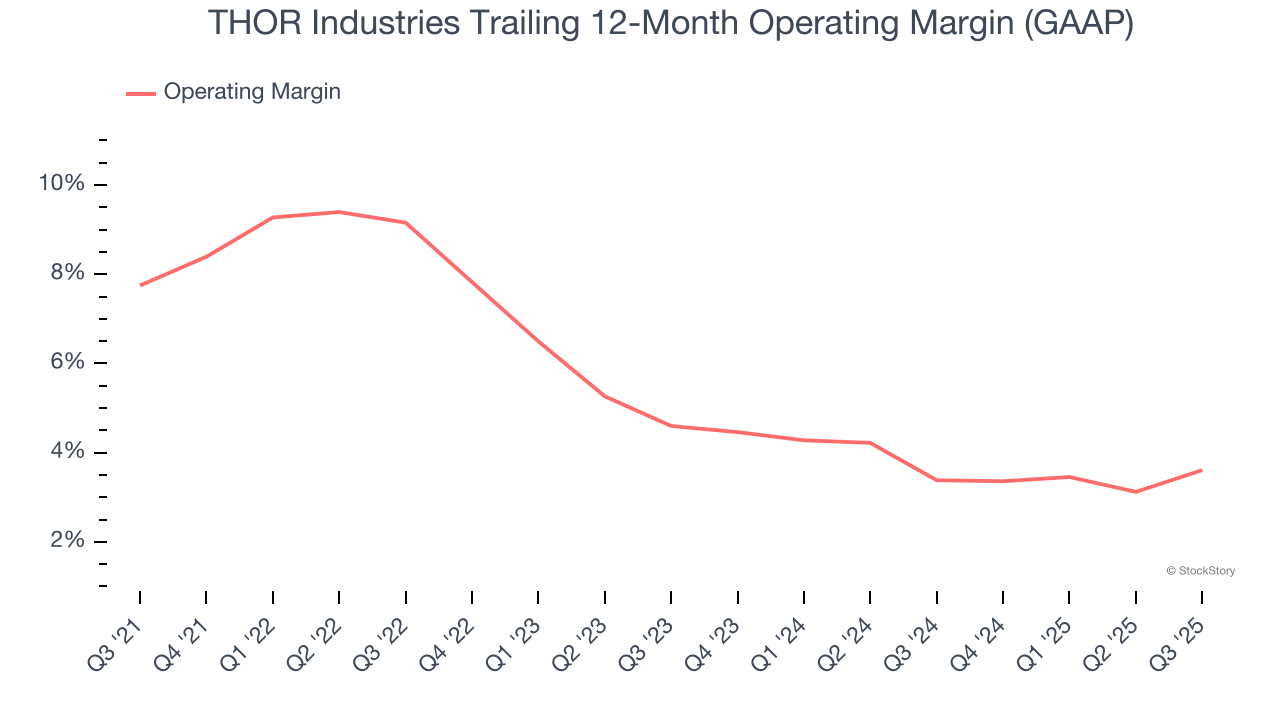
In Q3, THOR Industries generated an operating margin profit margin of 2.8%, up 2.3 percentage points year on year. The increase was encouraging, and because its operating margin rose more than its gross margin, we can infer it was more efficient with expenses such as marketing, R&D, and administrative overhead.
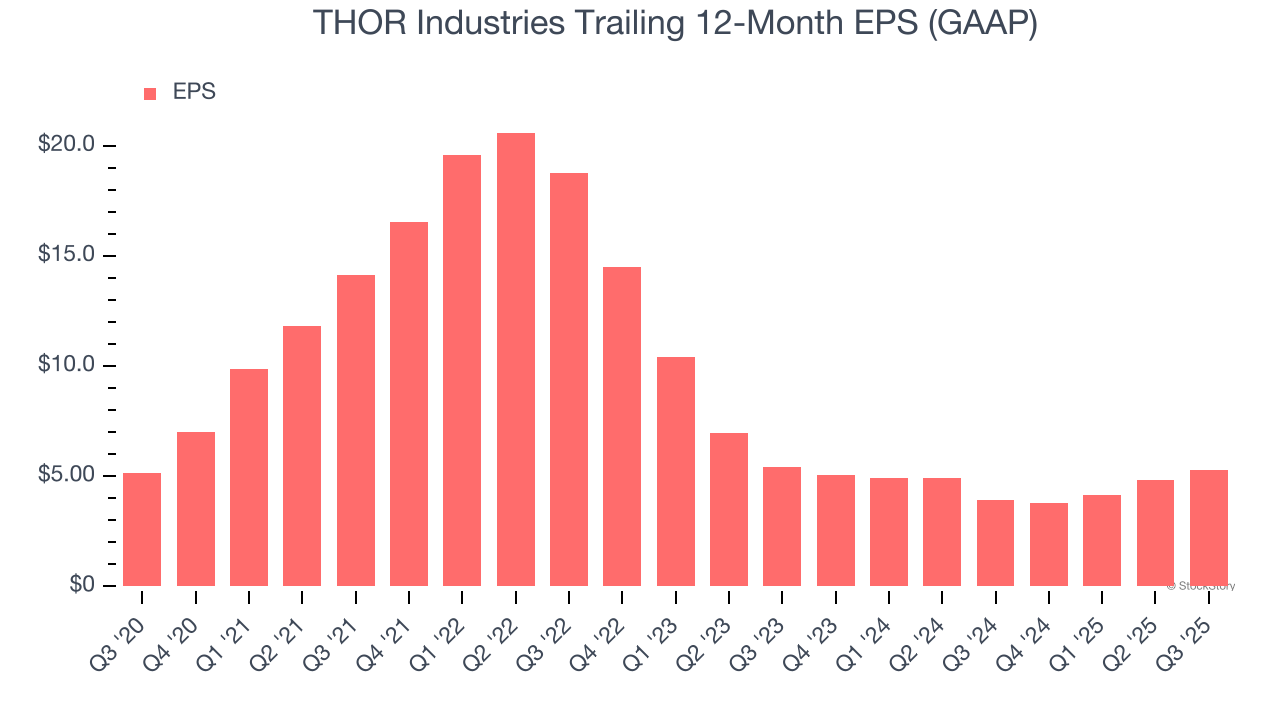
We track the long-term change in earnings per share (EPS) for the same reason as long-term revenue growth. Compared to revenue, however, EPS highlights whether a company’s growth is profitable.
THOR Industries’s flat EPS over the last five years was below its 2.8% annualized revenue growth. This tells us the company became less profitable on a per-share basis as it expanded due to non-fundamental factors such as interest expenses and taxes.
Diving into the nuances of THOR Industries’s earnings can give us a better understanding of its performance. As we mentioned earlier, THOR Industries’s operating margin expanded this quarter but declined by 4.1 percentage points over the last five years. This was the most relevant factor (aside from the revenue impact) behind its lower earnings; interest expenses and taxes can also affect EPS but don’t tell us as much about a company’s fundamentals.
Like with revenue, we analyze EPS over a shorter period to see if we are missing a change in the business.
For THOR Industries, its two-year annual EPS declines of 1.2% show its recent history was to blame for its underperformance over the last five years. These results were bad no matter how you slice the data.
In Q3, THOR Industries reported EPS of $0.41, up from negative $0.03 in the same quarter last year. This print easily cleared analysts’ estimates, and shareholders should be content with the results. Over the next 12 months, Wall Street expects THOR Industries’s full-year EPS of $5.29 to shrink by 16%.
It was good to see THOR Industries beat analysts’ EPS expectations this quarter. We were also excited its EBITDA outperformed Wall Street’s estimates by a wide margin. On the other hand, its full-year revenue guidance missed and its full-year EPS guidance fell short of Wall Street’s estimates. Overall, this print was mixed but still had some key positives. The stock traded up 1.6% to $112 immediately after reporting.
THOR Industries put up rock-solid earnings, but one quarter doesn’t necessarily make the stock a buy. Let’s see if this is a good investment. When making that decision, it’s important to consider its valuation, business qualities, as well as what has happened in the latest quarter. We cover that in our actionable full research report which you can read here, it’s free for active Edge members.
| Jun-16 | |
| Jun-03 | |
| Jun-03 | |
| Jun-03 | |
| Jun-03 | |
| May-20 | |
| Mar-31 | |
| Mar-24 | |
| Mar-10 | |
| Mar-09 | |
| Mar-04 | |
| Mar-03 | |
| Mar-03 | |
| Mar-03 | |
| Mar-03 |
Join thousands of traders who make more informed decisions with our premium features. Real-time quotes, advanced visualizations, alerts, and much more.
Learn more about Finviz Elite