|
|
|

|
|||||
|
|
|
The ratio of emerging markets to developed markets stocks has reached a historic low.
This has happened at only two other points in the past: 1988 and 2002.
In both instances, emerging markets outperformed over the next several years.
If asked to invest their money into anything right now, how many would choose the S&P 500, the Nasdaq-100, or one of the "Magnificent Seven" stocks? Odds are, quite a few! Outside of Bitcoin and gold, this is pretty much all the financial media talks about these days.
But believe it or not, there are opportunities outside of that narrow slice of the financial markets. One of the biggest outperforming groups of 2025 that may have completely slipped under your radar is international stocks.
Where to invest $1,000 right now? Our analyst team just revealed what they believe are the 10 best stocks to buy right now, when you join Stock Advisor. See the stocks »
Thanks to improving fundamentals, falling interest rates, and a weaker dollar, the iShares Core MSCI Emerging Markets ETF (NYSEMKT: IEMG) and the iShares Core MSCI EAFE ETF (NYSEMKT: IEFA) have returned 28.5% and 30.4% year to date through Dec. 16. That far outpaces the 16.9% return of the Vanguard S&P 500 ETF over the same time frame.
This trend might be far from over. In fact, if history is any guide, it could continue for the next several years.

Image source: Getty Images.
Emerging markets stocks have been underperforming developed markets and the S&P 500 consistently for the past 15 years. Save for a few short stretches over that time, emerging markets have not been able to make any sustainable progress against their counterparts.
Since the Emerging Markets ETF's inception in October 2012, the fund has generated a total return of just 85%. Over the same time, the Vanguard S&P 500 ETF has returned 485%.
But now, the performance gap may be getting too large to ignore. It's not unusual for one asset class to outperform another for several years. But 15 years of consistent outperformance is much longer than normal.
In fact, it's historically long. It's long enough that it's now triggering a signal that's flashed only twice in the past 40 years. And that could be really good news for emerging markets investors.
What we have today is an extreme divergence in relative valuations, investor positioning, and long-term expectations.
Everybody has overweighted U.S. megacap tech in their portfolios and many believe that there's more outperformance to be had. Yet, history suggests that we're in the very early innings of a major shift that makes emerging markets a leader once again and finally pushes tech stocks into the background.
The ratio of emerging markets to developed markets has only been this low twice in the past four decades: 1988 and 2002.
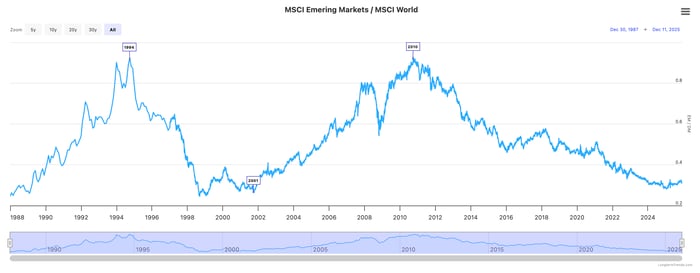
Image source: LongTermTrends.com
In the late 1980s, emerging markets were recovering from a lost decade. Multiple economies experienced a debt crisis. Inflation was high. Investors abandoned emerging markets and stayed with U.S. and developed markets, which were demonstrating much more stability and growth at the time.
The gap between emerging markets and developed markets was even more pronounced in the early 2000s. Yes, U.S. stocks were emerging from the bursting of the tech bubble, but the Asian financial crisis, which heavily impacted Thailand, South Korea, and Indonesia, was still fresh on people's minds.
In both instances, weak economic fundamentals and badly damaged investor sentiment pushed emerging markets to historically low levels relative to developed markets.
The end of the 1980s actually marked a turning point for emerging markets. Once the markets bottomed and sentiment began to improve, conditions followed. The pace of globalization began to accelerate and increased capital flows helped to support the debt markets and create opportunities for growth.
The early 2000s also marked a significant reversal of economic conditions. Industrialization started to modernize economies and increasing demand for commodities helped with expansion.
In both cases, the bottoming of the EM-to-DM ratio identified regime shifts where leadership rotated for many years. In 1998, it led to emerging markets outperforming developed markets for the next six years. In 2002, emerging markets began an eight-year stretch of outperformance.
Valuations between emerging markets and developed markets are historically wide. The Vanguard S&P 500 ETF trades at a price-to-earnings (P/E) multiple of 28. The iShares Core MSCI Emerging Markets ETF currently trades at just 17.5 times earnings. Emerging markets stocks are usually discounted relative to the S&P 500, but the gap today is especially wide, pointing to a potential value opportunity.
Macro conditions are also evolving. China has been in the midst of a real estate crisis for a few years. While there's still a lot of risk there, the government has announced plans to turn around the housing market by buying unsold properties, lowering mortgage rates, focusing on affordable housing, and providing financial incentives. Where the bottom is is still unclear, but any reversal in sentiment tends to ignite market rallies.
Overall, inflation has moderated, interest rate volatility has declined, and central banks have been lowering interest rates. More accommodative monetary conditions heading into the second half of the 2020s could make emerging markets equities look more attractive.
This doesn't necessarily mean that emerging markets outperformance is imminent, but it does look like we're near or at a bottom. And once that bottom is in place, emerging markets could be set up to lead for years. U.S. large-cap tech has led the global equity markets for years. The time for a major shift may finally be upon us.
Before you buy stock in iShares - iShares Core Msci Emerging Markets ETF, consider this:
The Motley Fool Stock Advisor analyst team just identified what they believe are the 10 best stocks for investors to buy now… and iShares - iShares Core Msci Emerging Markets ETF wasn’t one of them. The 10 stocks that made the cut could produce monster returns in the coming years.
Consider when Netflix made this list on December 17, 2004... if you invested $1,000 at the time of our recommendation, you’d have $509,039!* Or when Nvidia made this list on April 15, 2005... if you invested $1,000 at the time of our recommendation, you’d have $1,109,506!*
Now, it’s worth noting Stock Advisor’s total average return is 972% — a market-crushing outperformance compared to 193% for the S&P 500. Don't miss the latest top 10 list, available with Stock Advisor, and join an investing community built by individual investors for individual investors.
*Stock Advisor returns as of December 21, 2025.
David Dierking has no position in any of the stocks mentioned. The Motley Fool has positions in and recommends Bitcoin and Vanguard S&P 500 ETF. The Motley Fool has a disclosure policy.
| Jul-06 | |
| Jun-22 | |
| Jun-22 | |
| May-19 | |
| May-01 | |
| May-01 | |
| May-01 | |
| Apr-22 | |
| Apr-17 | |
| Mar-06 | |
| Feb-27 | |
| Feb-12 | |
| Feb-09 | |
| Feb-02 | |
| Jan-28 |
Join thousands of traders who make more informed decisions with our premium features. Real-time quotes, advanced visualizations, alerts, and much more.
Learn more about Finviz Elite