|
|
|

|
|||||
|
|
|
Albertsons Companies, Inc. ACI reported third-quarter fiscal 2025 results, wherein sales lagged the Zacks Consensus Estimate and earnings beat the same. On a year-over-year basis, the company’s top and bottom lines increased.
Solid momentum in pharmacy, loyalty and digital supported stronger sales trends and improved engagement in the third quarter. While earnings exceeded expectations, top-line results reflected continued pricing investments and a competitive backdrop, prompting investors to balance encouraging execution with a more mixed near-term outlook. As a result, shares of this leading food and drug retailer decreased 6% yesterday.
Albertsons further advanced its strategic priorities by sharpening its customer value proposition, expanding digital capabilities, embedding AI and data into core operations, and pushing productivity initiatives to offset cost pressures and fund value. Ongoing investments in technology modernization, store enhancements and shareholder returns reinforced the company’s longer-term transformation strategy, even as the consumer environment remains cautious and promotional intensity stays elevated.

Albertsons Companies, Inc. price-consensus-eps-surprise-chart | Albertsons Companies, Inc. Quote
ACI posted adjusted quarterly earnings of 72 cents per share, which beat the Zacks Consensus Estimate of 67 cents. However, the bottom line increased 1.4% from 71 cents in the prior-year period.
Net sales and other revenues of $19,123.7 million were slightly below the Zacks Consensus Estimate of $19,160 million and rose 1.9% year over year. The increase was primarily driven by a 2.4% rise in identical sales, led by 18% gain in pharmacy sales, as well as a 21% increase in digital sales in the quarter. These gains were partially offset by reduced sales related to store closures since the third quarter of fiscal 2024 and lower fuel sales.
In addition, the temporary government shutdown and delayed SNAP funding in the third quarter of fiscal 2025 have negatively impacted identical sales by 10-20 basis points.
Loyalty membership grew 12% to reach 49.8 million in the third quarter of fiscal 2025 compared with the same period in fiscal 2024.
Insight Into ACI's Q3 Margins & Expenses
The gross profit of $5.25 billion remained flat year over year. However, the gross margin for the quarter under review contracted 50 basis points (bps) year over year to 27.4% from 27.9% in the third quarter of fiscal 2024.
Excluding the impacts of fuel and LIFO expense, the gross margin decreased 55 bps from the prior-year period. The decrease in the gross margin was primarily driven by higher delivery and handling costs associated with continued digital sales growth, as well as strong growth in pharmacy sales, which carry a lower overall gross margin. In addition, the company continued to make incremental investments in its customer value proposition, funded by benefits from ongoing productivity initiatives.
In the fiscal third quarter, selling and administrative expenses increased 0.9% to $4.76 billion and declined 20 bps year over year at 24.9% as a percentage of net sales and other revenues. Excluding the impacts of fuel, selling and administrative expenses as a percentage of net sales and other revenues decreased 33 bps. This reduction was primarily attributable to the sales leveraging of employee costs and lower merger-related costs, partially offset by higher business transformation costs. Benefits from ongoing productivity initiatives continued to partially offset rising wage rates and other inflationary pressures on operating expenses.
Adjusted EBITDA declined 2.5% year over year to $1.04 million, while the adjusted EBITDA margin was 5.4%, down 30 bps year over year.
Albertsons ended the quarter with cash and cash equivalents of $195.1 million. The company’s long-term debt and finance-lease obligations totaled $8.42 billion as of Nov. 29, 2025, while total stockholders' equity amounted to $2.50 billion.
In the first 40 weeks of fiscal 2025, capital expenditure totaled $1,412.8 million, primarily reflecting the completion of 74 remodels, the opening of five stores, and continued investments in digital and technology platforms.
The company also returned $77 million to shareholders through a quarterly dividend of 15 cents per share and continued execution of its $750-million accelerated share repurchase program, which began in the prior quarter and is expected to be completed in early 2026. The benefit of this ASR is expected to accrue to EPS throughout fiscal 2026, and there remains $1.3 billion under the existing $2.75-billion authorization that can be executed upon completion of the ASR.
The net debt to adjusted EBITDA ratio ended the quarter at 2.29X, highlighting the strength of the balance sheet and capacity to fund growth while returning capital to shareholders. Additionally, the company refinanced $1.5 billion of existing indebtedness in two tranches — $700 million of 5.5% notes due 2031 and $800 million of 5.75% notes due 2034. Proceeds were used to refinance a $750-million 2026 bond maturity and repay $750 million in borrowings under the revolving credit facility, demonstrating balance sheet strength and flexibility.
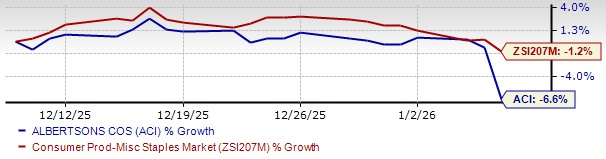
ACI Stock Past-Month Performance
The company updated its expectations for fiscal 2025 to reflect recent trends and the anticipated impacts of the Inflation Reduction Act. Identical sales growth is projected to fall between 2.2% and 2.5%, slightly narrowed from the prior mentioned 2.2-2.75%. Adjusted EBITDA is expected between $3.83 billion and $3.88 billion, a refinement from the earlier stated $3.8 billion to $3.9 billion, and this includes roughly $65 million associated with the company’s 53rd week.
Adjusted earnings per share are estimated between $2.08 and $2.16 compared with the previously stated $2.06-$2.19. Capital expenditure is expected between $1.8 billion and $1.9 billion.
These updated expectations incorporate the estimated effects of the Inflation Reduction Act’s Medicare Drug Price Negotiation Program, which took effect on Jan. 1, 2026. The program is expected to reduce pharmacy sales, resulting in an anticipated 16-18 basis point impact on fiscal year identical sales and an impact of 65-70 basis points in the fourth quarter.
Shares of this Zacks Rank #2 (Buy) company have lost 6.6% in the past month compared with the industry's decline of 1.2%.
Here, we have highlighted three other top-ranked stocks, namely, United Natural Foods, Inc. UNFI, Village Farms International Inc. VITL and US Foods Holding Corp. USFD.
United Natural is the leading distributor of natural, organic and specialty food and non-food products, currently sporting a Zacks Rank #1 (Strong Buy). You can see the complete list of today’s Zacks #1 Rank stocks here.
UNFI delivered an earnings surprise of 52.1% in the trailing four quarters, on average. The Zacks Consensus Estimate for United Natural’s current fiscal-year sales and earnings indicates growth of 1% and 187.3%, respectively, from the year-ago reported quarter.
Village Farms is a producer, marketer and distributor of greenhouse-grown tomatoes, bell peppers and cucumbers primarily in North America. It presently flaunts a Zacks Rank #1. VITL delivered a trailing four-quarter average earnings surprise of 155.6%.
The Zacks Consensus Estimate for Village Farms’ current financial-year sales and earnings indicates a decline of 27% and a surge of 165.6%, respectively, from the year-ago reported numbers.
US Foods is a foodservice distributor and currently carries a Zacks Rank #2. USFD delivered a trailing four-quarter earnings surprise of 2.5%, on average.
The Zacks Consensus Estimate for US Foods’ current fiscal-year sales and earnings indicates rallies of 4.4% and 25.1%, respectively, from the year-earlier reported levels.
Want the latest recommendations from Zacks Investment Research? Today, you can download 7 Best Stocks for the Next 30 Days. Click to get this free report
This article originally published on Zacks Investment Research (zacks.com).
| Aug-01 | |
| Jul-31 | |
| Jul-30 | |
| Jul-28 | |
| Jul-28 | |
| Jul-28 | |
| Jul-27 | |
| Jul-27 | |
| Jul-27 | |
| Jul-27 | |
| Jul-26 | |
| Jul-24 | |
| Jul-24 | |
| Jul-24 | |
| Jul-24 |
Join thousands of traders who make more informed decisions with our premium features. Real-time quotes, advanced visualizations, alerts, and much more.
Learn more about Finviz Elite