|
|
|

|
|||||
|
|
|

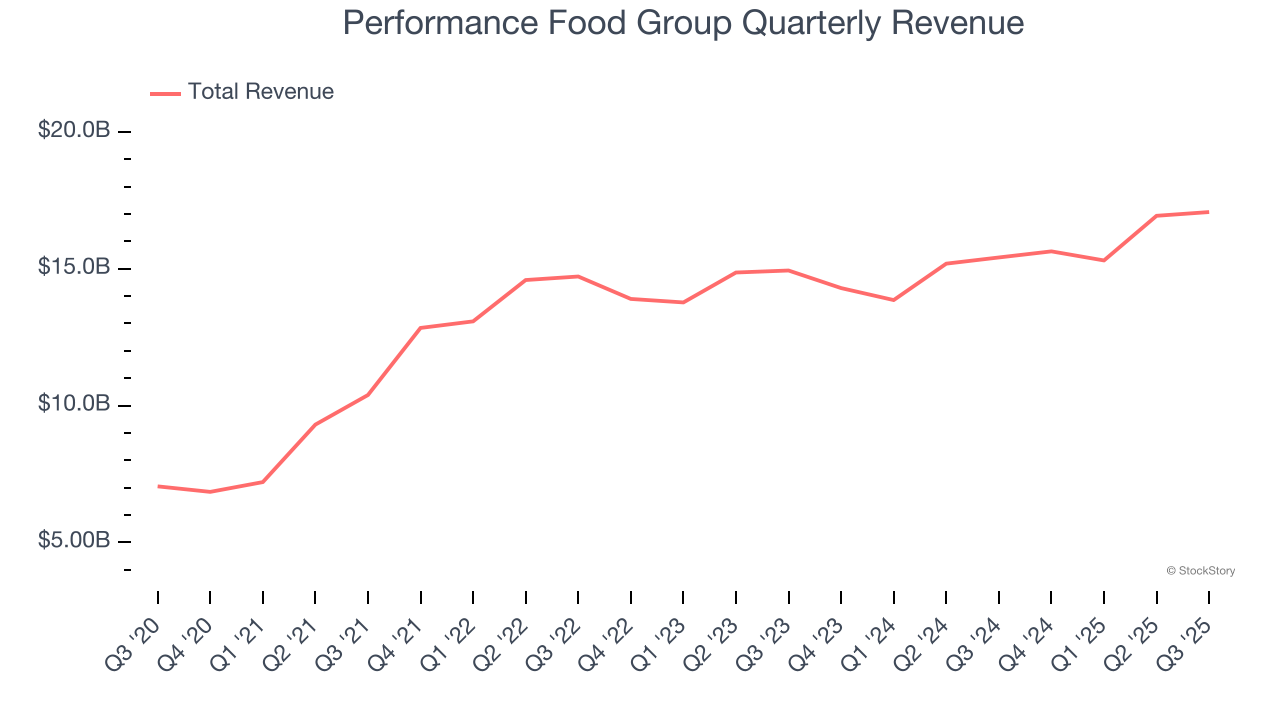
Food distribution giant Performance Food Group (NYSE:PFGC) reported Q3 CY2025 results topping the market’s revenue expectations, with sales up 10.8% year on year to $17.08 billion. The company’s full-year revenue guidance of $68 billion at the midpoint came in 1.1% above analysts’ estimates. Its non-GAAP profit of $1.18 per share was 2.3% below analysts’ consensus estimates.
Is now the time to buy Performance Food Group? Find out by accessing our full research report, it’s free.
With a massive network spanning 155 distribution centers and delivering over 250,000 different food products, Performance Food Group (NYSE:PFGC) distributes food and food-related products to over 300,000 restaurants, convenience stores, theaters, and institutions across North America.
A company’s long-term sales performance is one signal of its overall quality. Any business can put up a good quarter or two, but many enduring ones grow for years. Over the last five years, Performance Food Group grew its sales at a 20.2% annual rate. Although this growth is acceptable on an absolute basis, it fell slightly short of our standards for the consumer discretionary sector, which enjoys a number of secular tailwinds.
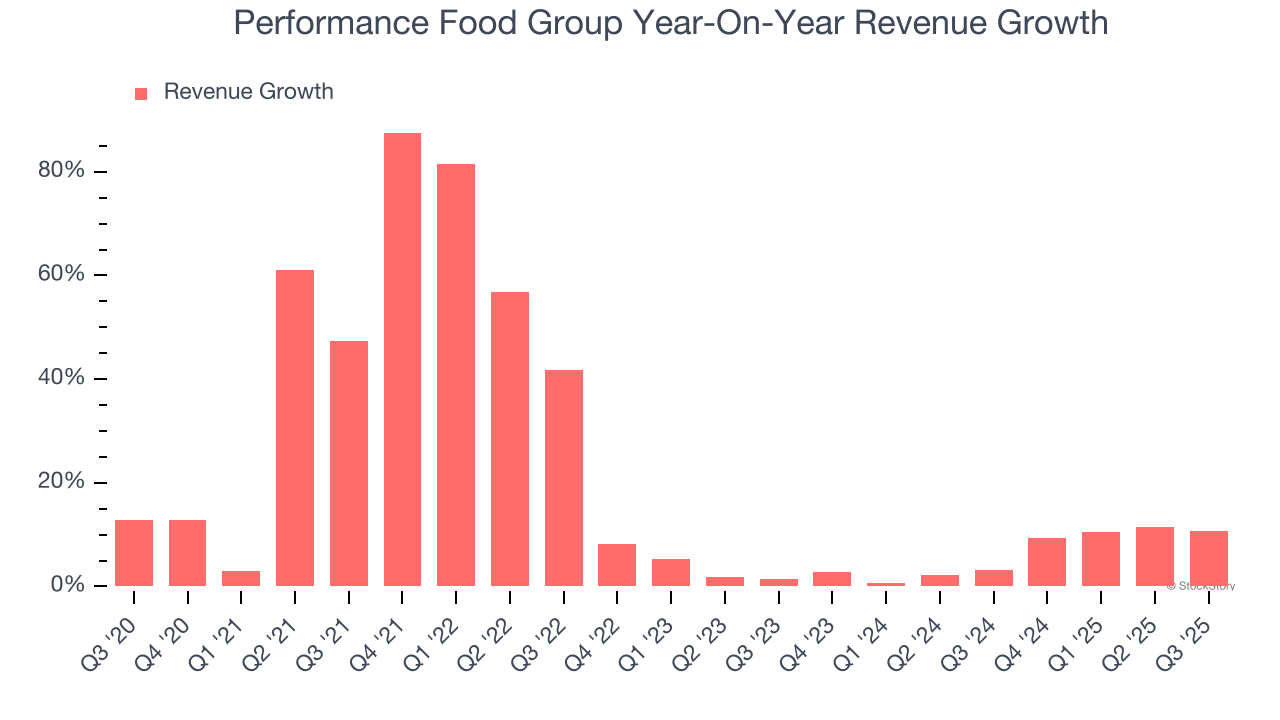
We at StockStory place the most emphasis on long-term growth, but within consumer discretionary, a stretched historical view may miss a company riding a successful new product or trend. Performance Food Group’s recent performance shows its demand has slowed as its annualized revenue growth of 6.3% over the last two years was below its five-year trend.
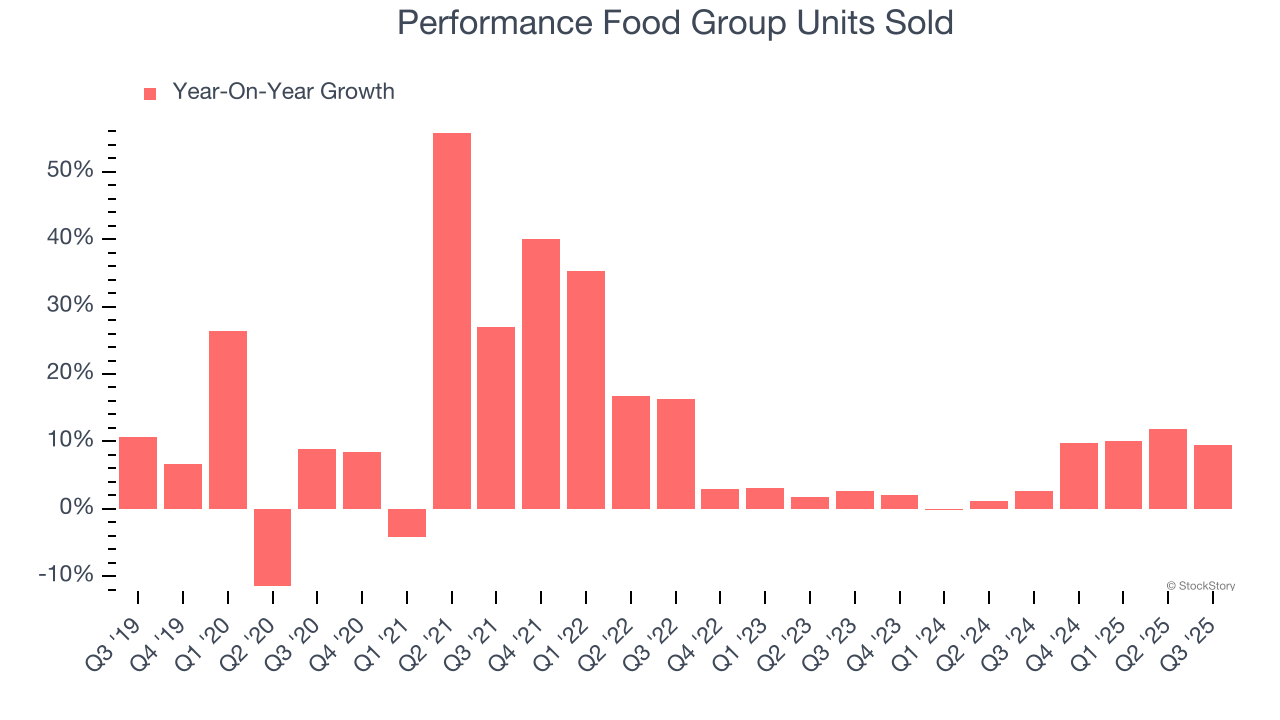
We can better understand the company’s revenue dynamics by analyzing its number of units sold. Over the last two years, Performance Food Group’s units sold averaged 5.8% year-on-year growth. Because this number is in line with its revenue growth, we can see the company kept its prices fairly consistent.
This quarter, Performance Food Group reported year-on-year revenue growth of 10.8%, and its $17.08 billion of revenue exceeded Wall Street’s estimates by 1.2%.
Looking ahead, sell-side analysts expect revenue to grow 5.7% over the next 12 months, similar to its two-year rate. This projection is underwhelming and implies its newer products and services will not lead to better top-line performance yet.
Microsoft, Alphabet, Coca-Cola, Monster Beverage—all began as under-the-radar growth stories riding a massive trend. We’ve identified the next one: a profitable AI semiconductor play Wall Street is still overlooking. Go here for access to our full report.
Operating margin is a key measure of profitability. Think of it as net income - the bottom line - excluding the impact of taxes and interest on debt, which are less connected to business fundamentals.
Performance Food Group’s operating margin might fluctuated slightly over the last 12 months but has remained more or less the same, averaging 1.3% over the last two years. This profitability was inadequate for a consumer discretionary business and caused by its suboptimal cost structure.
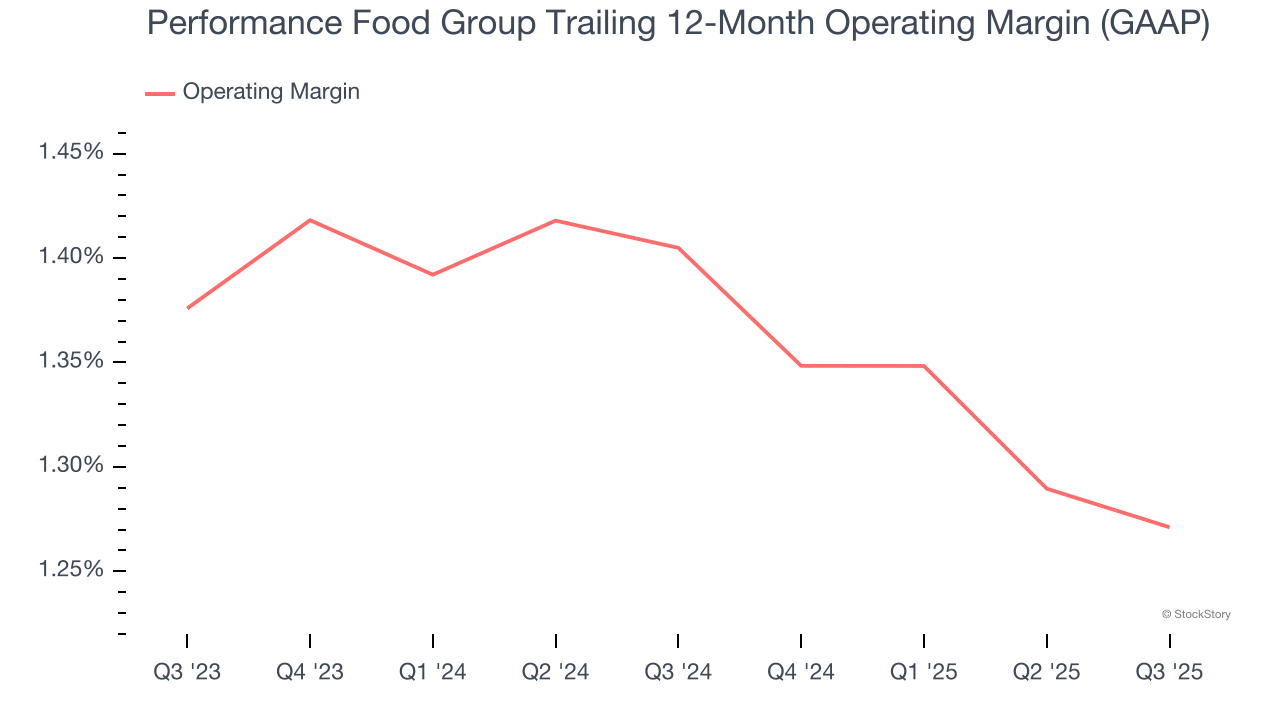
This quarter, Performance Food Group generated an operating margin profit margin of 1.3%, in line with the same quarter last year. This indicates the company’s overall cost structure has been relatively stable.
Revenue trends explain a company’s historical growth, but the long-term change in earnings per share (EPS) points to the profitability of that growth – for example, a company could inflate its sales through excessive spending on advertising and promotions.
Performance Food Group’s EPS grew at a remarkable 52.3% compounded annual growth rate over the last five years, higher than its 20.2% annualized revenue growth. However, we take this with a grain of salt because its operating margin didn’t improve and it didn’t repurchase its shares, meaning the delta came from reduced interest expenses or taxes.
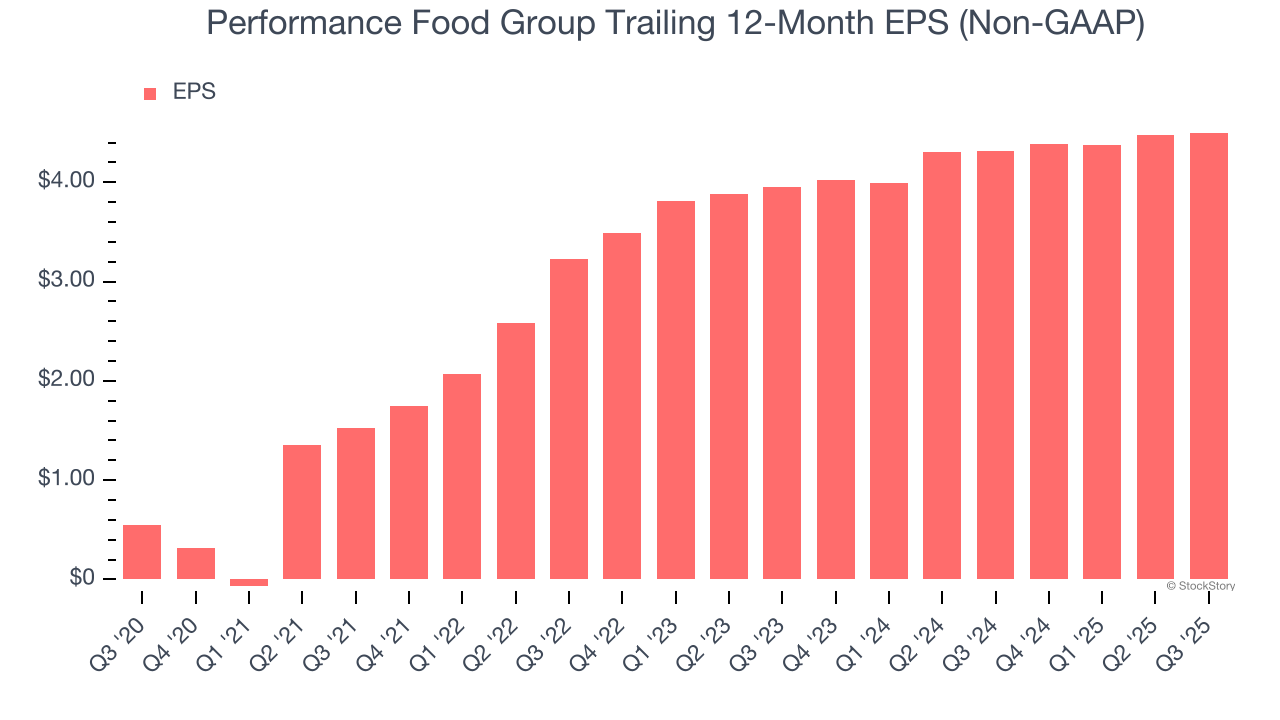
In Q3, Performance Food Group reported adjusted EPS of $1.18, up from $1.16 in the same quarter last year. Despite growing year on year, this print missed analysts’ estimates, but we care more about long-term adjusted EPS growth than short-term movements. Over the next 12 months, Wall Street expects Performance Food Group’s full-year EPS of $4.50 to grow 15.5%.
It was good to see Performance Food Group provide full-year revenue guidance that slightly beat analysts’ expectations. We were also happy its revenue narrowly outperformed Wall Street’s estimates. On the other hand, its EPS missed and its full-year EBITDA guidance fell slightly short of Wall Street’s estimates. Zooming out, we think this was a mixed quarter. The stock remained flat at $96.84 immediately following the results.
So should you invest in Performance Food Group right now? We think that the latest quarter is only one piece of the longer-term business quality puzzle. Quality, when combined with valuation, can help determine if the stock is a buy. We cover that in our actionable full research report which you can read here (it’s free).
| Jul-07 | |
| May-06 | |
| May-06 | |
| May-06 | |
| Apr-22 | |
| Feb-24 | |
| Feb-11 | |
| Feb-10 | |
| Feb-09 | |
| Feb-09 | |
| Feb-05 | |
| Feb-05 | |
| Feb-04 | |
| Feb-04 | |
| Feb-04 |
Join thousands of traders who make more informed decisions with our premium features. Real-time quotes, advanced visualizations, alerts, and much more.
Learn more about Finviz Elite