|
|
|

|
|||||
|
|
|
Aerospace and defense company General Dynamics (NYSE:GD) beat Wall Street’s revenue expectations in Q4 CY2025, with sales up 7.8% year on year to $14.38 billion. Its GAAP profit of $4.17 per share was 1.5% above analysts’ consensus estimates.
Is now the time to buy General Dynamics? Find out by accessing our full research report, it’s free.
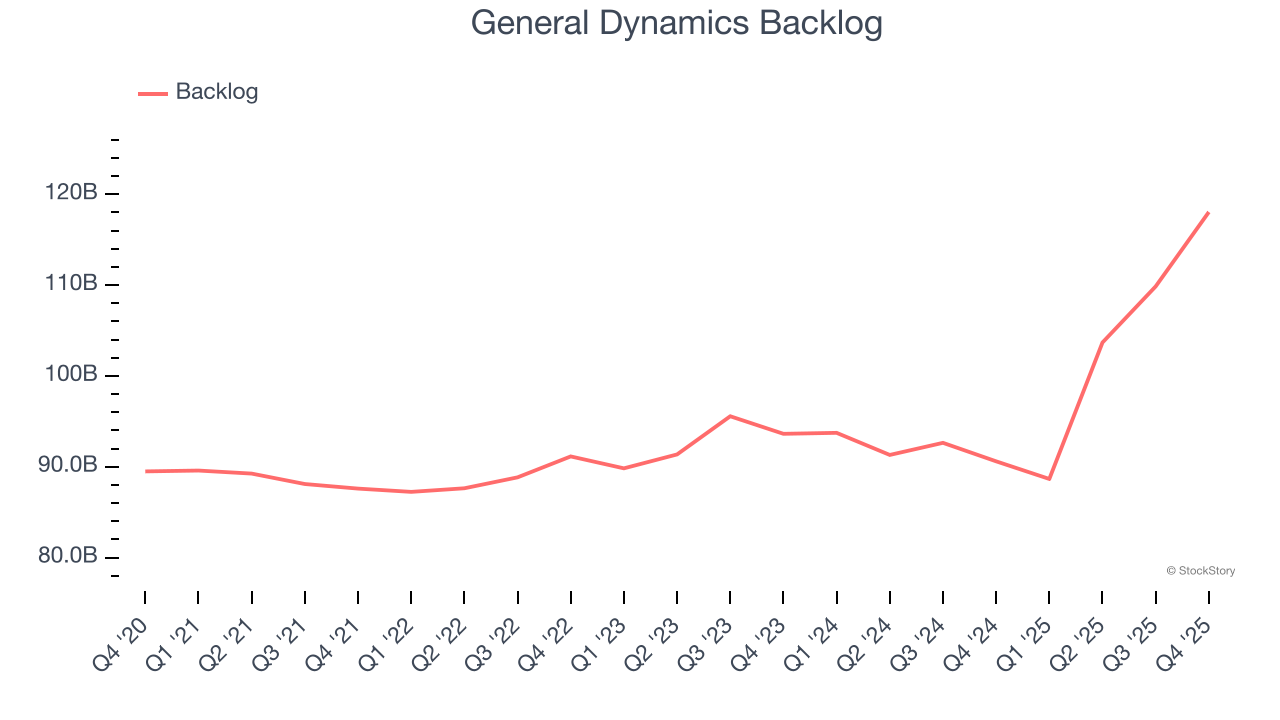
"We had a solid fourth quarter, capping off a year that saw growth in revenue and earnings in all four segments coupled with an impressive 30% growth in company-wide backlog," said Phebe N. Novakovic, chairman and chief executive officer.
Creator of the famous M1 Abrahms tank, General Dynamics (NYSE:GD) develops aerospace, marine systems, combat systems, and information technology products.
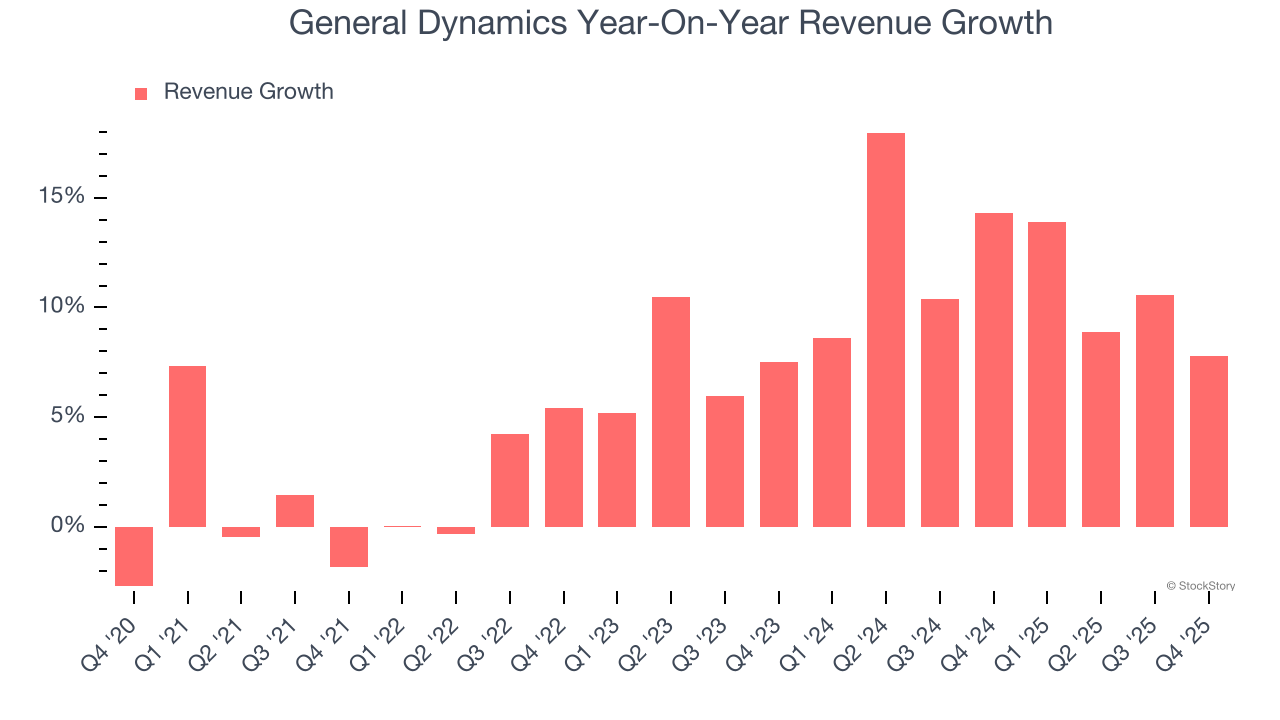
A company’s long-term performance is an indicator of its overall quality. Even a bad business can shine for one or two quarters, but a top-tier one grows for years. Regrettably, General Dynamics’s sales grew at a mediocre 6.7% compounded annual growth rate over the last five years. This was below our standard for the industrials sector and is a poor baseline for our analysis.
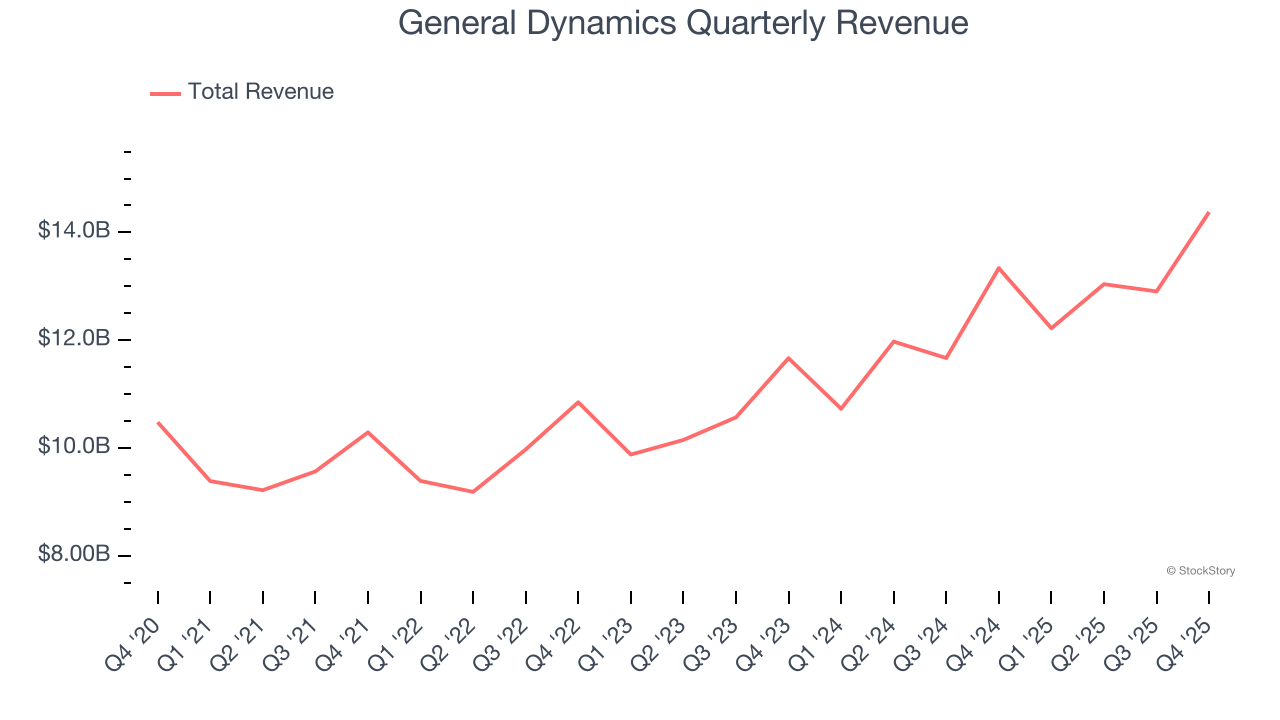
We at StockStory place the most emphasis on long-term growth, but within industrials, a half-decade historical view may miss cycles, industry trends, or a company capitalizing on catalysts such as a new contract win or a successful product line. General Dynamics’s annualized revenue growth of 11.5% over the last two years is above its five-year trend, suggesting its demand recently accelerated.
We can dig further into the company’s revenue dynamics by analyzing its backlog, or the value of its outstanding orders that have not yet been executed or delivered. General Dynamics’s backlog reached $118 billion in the latest quarter and averaged 6.9% year-on-year growth over the last two years. Because this number is lower than its revenue growth, we can see the company fulfilled orders at a faster rate than it added new orders to the backlog. This implies General Dynamics was operating efficiently but raises questions about the health of its sales pipeline.
This quarter, General Dynamics reported year-on-year revenue growth of 7.8%, and its $14.38 billion of revenue exceeded Wall Street’s estimates by 4.1%.
Looking ahead, sell-side analysts expect revenue to grow 3.6% over the next 12 months, a deceleration versus the last two years. This projection doesn't excite us and indicates its products and services will face some demand challenges.
The 1999 book Gorilla Game predicted Microsoft and Apple would dominate tech before it happened. Its thesis? Identify the platform winners early. Today, enterprise software companies embedding generative AI are becoming the new gorillas. a profitable, fast-growing enterprise software stock that is already riding the automation wave and looking to catch the generative AI next.
Operating margin is a key measure of profitability. Think of it as net income - the bottom line - excluding the impact of taxes and interest on debt, which are less connected to business fundamentals.
General Dynamics’s operating margin might fluctuated slightly over the last 12 months but has generally stayed the same, averaging 10.3% over the last five years. This profitability was solid for an industrials business and shows it’s an efficient company that manages its expenses well.
Analyzing the trend in its profitability, General Dynamics’s operating margin might fluctuated slightly but has generally stayed the same over the last five years. This raises questions about the company’s expense base because its revenue growth should have given it leverage on its fixed costs, resulting in better economies of scale and profitability.
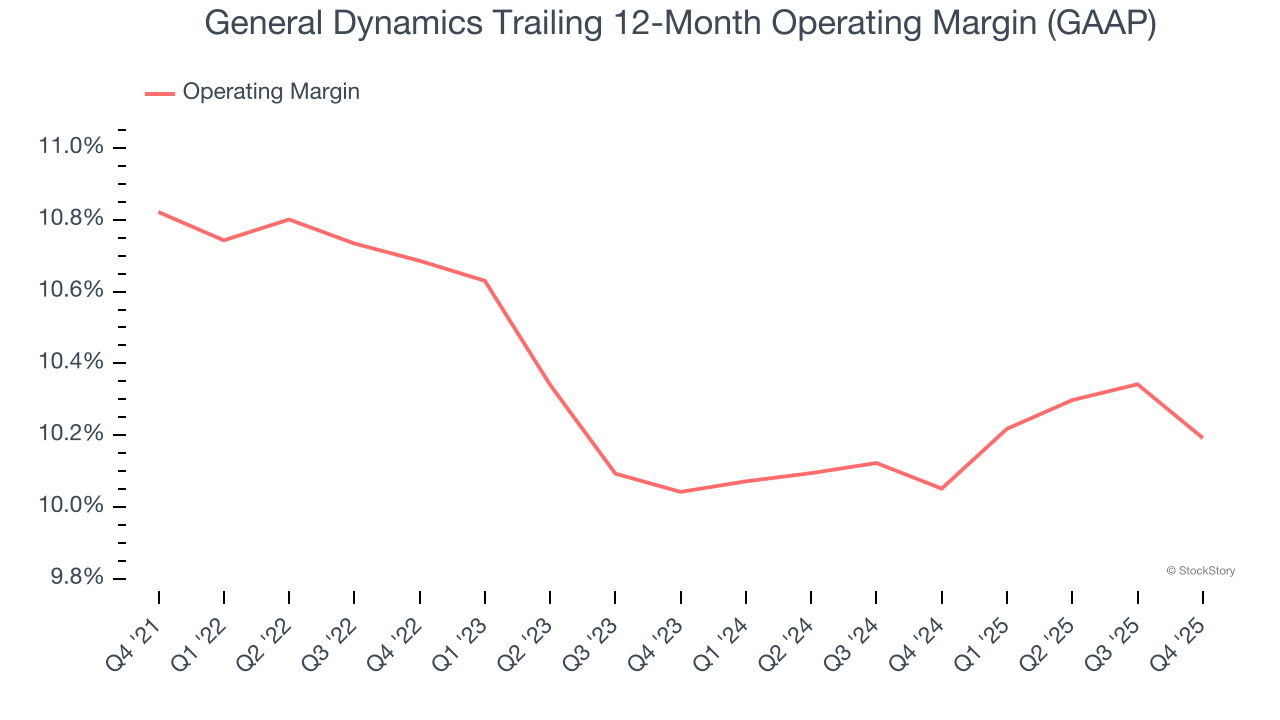
In Q4, General Dynamics generated an operating margin profit margin of 10.1%, in line with the same quarter last year. This indicates the company’s overall cost structure has been relatively stable.
We track the long-term change in earnings per share (EPS) for the same reason as long-term revenue growth. Compared to revenue, however, EPS highlights whether a company’s growth is profitable.
General Dynamics’s unimpressive 7% annual EPS growth over the last five years aligns with its revenue performance. This tells us it maintained its per-share profitability as it expanded.
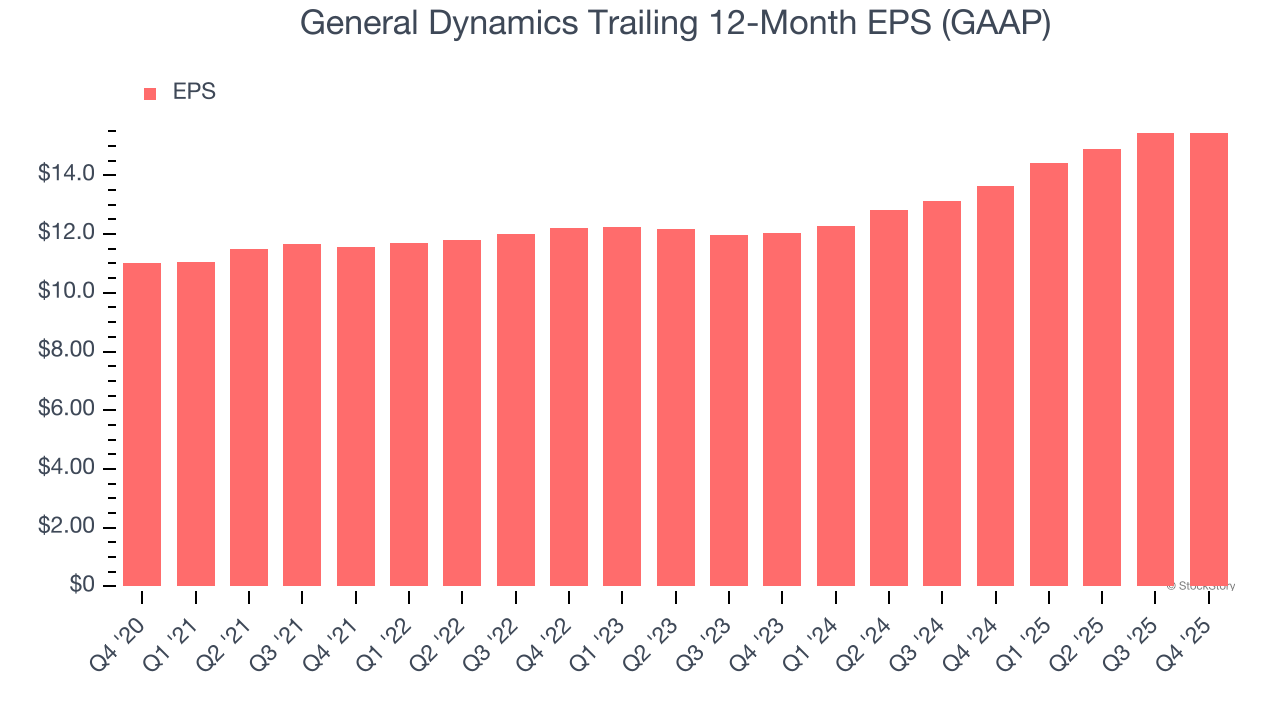
Like with revenue, we analyze EPS over a more recent period because it can provide insight into an emerging theme or development for the business.
For General Dynamics, its two-year annual EPS growth of 13.3% was higher than its five-year trend. This acceleration made it one of the faster-growing industrials companies in recent history.
In Q4, General Dynamics reported EPS of $4.17, up from $4.15 in the same quarter last year. This print beat analysts’ estimates by 1.5%. Over the next 12 months, Wall Street expects General Dynamics’s full-year EPS of $15.45 to grow 11.5%.
We were impressed by how significantly General Dynamics blew past analysts’ backlog expectations this quarter. We were also excited its revenue outperformed Wall Street’s estimates by a wide margin. Zooming out, we think this quarter featured some important positives. The stock remained flat at $366.49 immediately following the results.
Is General Dynamics an attractive investment opportunity at the current price? If you’re making that decision, you should consider the bigger picture of valuation, business qualities, as well as the latest earnings. We cover that in our actionable full research report which you can read here (it’s free).
| Apr-02 | |
| Apr-01 | |
| Mar-30 | |
| Mar-23 | |
| Mar-23 | |
| Mar-20 | |
| Mar-19 |
Defense Stocks Show Clear Winners, Losers Amid Ongoing U.S.-Iran Conflict
GD
Investor's Business Daily
|
| Mar-19 | |
| Mar-17 | |
| Mar-14 | |
| Mar-11 | |
| Mar-10 | |
| Mar-10 | |
| Mar-10 | |
| Mar-10 |
Join thousands of traders who make more informed decisions with our premium features. Real-time quotes, advanced visualizations, alerts, and much more.
Learn more about Finviz Elite