|
|
|

|
|||||
|
|
|

Energy transition company GE Vernova (NYSE:GEV) reported revenue ahead of Wall Streets expectations in Q4 CY2025, with sales up 3.8% year on year to $10.96 billion. The company’s full-year revenue guidance of $44.5 billion at the midpoint came in 6.3% above analysts’ estimates. Its GAAP profit of $13.39 per share was significantly above analysts’ consensus estimates.
Is now the time to buy GE Vernova? Find out by accessing our full research report, it’s free.
Born from the energy business of industrial giant General Electric in a 2023 spin-off, GE Vernova (NYSE:GEV) designs, manufactures, and services power generation equipment and grid technologies to help customers build more reliable and sustainable electric systems.
Examining a company’s long-term performance can provide clues about its quality. Any business can put up a good quarter or two, but many enduring ones grow for years. Unfortunately, GE Vernova’s 3.6% annualized revenue growth over the last four years was sluggish. This wasn’t a great result compared to the rest of the industrials sector, but there are still things to like about GE Vernova.
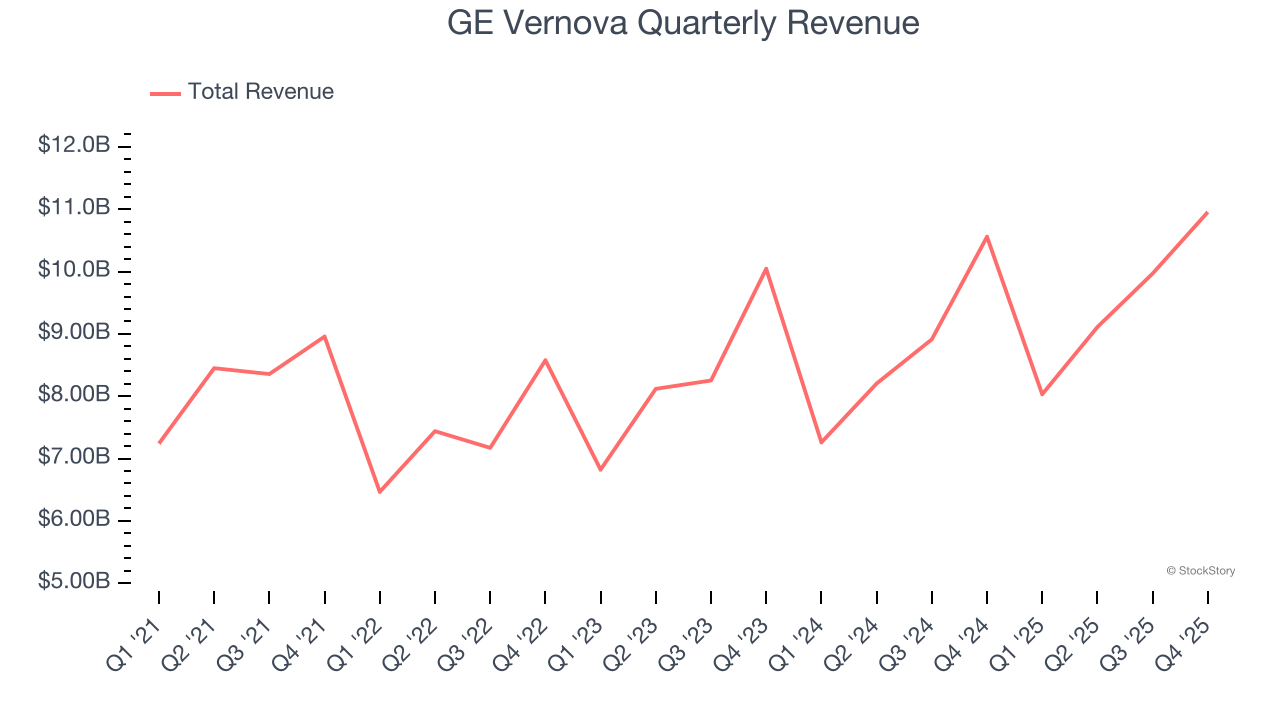
Long-term growth is the most important, but within industrials, a stretched historical view may miss new industry trends or demand cycles. GE Vernova’s annualized revenue growth of 7% over the last two years is above its four-year trend, but we were still disappointed by the results.
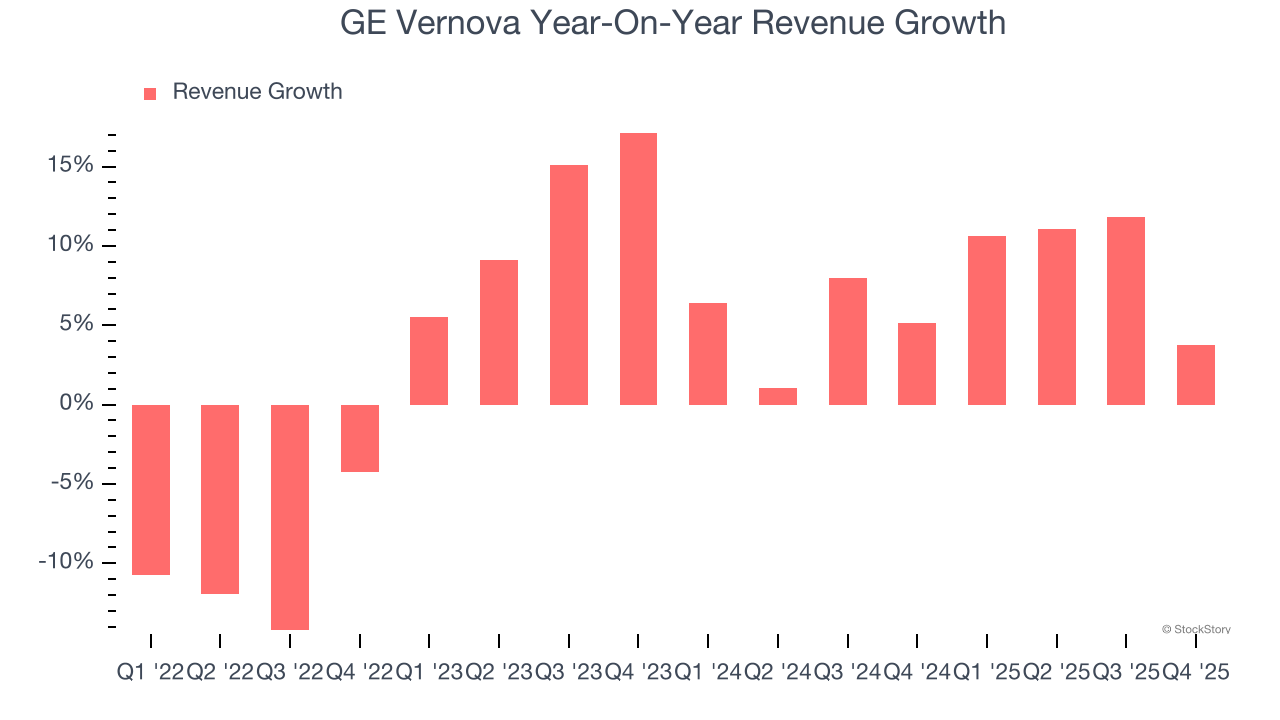
This quarter, GE Vernova reported modest year-on-year revenue growth of 3.8% but beat Wall Street’s estimates by 6.5%.
Looking ahead, sell-side analysts expect revenue to grow 10.7% over the next 12 months, an improvement versus the last two years. This projection is particularly healthy for a company of its scale and suggests its newer products and services will spur better top-line performance.
While Wall Street chases Nvidia at all-time highs, an under-the-radar semiconductor supplier is dominating a critical AI component these giants can’t build without. Click here to access our free report one of our favorites growth stories.
Operating margin is one of the best measures of profitability because it tells us how much money a company takes home after procuring and manufacturing its products, marketing and selling those products, and most importantly, keeping them relevant through research and development.
Although GE Vernova was profitable this quarter from an operational perspective, it’s generally struggled over a longer time period. Its expensive cost structure has contributed to an average operating margin of negative 1.4% over the last four years. Unprofitable industrials companies require extra attention because they could get caught swimming naked when the tide goes out.
On the plus side, GE Vernova’s operating margin rose by 13.4 percentage points over the last four years, as its sales growth gave it operating leverage. Still, it will take much more for the company to show consistent profitability.
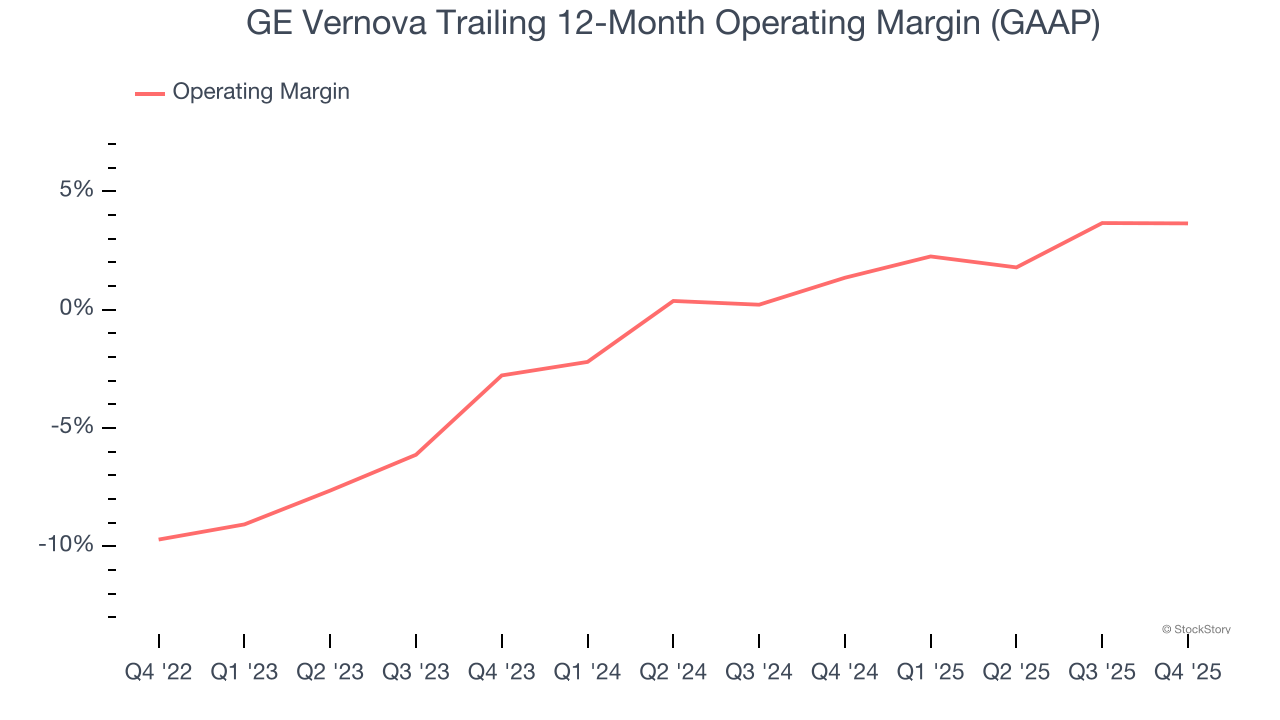
In Q4, GE Vernova generated an operating margin profit margin of 5.5%, in line with the same quarter last year. This indicates the company’s cost structure has recently been stable.
Revenue trends explain a company’s historical growth, but the long-term change in earnings per share (EPS) points to the profitability of that growth – for example, a company could inflate its sales through excessive spending on advertising and promotions.
GE Vernova’s full-year EPS flipped from negative to positive over the last four years. This is encouraging and shows it’s at a critical moment in its life.
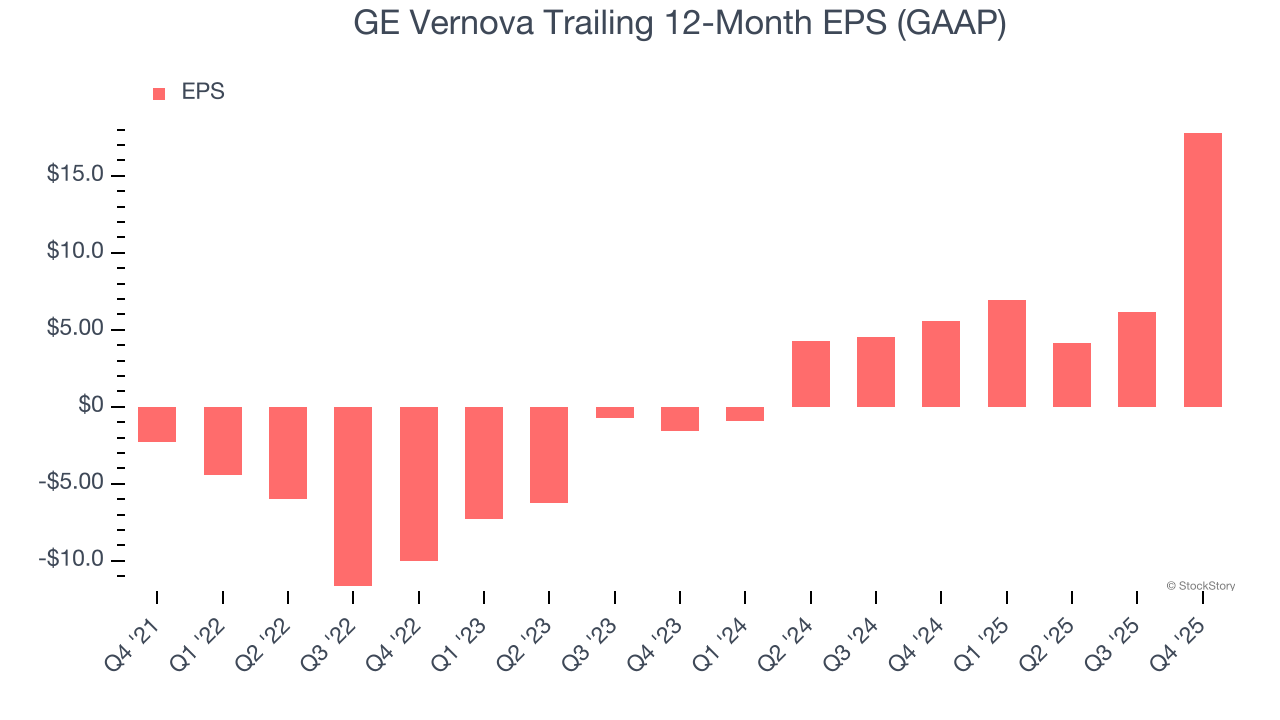
Like with revenue, we analyze EPS over a more recent period because it can provide insight into an emerging theme or development for the business.
For GE Vernova, its two-year annual EPS growth of 263% was higher than its four-year trend. We love it when earnings growth accelerates, especially when it accelerates off an already high base.
In Q4, GE Vernova reported EPS of $13.39, up from $1.73 in the same quarter last year partly due to a $2.9 billion tax benefit due to a U.S. valuation allowance release. This print easily cleared analysts’ estimates, and shareholders should be content with the results. Over the next 12 months, Wall Street expects GE Vernova’s full-year EPS of $17.81 to shrink by 23.3%.
It was good to see GE Vernova beat analysts’ revenue expectations this quarter. While EPS beat significantly, we note that this was partly due to a $2.9 billion tax benefit due to a U.S. valuation allowance release. The stock traded up 2.9% to $713.10 immediately following the results.
Is GE Vernova an attractive investment opportunity right now? We think that the latest quarter is only one piece of the longer-term business quality puzzle. Quality, when combined with valuation, can help determine if the stock is a buy. We cover that in our actionable full research report which you can read here (it’s free).
| Apr-01 | |
| Apr-01 | |
| Apr-01 | |
| Apr-01 | |
| Mar-31 | |
| Mar-25 | |
| Mar-25 | |
| Mar-25 | |
| Mar-25 | |
| Mar-24 | |
| Mar-23 | |
| Mar-23 | |
| Mar-23 | |
| Mar-20 | |
| Mar-20 |
Join thousands of traders who make more informed decisions with our premium features. Real-time quotes, advanced visualizations, alerts, and much more.
Learn more about Finviz Elite