|
|
|

|
|||||
|
|
|

Electrical connector manufacturer Amphenol (NYSE:APH) reported Q4 CY2025 results topping the market’s revenue expectations, with sales up 49.1% year on year to $6.44 billion. On top of that, next quarter’s revenue guidance ($6.95 billion at the midpoint) was surprisingly good and 3.5% above what analysts were expecting. Its non-GAAP profit of $0.97 per share was 3.1% above analysts’ consensus estimates.
Is now the time to buy Amphenol? Find out by accessing our full research report, it’s free.
“We are pleased to have closed 2025 with record fourth quarter and full-year sales and Adjusted Diluted EPS, both significantly exceeding the high end of our guidance,” said Amphenol President and Chief Executive Officer, R. Adam Norwitt.
With over 90 years of connecting the world's technologies, Amphenol (NYSE:APH) designs and manufactures connectors, cables, sensors, and interconnect systems that enable electrical and electronic connections across virtually every industry.
A company’s long-term sales performance is one signal of its overall quality. Even a bad business can shine for one or two quarters, but a top-tier one grows for years.
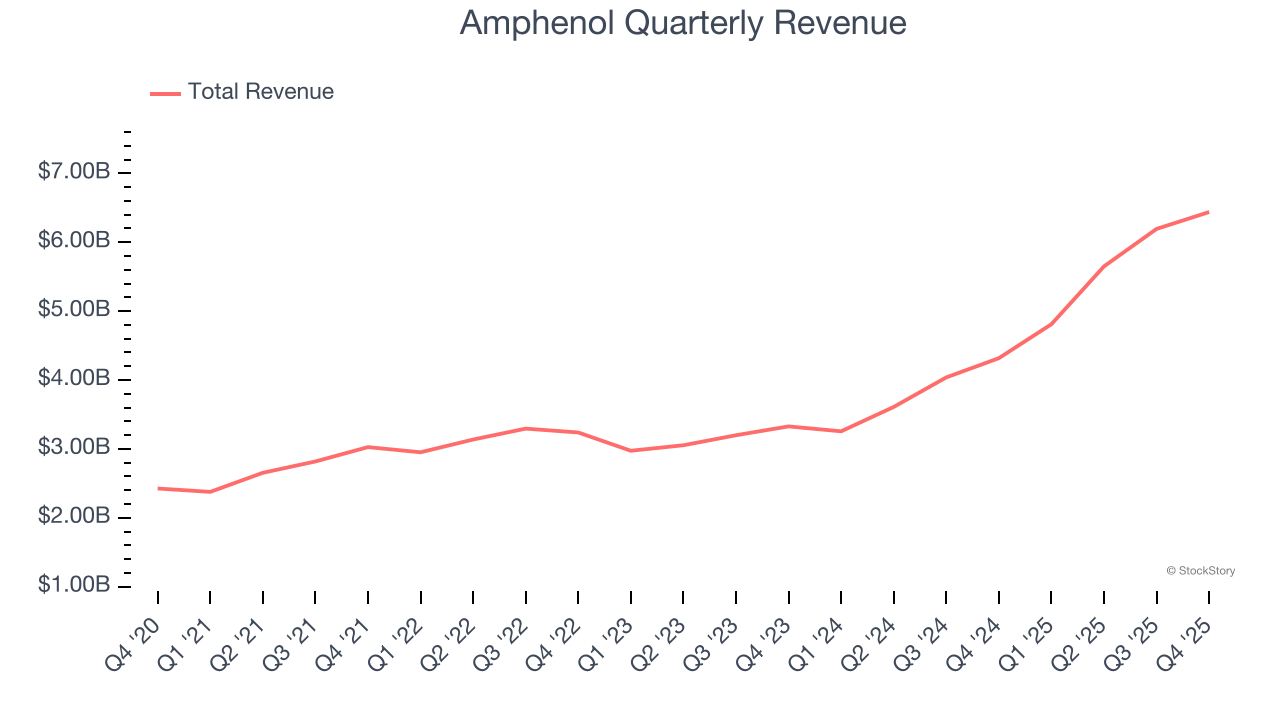
With $23.09 billion in revenue over the past 12 months, Amphenol is a behemoth in the business services sector and benefits from economies of scale, giving it an edge in distribution. This also enables it to gain more leverage on its fixed costs than smaller competitors and the flexibility to offer lower prices.
As you can see below, Amphenol’s sales grew at an incredible 21.8% compounded annual growth rate over the last five years. This is a great starting point for our analysis because it shows Amphenol’s demand was higher than many business services companies.
Long-term growth is the most important, but within business services, a half-decade historical view may miss new innovations or demand cycles. Amphenol’s annualized revenue growth of 35.6% over the last two years is above its five-year trend, suggesting its demand was strong and recently accelerated.
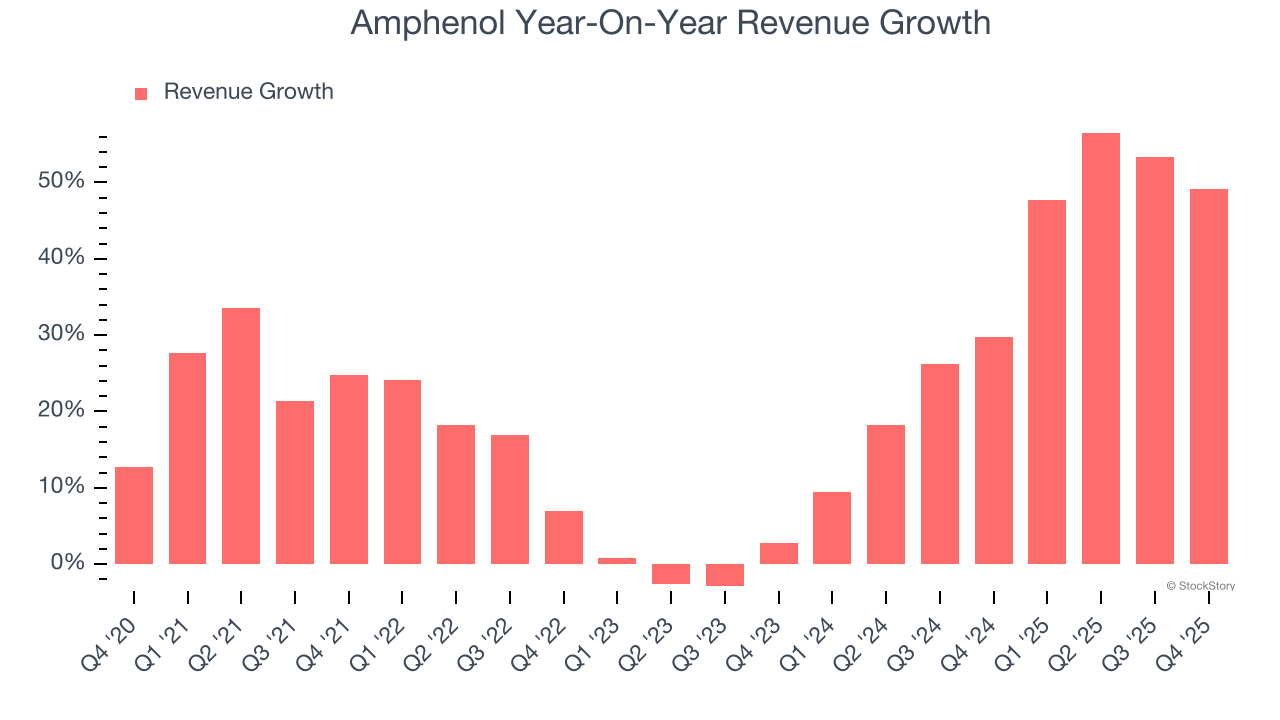
This quarter, Amphenol reported magnificent year-on-year revenue growth of 49.1%, and its $6.44 billion of revenue beat Wall Street’s estimates by 3.3%. Company management is currently guiding for a 44.5% year-on-year increase in sales next quarter.
Looking further ahead, sell-side analysts expect revenue to grow 30.7% over the next 12 months, a deceleration versus the last two years. Still, this projection is eye-popping given its scale and suggests the market sees success for its products and services.
The 1999 book Gorilla Game predicted Microsoft and Apple would dominate tech before it happened. Its thesis? Identify the platform winners early. Today, enterprise software companies embedding generative AI are becoming the new gorillas. a profitable, fast-growing enterprise software stock that is already riding the automation wave and looking to catch the generative AI next.
Operating margin is an important measure of profitability as it shows the portion of revenue left after accounting for all core expenses – everything from the cost of goods sold to advertising and wages. It’s also useful for comparing profitability across companies with different levels of debt and tax rates because it excludes interest and taxes.
Amphenol has been a well-oiled machine over the last five years. It demonstrated elite profitability for a business services business, boasting an average operating margin of 21.9%.
Looking at the trend in its profitability, Amphenol’s operating margin rose by 6.1 percentage points over the last five years, as its sales growth gave it immense operating leverage.
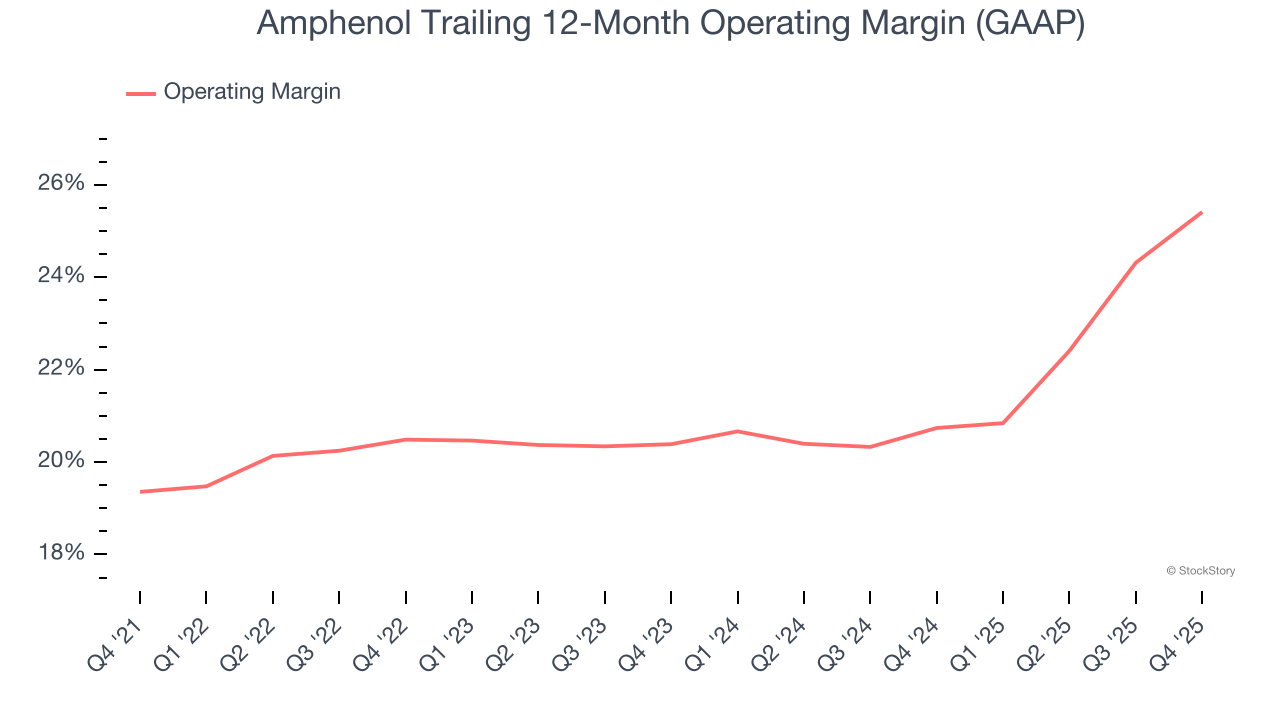
In Q4, Amphenol generated an operating margin profit margin of 26.8%, up 4.7 percentage points year on year. This increase was a welcome development and shows it was more efficient.
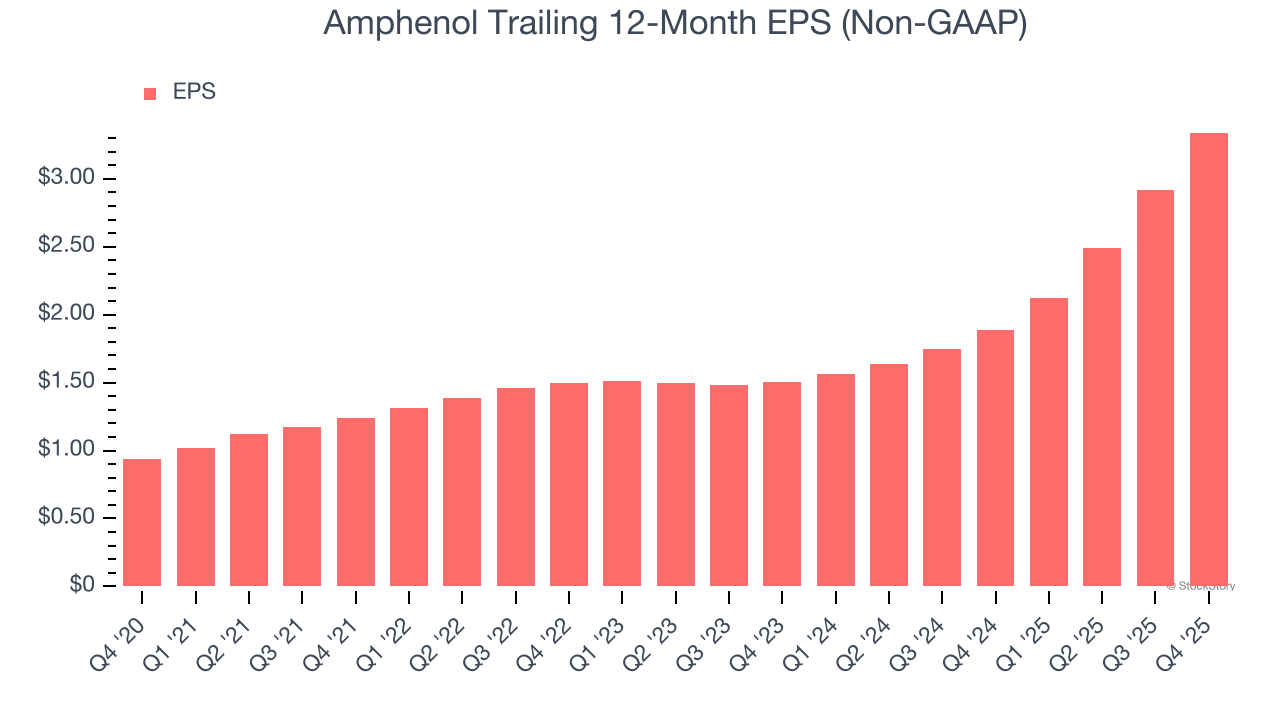
We track the long-term change in earnings per share (EPS) for the same reason as long-term revenue growth. Compared to revenue, however, EPS highlights whether a company’s growth is profitable.
Amphenol’s EPS grew at an astounding 29% compounded annual growth rate over the last five years, higher than its 21.8% annualized revenue growth. This tells us the company became more profitable on a per-share basis as it expanded.
We can take a deeper look into Amphenol’s earnings to better understand the drivers of its performance. As we mentioned earlier, Amphenol’s operating margin expanded by 6.1 percentage points over the last five years. This was the most relevant factor (aside from the revenue impact) behind its higher earnings; interest expenses and taxes can also affect EPS but don’t tell us as much about a company’s fundamentals.
Like with revenue, we analyze EPS over a shorter period to see if we are missing a change in the business.
For Amphenol, its two-year annual EPS growth of 49% was higher than its five-year trend. We love it when earnings growth accelerates, especially when it accelerates off an already high base.
In Q4, Amphenol reported adjusted EPS of $0.97, up from $0.55 in the same quarter last year. This print beat analysts’ estimates by 3.1%. Over the next 12 months, Wall Street expects Amphenol’s full-year EPS of $3.34 to grow 28.2%.
We were impressed by Amphenol’s optimistic revenue guidance for next quarter, which blew past analysts’ expectations. EPS guidance also impressed. Additionally, we were glad its revenue outperformed Wall Street’s estimates, leading to an EPS beat in the quarter. Zooming out, we think this quarter featured many important positives. Still, shares traded down 13.3% to $144.85 immediately following the results.
Is Amphenol an attractive investment opportunity right now? What happened in the latest quarter matters, but not as much as longer-term business quality and valuation, when deciding whether to invest in this stock. We cover that in our actionable full research report which you can read here (it’s free).
| Apr-22 | |
| Apr-17 | |
| Apr-14 | |
| Apr-07 | |
| Apr-01 | |
| Mar-24 | |
| Mar-17 | |
| Mar-10 | |
| Mar-09 | |
| Mar-09 | |
| Mar-06 | |
| Mar-06 | |
| Mar-06 | |
| Mar-05 | |
| Mar-04 |
Join thousands of traders who make more informed decisions with our premium features. Real-time quotes, advanced visualizations, alerts, and much more.
Learn more about Finviz Elite