|
|
|

|
|||||
|
|
|

Server solutions provider Super Micro (NASDAQ:SMCI) reported Q4 CY2025 results exceeding the market’s revenue expectations, with sales up 123% year on year to $12.68 billion. On top of that, next quarter’s revenue guidance ($12.3 billion at the midpoint) was surprisingly good and 20.5% above what analysts were expecting. Its non-GAAP profit of $0.69 per share was 41.4% above analysts’ consensus estimates.
Is now the time to buy Super Micro? Find out by accessing our full research report, it’s free.
Founded in Silicon Valley in 1993 and known for its modular "building block" approach to server design, Super Micro Computer (NASDAQ:SMCI) designs and manufactures high-performance, energy-efficient server and storage systems for data centers, cloud computing, AI, and edge computing applications.
Examining a company’s long-term performance can provide clues about its quality. Even a bad business can shine for one or two quarters, but a top-tier one grows for years.
With $28.06 billion in revenue over the past 12 months, Super Micro is a behemoth in the business services sector and benefits from economies of scale, giving it an edge in distribution. This also enables it to gain more leverage on its fixed costs than smaller competitors and the flexibility to offer lower prices.
As you can see below, Super Micro’s 53.8% annualized revenue growth over the last five years was incredible. This is a great starting point for our analysis because it shows Super Micro’s demand was higher than many business services companies.
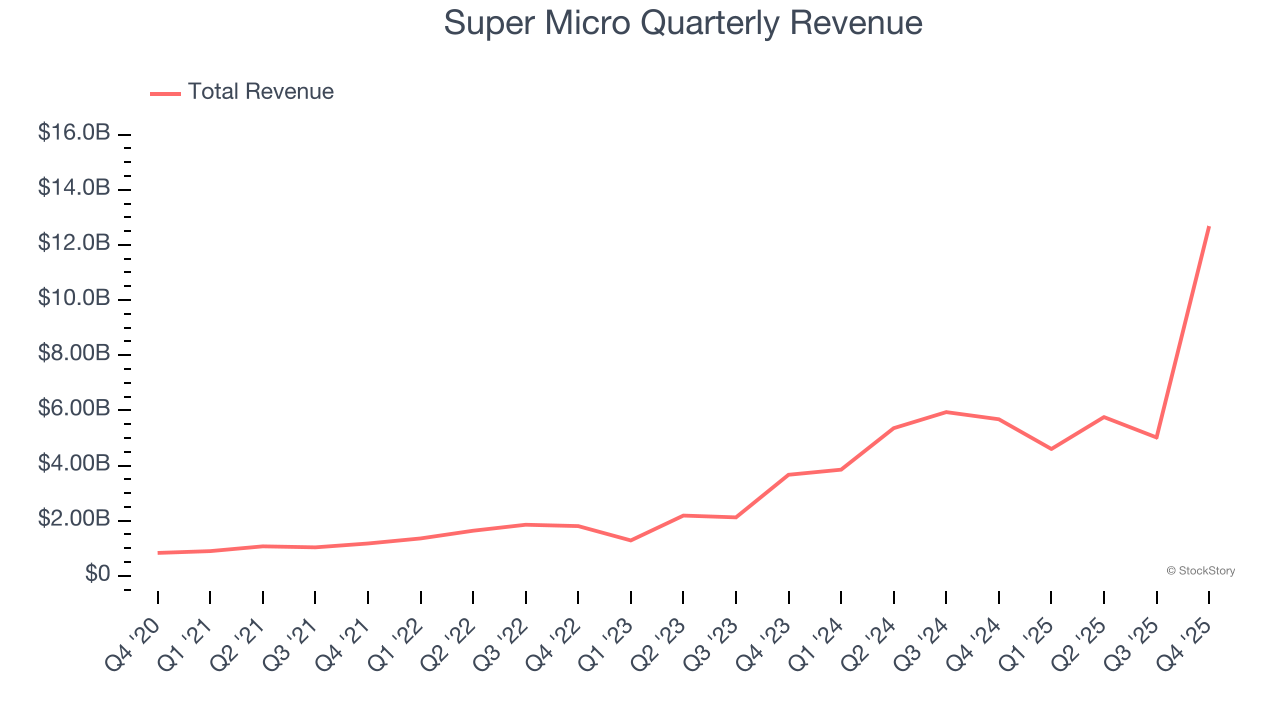
We at StockStory place the most emphasis on long-term growth, but within business services, a half-decade historical view may miss recent innovations or disruptive industry trends. Super Micro’s annualized revenue growth of 74.1% over the last two years is above its five-year trend, suggesting its demand was strong and recently accelerated.
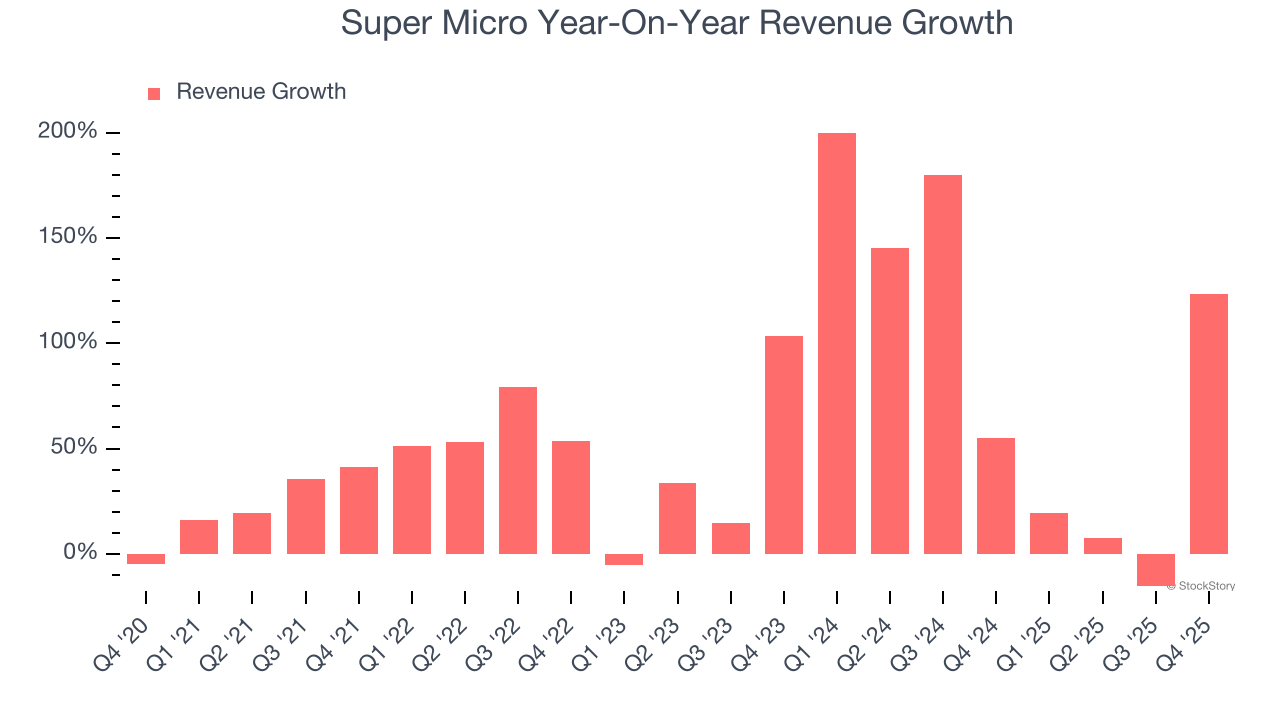
This quarter, Super Micro reported magnificent year-on-year revenue growth of 123%, and its $12.68 billion of revenue beat Wall Street’s estimates by 21.5%. Company management is currently guiding for a 167% year-on-year increase in sales next quarter.
Looking further ahead, sell-side analysts expect revenue to grow 51.4% over the next 12 months, a deceleration versus the last two years. Still, this projection is eye-popping given its scale and implies the market is baking in success for its products and services.
The 1999 book Gorilla Game predicted Microsoft and Apple would dominate tech before it happened. Its thesis? Identify the platform winners early. Today, enterprise software companies embedding generative AI are becoming the new gorillas. a profitable, fast-growing enterprise software stock that is already riding the automation wave and looking to catch the generative AI next.
Operating margin is an important measure of profitability as it shows the portion of revenue left after accounting for all core expenses – everything from the cost of goods sold to advertising and wages. It’s also useful for comparing profitability across companies with different levels of debt and tax rates because it excludes interest and taxes.
Super Micro’s operating margin might fluctuated slightly over the last 12 months but has remained more or less the same, averaging 6.2% over the last five years. This profitability was paltry for a business services business and caused by its suboptimal cost structure.
Analyzing the trend in its profitability, Super Micro’s operating margin might fluctuated slightly but has generally stayed the same over the last five years. This raises questions about the company’s expense base because its revenue growth should have given it leverage on its fixed costs, resulting in better economies of scale and profitability.
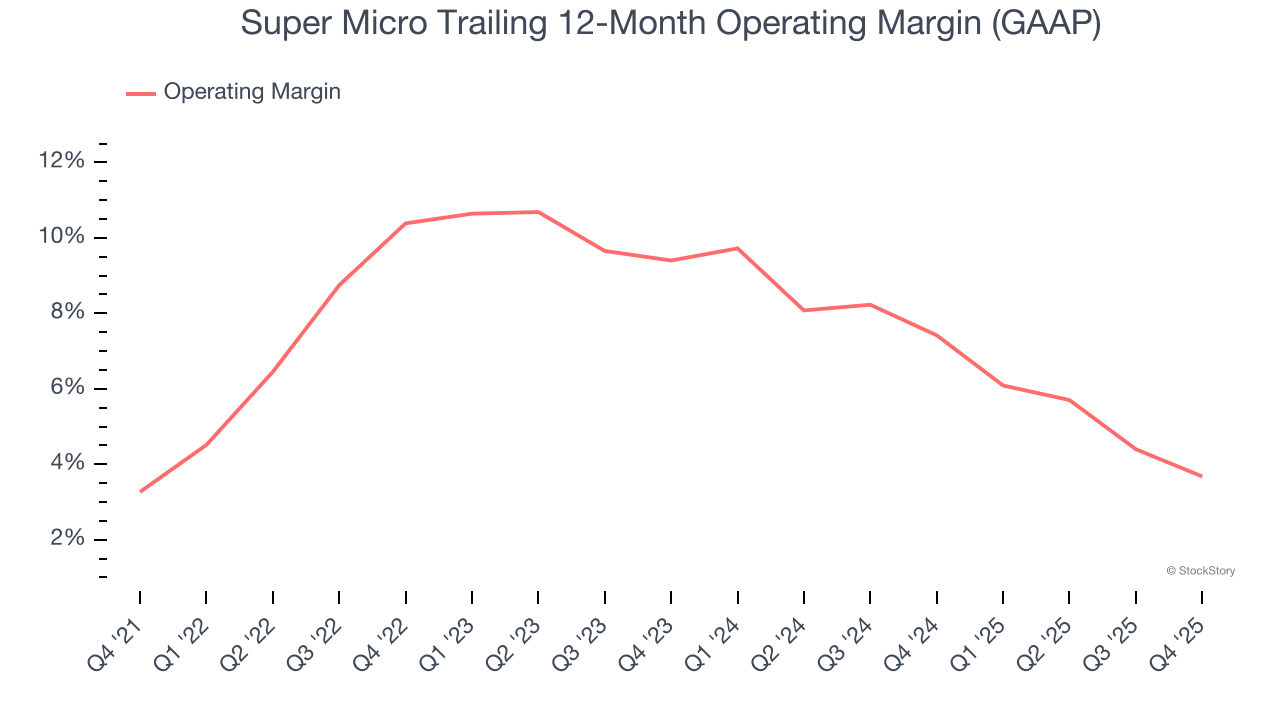
In Q4, Super Micro generated an operating margin profit margin of 3.7%, down 2.8 percentage points year on year. This contraction shows it was less efficient because its expenses grew faster than its revenue.
We track the long-term change in earnings per share (EPS) for the same reason as long-term revenue growth. Compared to revenue, however, EPS highlights whether a company’s growth is profitable.
Sadly for Super Micro, its EPS declined by 8.2% annually over the last five years while its revenue grew by 53.8%. However, its operating margin didn’t change during this time, telling us that non-fundamental factors such as interest and taxes affected its ultimate earnings.
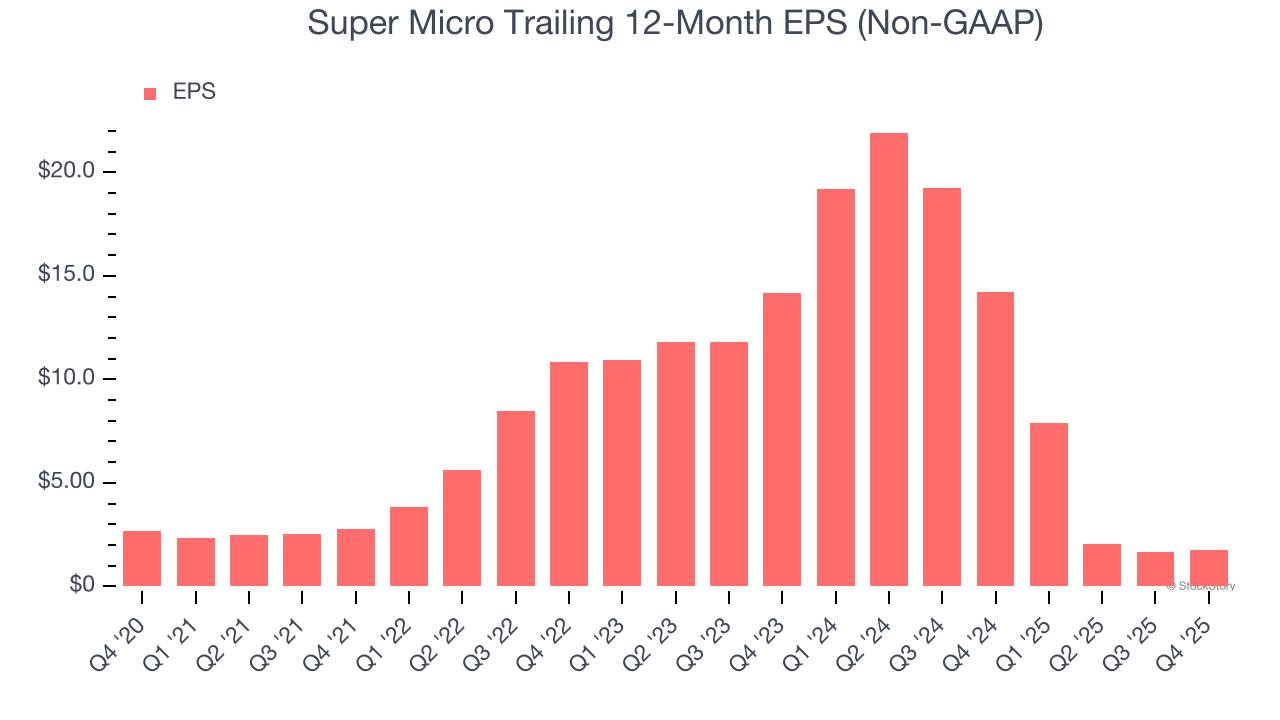
Like with revenue, we analyze EPS over a more recent period because it can provide insight into an emerging theme or development for the business.
For Super Micro, its two-year annual EPS declines of 64.7% show it’s continued to underperform. These results were bad no matter how you slice the data, but given it was successful in other measures of financial health, we’re hopeful Super Micro can generate earnings growth in the future.
In Q4, Super Micro reported adjusted EPS of $0.69, up from $0.60 in the same quarter last year. This print easily cleared analysts’ estimates, and shareholders should be content with the results. Over the next 12 months, Wall Street expects Super Micro’s full-year EPS of $1.76 to grow 45.7%.
It was good to see Super Micro beat analysts’ EPS expectations this quarter. We were also excited its EPS guidance for next quarter outperformed Wall Street’s estimates by a wide margin. Zooming out, we think this quarter featured some important positives. The stock traded up 5.5% to $31.42 immediately following the results.
Super Micro put up rock-solid earnings, but one quarter doesn’t necessarily make the stock a buy. Let’s see if this is a good investment. We think that the latest quarter is only one piece of the longer-term business quality puzzle. Quality, when combined with valuation, can help determine if the stock is a buy. We cover that in our actionable full research report which you can read here (it’s free).
| 1 hour | |
| 14 hours | |
| Apr-02 | |
| Apr-02 | |
| Apr-02 | |
| Apr-01 | |
| Apr-01 | |
| Mar-31 | |
| Mar-31 | |
| Mar-31 | |
| Mar-30 | |
| Mar-30 | |
| Mar-29 | |
| Mar-27 | |
| Mar-26 |
Join thousands of traders who make more informed decisions with our premium features. Real-time quotes, advanced visualizations, alerts, and much more.
Learn more about Finviz Elite