|
|
|

|
|||||
|
|
|

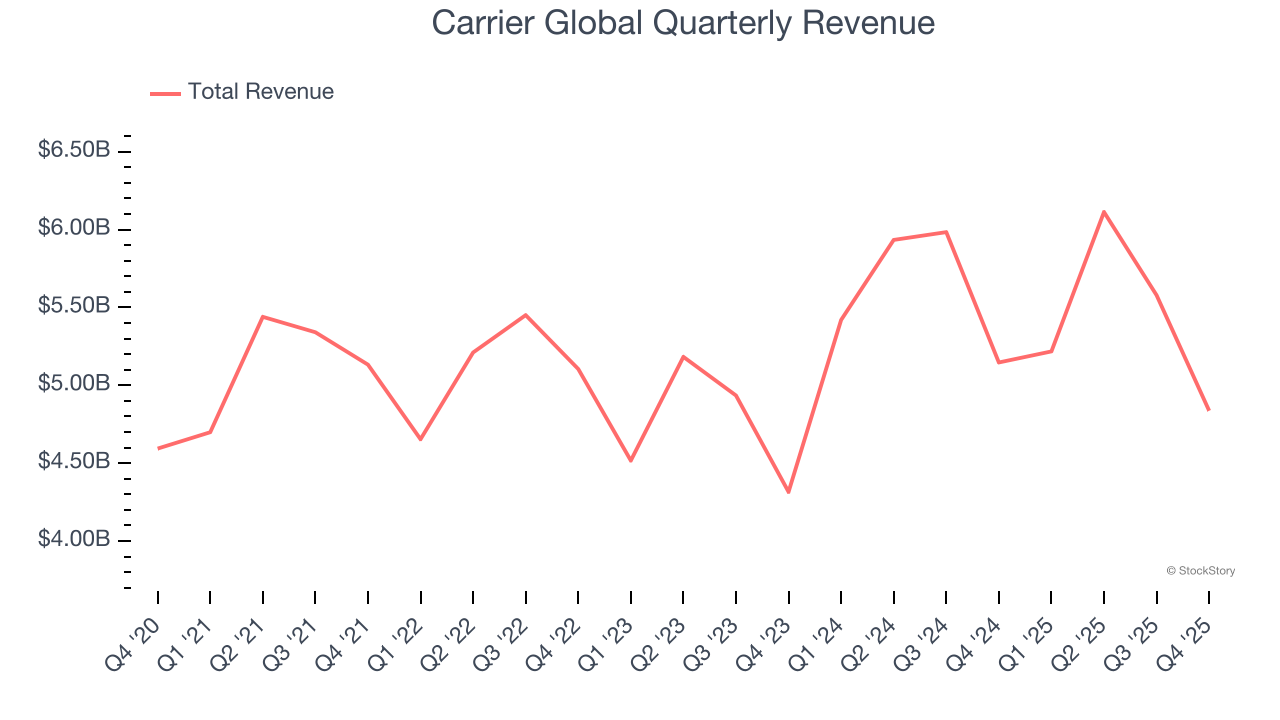
Heating, ventilation, air conditioning, and refrigeration company Carrier Global (NYSE:CARR) missed Wall Street’s revenue expectations in Q4 CY2025, with sales falling 6% year on year to $4.84 billion. Its non-GAAP profit of $0.34 per share was 4.5% below analysts’ consensus estimates.
Is now the time to buy Carrier Global? Find out by accessing our full research report, it’s free.
"We continue to drive outsized growth in commercial HVAC1 with Q4 orders up nearly 50% driven by key data center wins and are well positioned to drive our sixth consecutive year of double-digit growth in this business in 2026. Our aftermarket1 playbook also continues to yield results, reflected in our fifth consecutive year of double-digit growth. We continue to control the controllables, reducing discretionary costs and building backlog in our long-cycle businesses to mitigate residential market challenges," said Carrier Chairman & CEO David Gitlin.
Founded by the inventor of air conditioning, Carrier Global (NYSE:CARR) manufactures heating, ventilation, air conditioning, and refrigeration products.
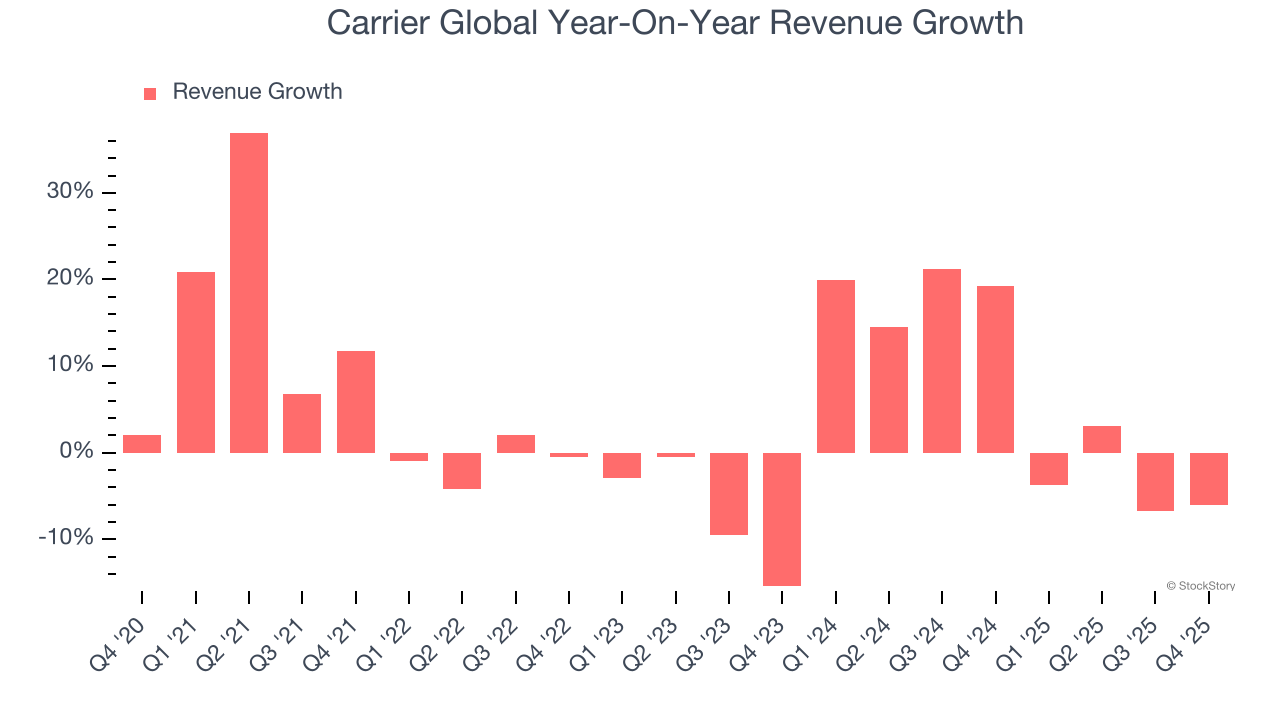
Reviewing a company’s long-term sales performance reveals insights into its quality. Any business can put up a good quarter or two, but the best consistently grow over the long haul. Over the last five years, Carrier Global grew its sales at a sluggish 4.5% compounded annual growth rate. This was below our standard for the industrials sector and is a tough starting point for our analysis.
We at StockStory place the most emphasis on long-term growth, but within industrials, a half-decade historical view may miss cycles, industry trends, or a company capitalizing on catalysts such as a new contract win or a successful product line. Carrier Global’s annualized revenue growth of 7.1% over the last two years is above its five-year trend, but we were still disappointed by the results.
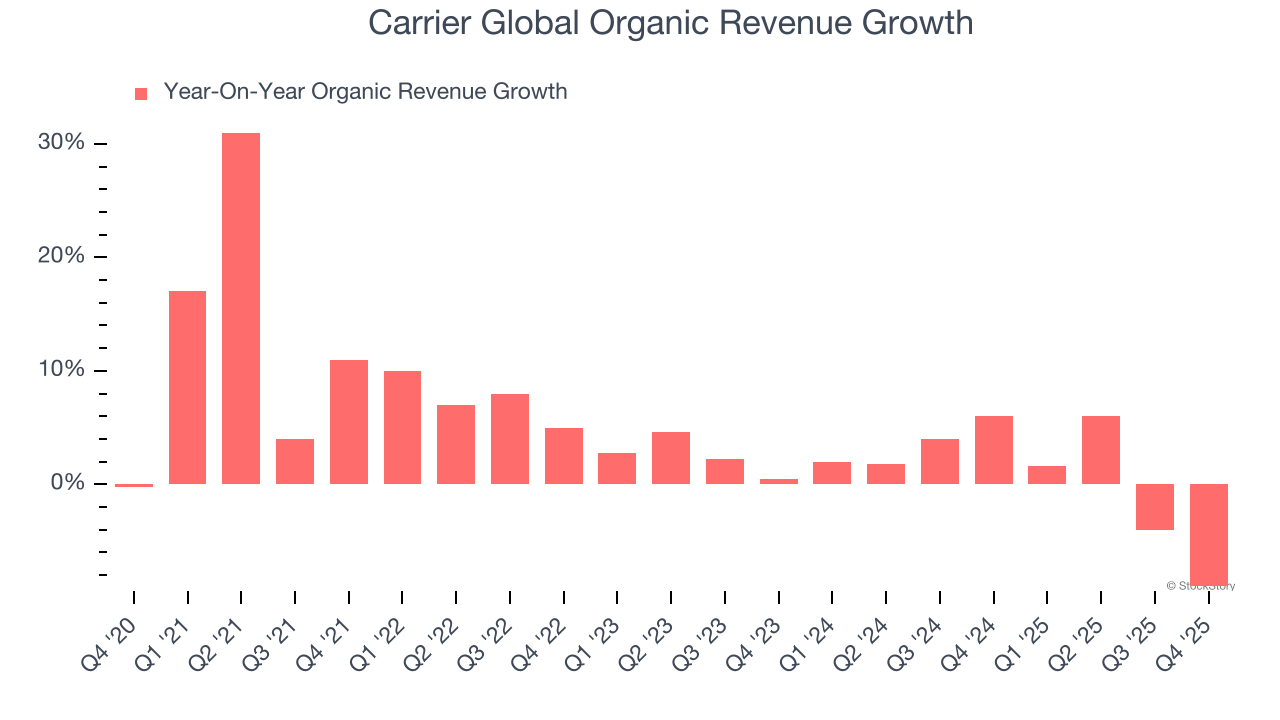
We can better understand the company’s sales dynamics by analyzing its organic revenue, which strips out one-time events like acquisitions and currency fluctuations that don’t accurately reflect its fundamentals. Over the last two years, Carrier Global’s organic revenue averaged 1% year-on-year growth. Because this number is lower than its two-year revenue growth, we can see that some mixture of acquisitions and foreign exchange rates boosted its headline results.
This quarter, Carrier Global missed Wall Street’s estimates and reported a rather uninspiring 6% year-on-year revenue decline, generating $4.84 billion of revenue.
Looking ahead, sell-side analysts expect revenue to grow 3.5% over the next 12 months, a deceleration versus the last two years. This projection doesn't excite us and indicates its products and services will see some demand headwinds.
Software is eating the world and there is virtually no industry left that has been untouched by it. That drives increasing demand for tools helping software developers do their jobs, whether it be monitoring critical cloud infrastructure, integrating audio and video functionality, or ensuring smooth content streaming. Click here to access a free report on our 3 favorite stocks to play this generational megatrend.
Operating margin is one of the best measures of profitability because it tells us how much money a company takes home after procuring and manufacturing its products, marketing and selling those products, and most importantly, keeping them relevant through research and development.
Carrier Global has been an efficient company over the last five years. It was one of the more profitable businesses in the industrials sector, boasting an average operating margin of 13.6%. This result was particularly impressive because of its low gross margin, which is mostly a factor of what it sells and takes huge shifts to move meaningfully. Companies have more control over their operating margins, and it’s a show of well-managed operations if they’re high when gross margins are low.
Analyzing the trend in its profitability, Carrier Global’s operating margin decreased by 2.8 percentage points over the last five years. This raises questions about the company’s expense base because its revenue growth should have given it leverage on its fixed costs, resulting in better economies of scale and profitability.
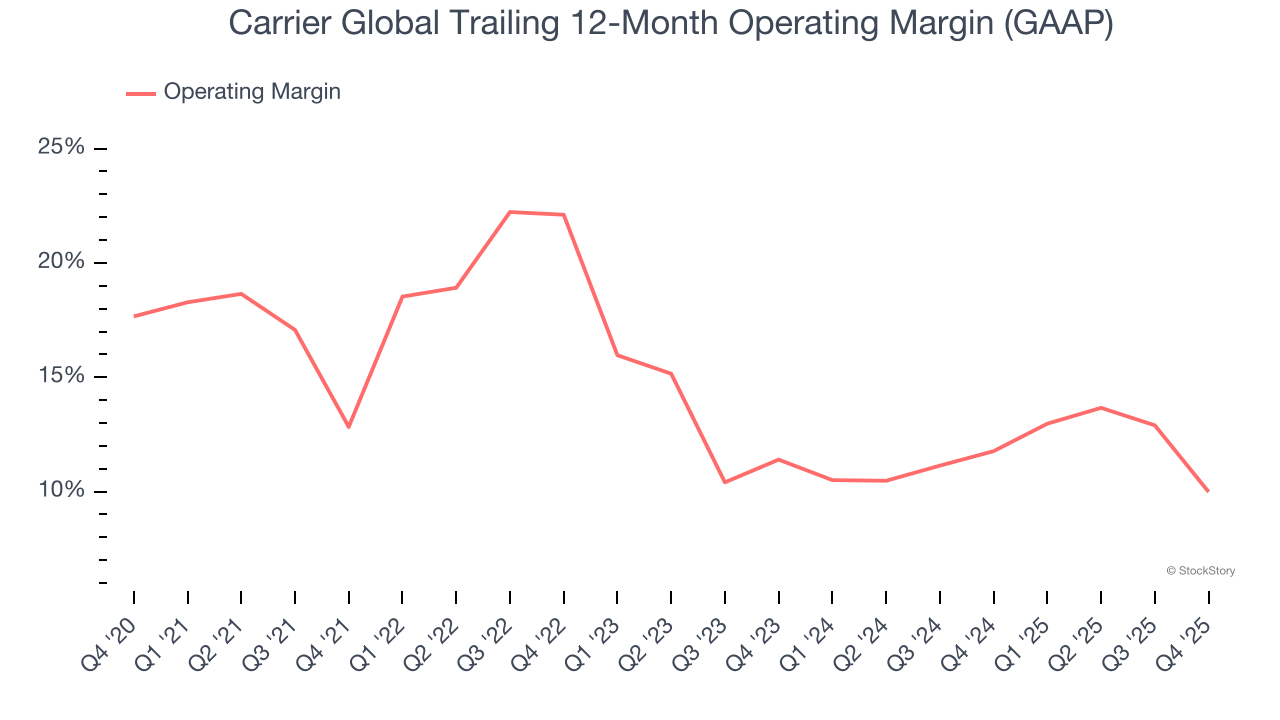
In Q4, Carrier Global generated an operating margin profit margin of 2.1%, down 12.9 percentage points year on year. Since Carrier Global’s operating margin decreased more than its gross margin, we can assume it was less efficient because expenses such as marketing, R&D, and administrative overhead increased.
We track the long-term change in earnings per share (EPS) for the same reason as long-term revenue growth. Compared to revenue, however, EPS highlights whether a company’s growth is profitable.
Carrier Global’s EPS grew at a decent 9.2% compounded annual growth rate over the last five years, higher than its 4.5% annualized revenue growth. However, this alone doesn’t tell us much about its business quality because its operating margin didn’t improve.
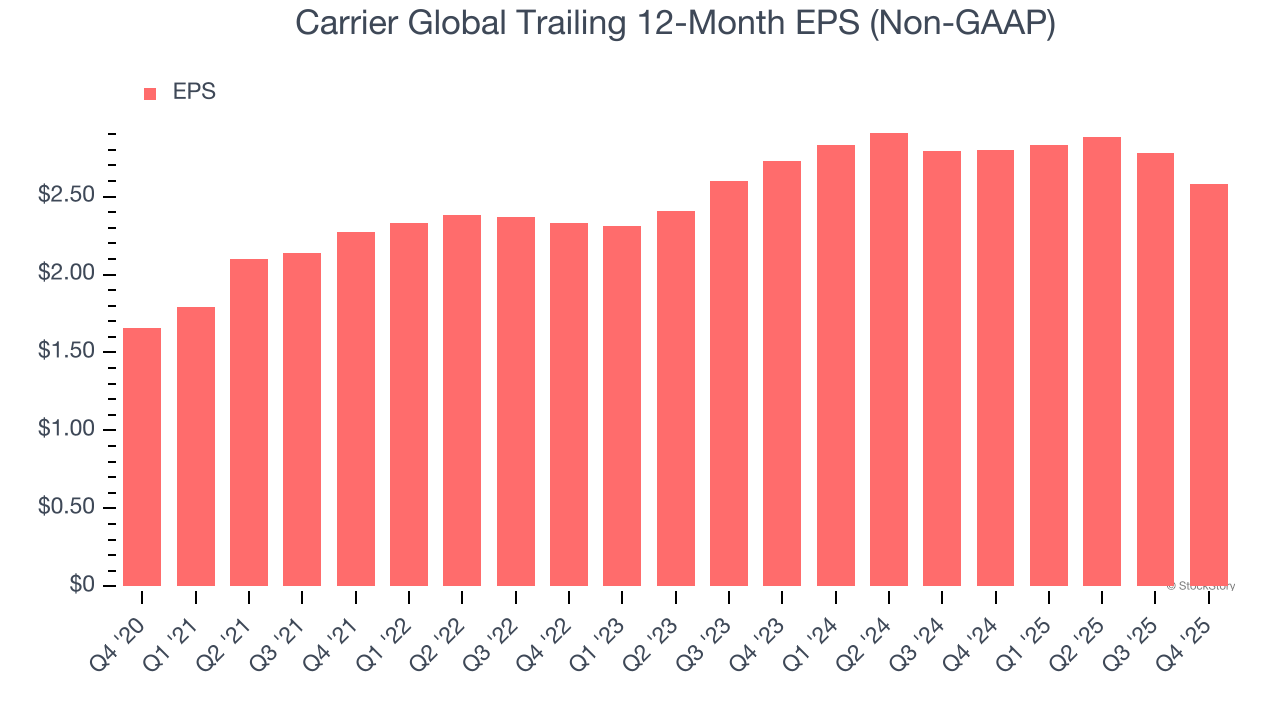
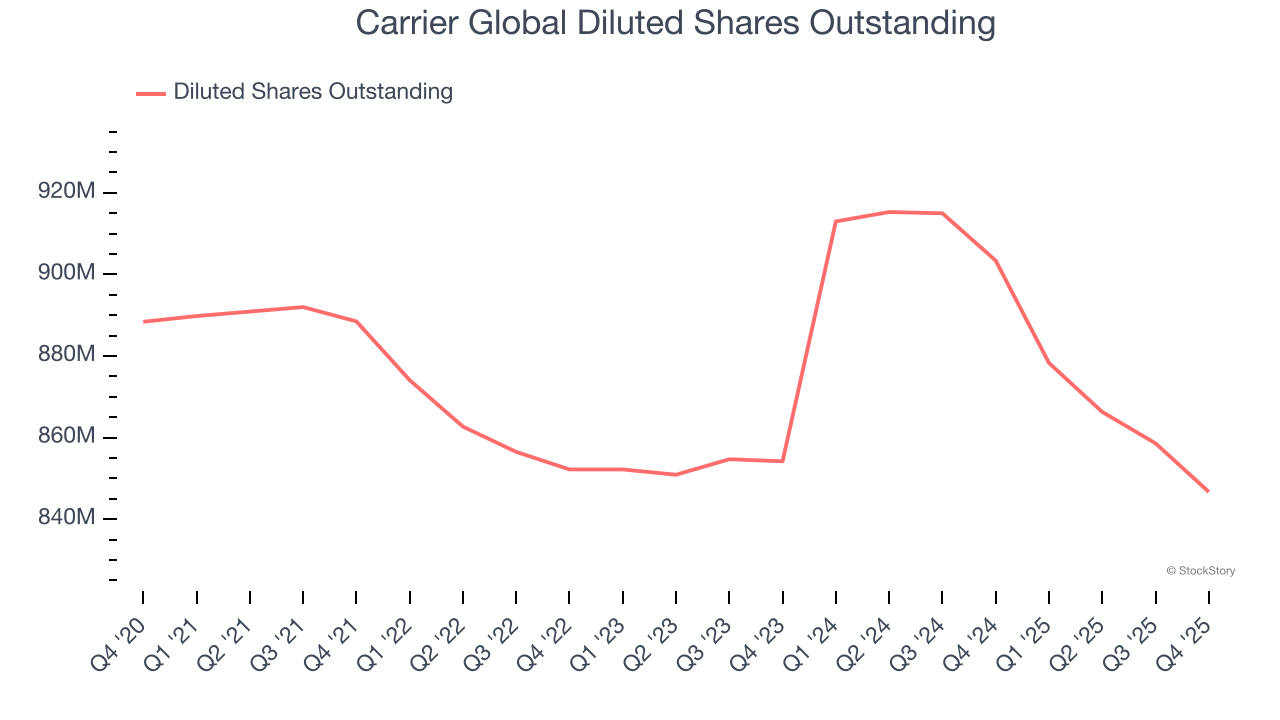
Diving into the nuances of Carrier Global’s earnings can give us a better understanding of its performance. A five-year view shows that Carrier Global has repurchased its stock, shrinking its share count by 4.7%. This tells us its EPS outperformed its revenue not because of increased operational efficiency but financial engineering, as buybacks boost per share earnings.
Like with revenue, we analyze EPS over a shorter period to see if we are missing a change in the business.
For Carrier Global, its two-year annual EPS declines of 2.8% mark a reversal from its five-year trend. We hope Carrier Global can return to earnings growth in the future.
In Q4, Carrier Global reported adjusted EPS of $0.34, down from $0.54 in the same quarter last year. This print missed analysts’ estimates, but we care more about long-term adjusted EPS growth than short-term movements. Over the next 12 months, Wall Street expects Carrier Global’s full-year EPS of $2.58 to grow 12.4%.
We struggled to find many positives in these results. Its revenue missed and its EBITDA fell short of Wall Street’s estimates. Overall, this was a softer quarter. The stock traded down 4.6% to $60.62 immediately after reporting.
The latest quarter from Carrier Global’s wasn’t that good. One earnings report doesn’t define a company’s quality, though, so let’s explore whether the stock is a buy at the current price. The latest quarter does matter, but not nearly as much as longer-term fundamentals and valuation, when deciding if the stock is a buy. We cover that in our actionable full research report which you can read here (it’s free).
| Jul-07 | |
| Jul-02 | |
| Jul-01 | |
| Jun-30 | |
| Jun-26 | |
| Jun-25 | |
| Jun-17 | |
| Jun-10 | |
| Jun-09 | |
| Jun-04 | |
| Jun-02 | |
| May-29 | |
| May-26 | |
| May-19 | |
| May-11 |
Join thousands of traders who make more informed decisions with our premium features. Real-time quotes, advanced visualizations, alerts, and much more.
Learn more about Finviz Elite