|
|
|

|
|||||
|
|
|

Freight delivery company XPO (NYSE:XPO) reported Q4 CY2025 results exceeding the market’s revenue expectations, with sales up 4.7% year on year to $2.01 billion. Its non-GAAP profit of $0.88 per share was 15.3% above analysts’ consensus estimates.
Is now the time to buy XPO? Find out by accessing our full research report, it’s free.
Owning a mobile game simulating freight operations for the Tour de France, XPO (NYSE:XPO) is a transportation company specializing in expedited shipping services.
Reviewing a company’s long-term sales performance reveals insights into its quality. Even a bad business can shine for one or two quarters, but a top-tier one grows for years. Over the last five years, XPO grew its sales at a tepid 5.7% compounded annual growth rate. This was below our standard for the industrials sector and is a rough starting point for our analysis.
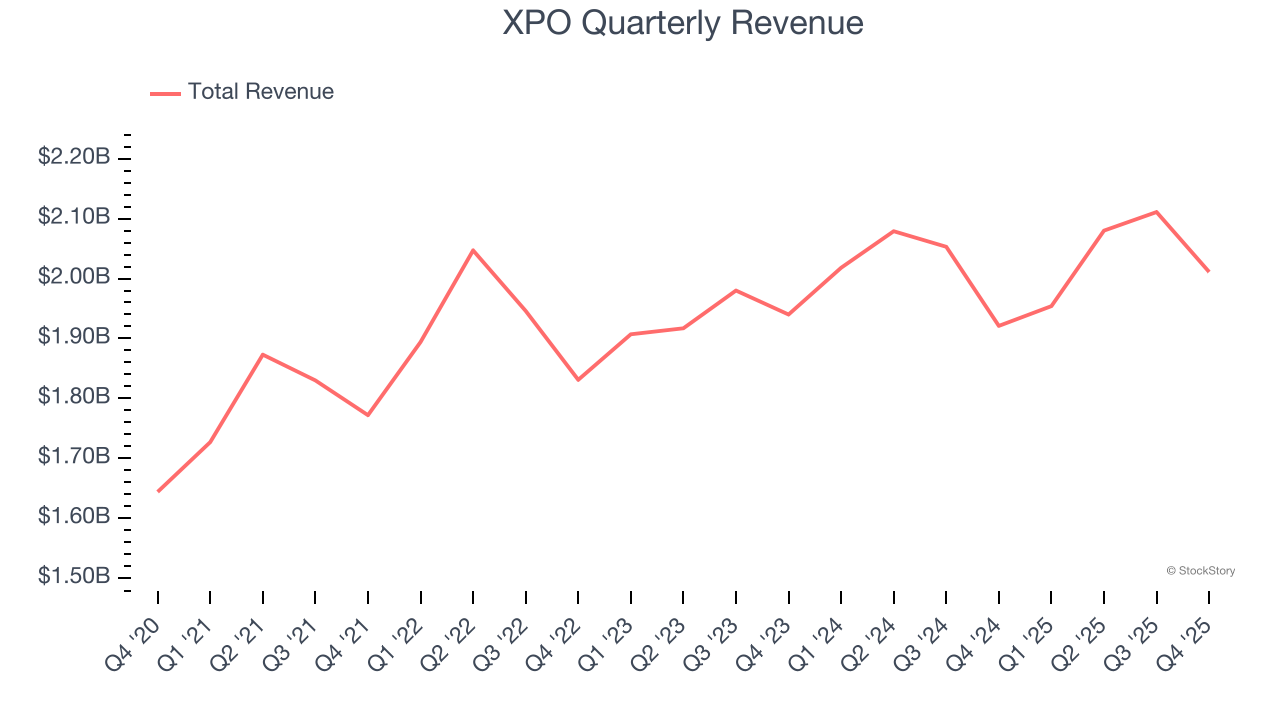
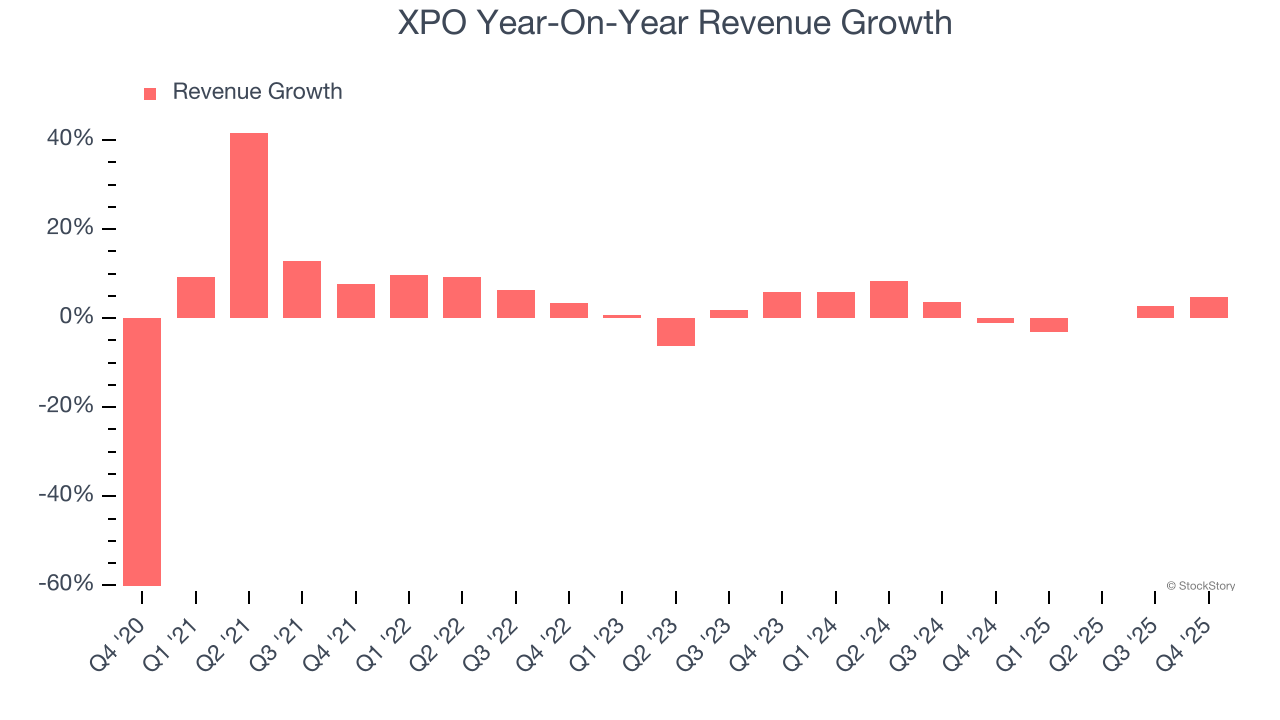
We at StockStory place the most emphasis on long-term growth, but within industrials, a half-decade historical view may miss cycles, industry trends, or a company capitalizing on catalysts such as a new contract win or a successful product line. XPO’s recent performance shows its demand has slowed as its annualized revenue growth of 2.6% over the last two years was below its five-year trend.
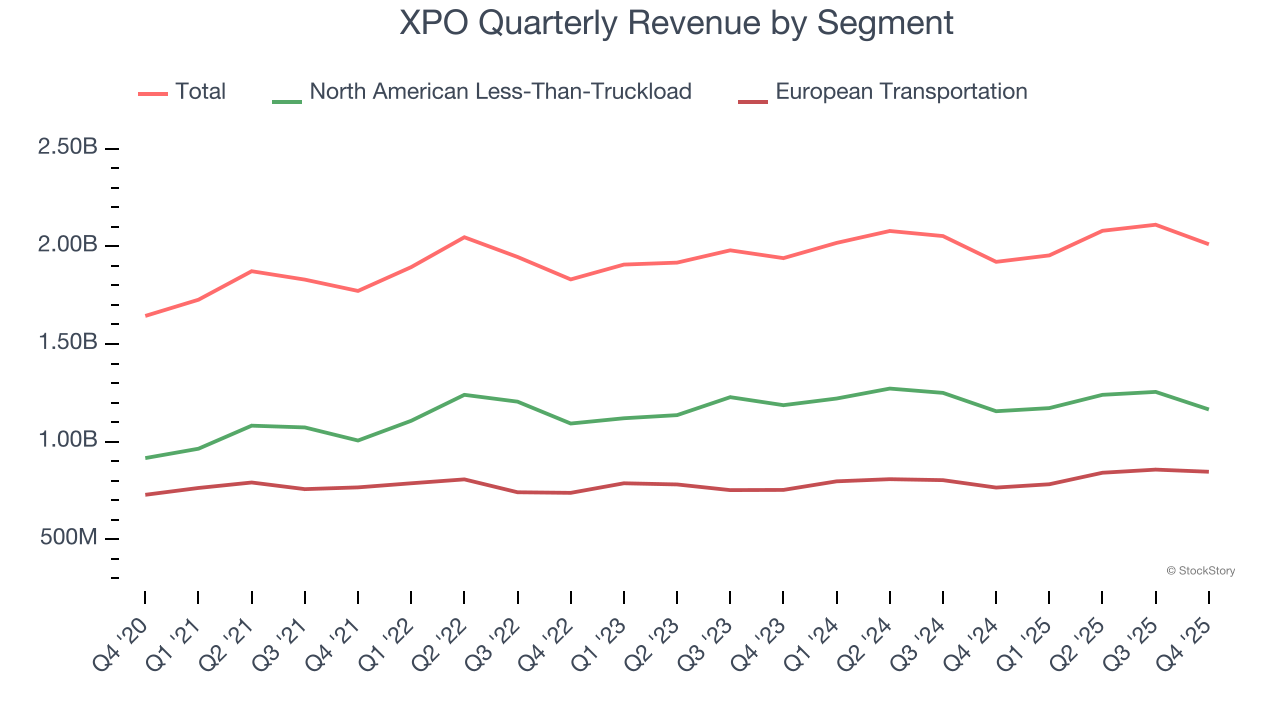
We can better understand the company’s revenue dynamics by analyzing its most important segments, North American Less-Than-Truckload and European Transportation , which are 57.9% and 42.1% of revenue. Over the last two years, XPO’s North American Less-Than-Truckload revenue (freight services) averaged 1.9% year-on-year growth while its European Transportation revenue (truckload, less-than-truckload, and truck brokerage) averaged 4.1% growth.
This quarter, XPO reported modest year-on-year revenue growth of 4.7% but beat Wall Street’s estimates by 2.9%.
Looking ahead, sell-side analysts expect revenue to grow 2.6% over the next 12 months, similar to its two-year rate. This projection is underwhelming and suggests its newer products and services will not catalyze better top-line performance yet.
Microsoft, Alphabet, Coca-Cola, Monster Beverage—all began as under-the-radar growth stories riding a massive trend. We’ve identified the next one: a profitable AI semiconductor play Wall Street is still overlooking. Go here for access to our full report.
XPO was profitable over the last five years but held back by its large cost base. Its average operating margin of 6.3% was weak for an industrials business. This result isn’t too surprising given its low gross margin as a starting point.
On the plus side, XPO’s operating margin rose by 3.7 percentage points over the last five years, as its sales growth gave it operating leverage.
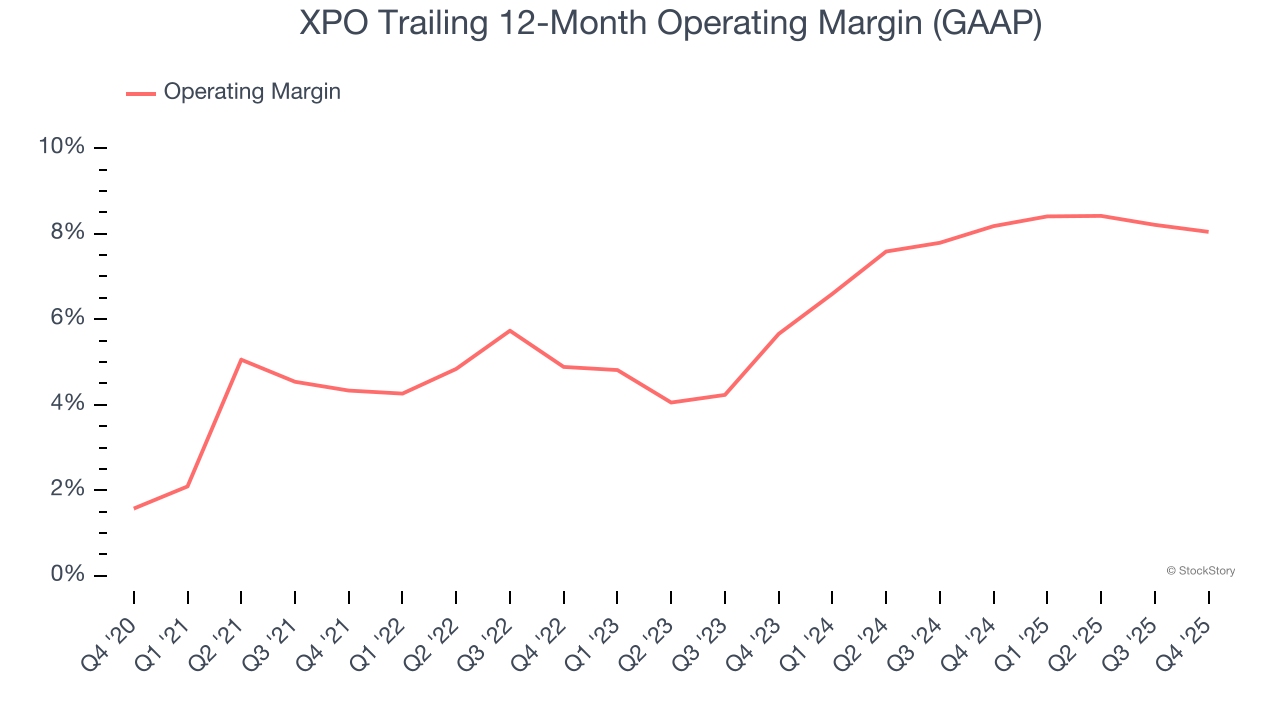
In Q4, XPO generated an operating margin profit margin of 7.1%, in line with the same quarter last year. This indicates the company’s cost structure has recently been stable.
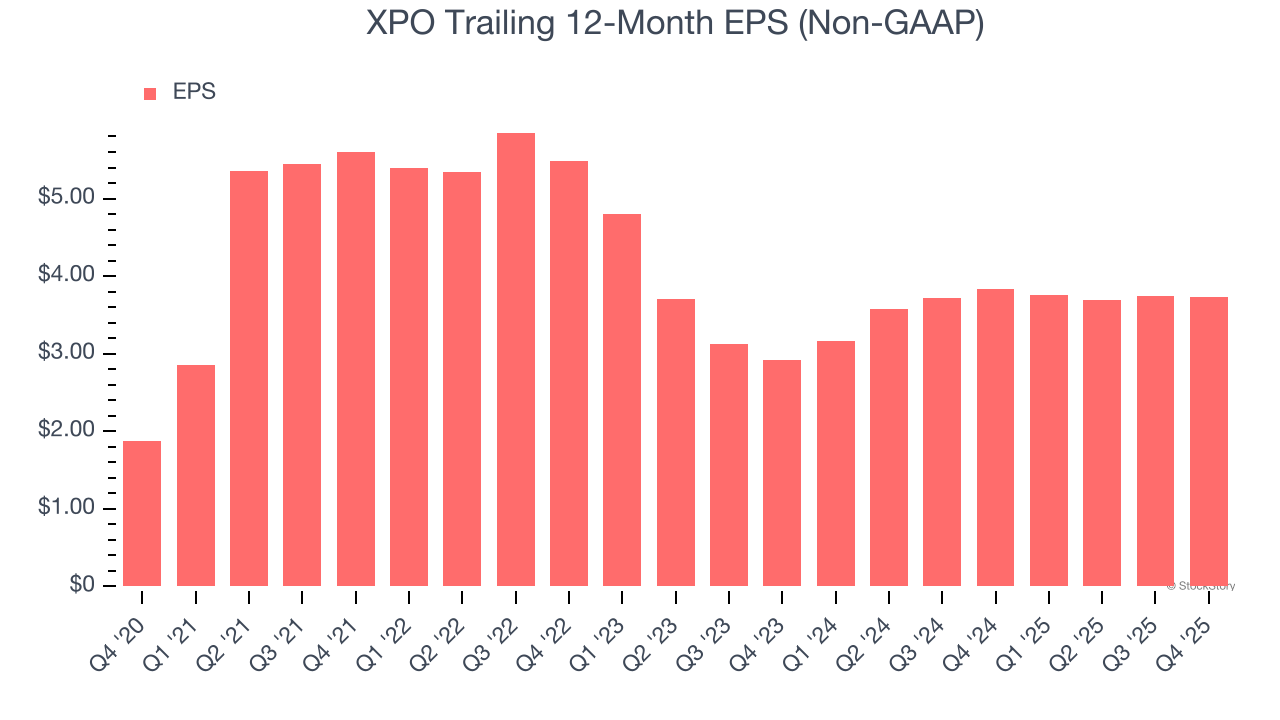
Revenue trends explain a company’s historical growth, but the long-term change in earnings per share (EPS) points to the profitability of that growth – for example, a company could inflate its sales through excessive spending on advertising and promotions.
XPO’s EPS grew at a spectacular 14.8% compounded annual growth rate over the last five years, higher than its 5.7% annualized revenue growth. This tells us the company became more profitable on a per-share basis as it expanded.
We can take a deeper look into XPO’s earnings quality to better understand the drivers of its performance. As we mentioned earlier, XPO’s operating margin was flat this quarter but expanded by 3.7 percentage points over the last five years. This was the most relevant factor (aside from the revenue impact) behind its higher earnings; interest expenses and taxes can also affect EPS but don’t tell us as much about a company’s fundamentals.
Like with revenue, we analyze EPS over a shorter period to see if we are missing a change in the business.
For XPO, its two-year annual EPS growth of 13% was lower than its five-year trend. We still think its growth was good and hope it can accelerate in the future.
In Q4, XPO reported adjusted EPS of $0.88, down from $0.89 in the same quarter last year. Despite falling year on year, this print easily cleared analysts’ estimates. Over the next 12 months, Wall Street expects XPO’s full-year EPS of $3.73 to grow 13.7%.
We were impressed by how significantly XPO blew past analysts’ European Transportation revenue expectations this quarter. We were also glad its revenue outperformed Wall Street’s estimates. Zooming out, we think this was a solid print. The market seemed to be hoping for more, and the stock traded down 1.1% to $177.50 immediately following the results.
Is XPO an attractive investment opportunity at the current price? When making that decision, it’s important to consider its valuation, business qualities, as well as what has happened in the latest quarter. We cover that in our actionable full research report which you can read here (it’s free).
| 15 hours | |
| 15 hours | |
| 16 hours | |
| 16 hours | |
| Jul-29 | |
| Jul-27 | |
| Jul-16 | |
| Jul-09 | |
| Jul-08 | |
| Jul-07 | |
| Jun-29 | |
| Jun-24 | |
| Jun-12 | |
| Jun-10 | |
| Jun-10 |
Join thousands of traders who make more informed decisions with our premium features. Real-time quotes, advanced visualizations, alerts, and much more.
Learn more about Finviz Elite