|
|
|

|
|||||
|
|
|

Professional tools and equipment manufacturer Snap-on (NYSE:SNA) fell short of the market’s revenue expectations in Q4 CY2025, with sales falling 5.2% year on year to $1.23 billion. Its GAAP profit of $4.94 per share was in line with analysts’ consensus estimates.
Is now the time to buy Snap-on? Find out by accessing our full research report, it’s free.
Founded in 1920, Snap-on (NYSE:SNA) is a global provider of tools, equipment, and diagnostics for various industries such as vehicle repair, aerospace, and the military.
Reviewing a company’s long-term sales performance reveals insights into its quality. Any business can put up a good quarter or two, but many enduring ones grow for years. Unfortunately, Snap-on’s 5.1% annualized revenue growth over the last five years was tepid. This was below our standard for the industrials sector and is a tough starting point for our analysis.
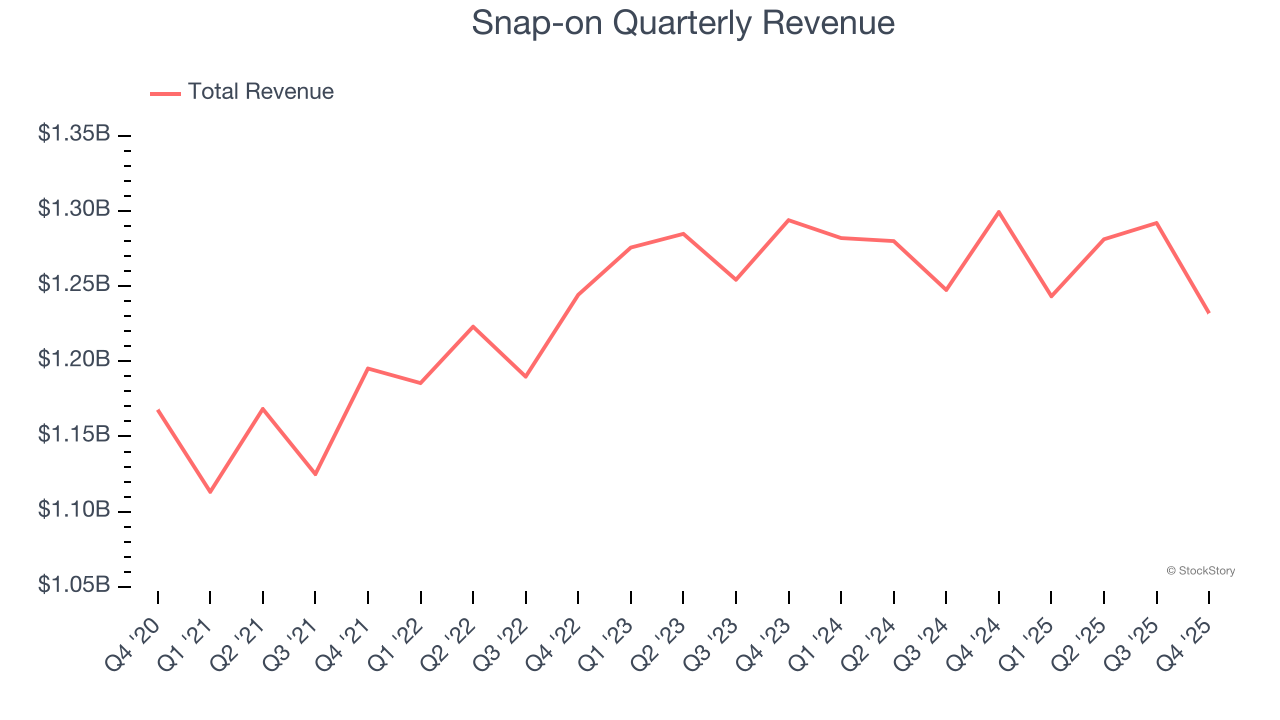
We at StockStory place the most emphasis on long-term growth, but within industrials, a half-decade historical view may miss cycles, industry trends, or a company capitalizing on catalysts such as a new contract win or a successful product line. Snap-on’s recent performance shows its demand has slowed as its revenue was flat over the last two years.
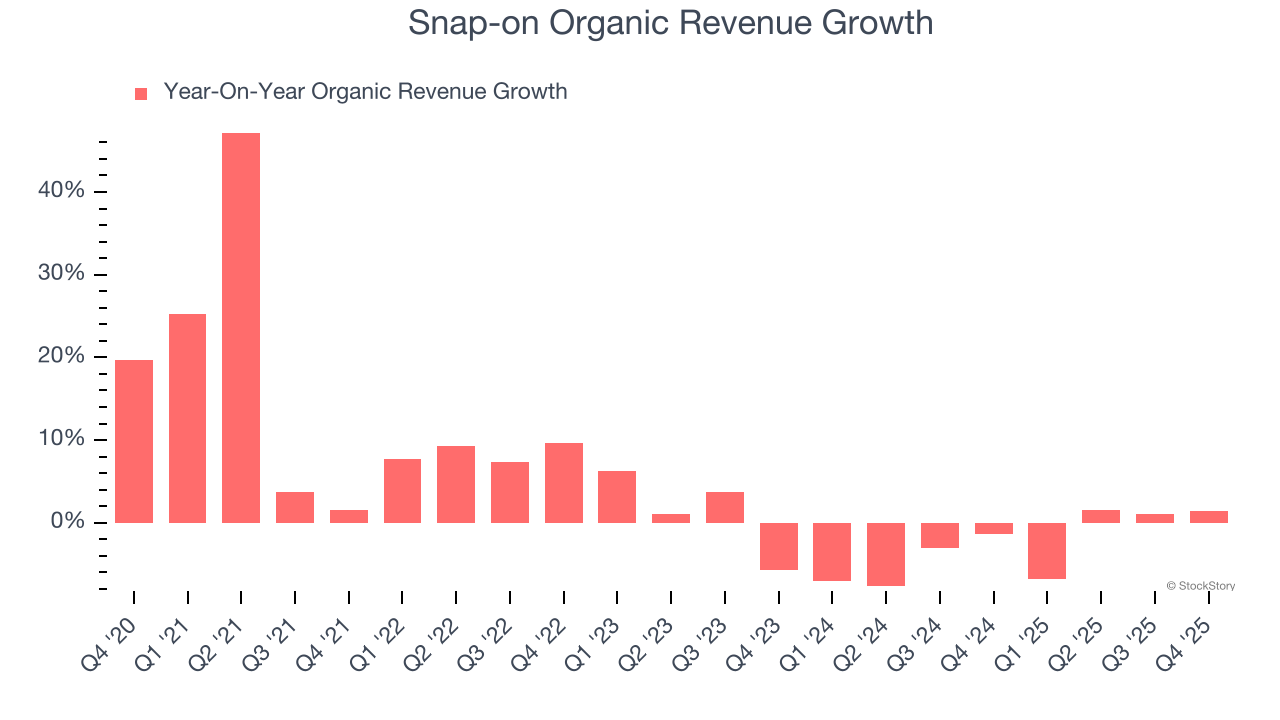
Snap-on also reports organic revenue, which strips out one-time events like acquisitions and currency fluctuations that don’t accurately reflect its fundamentals. Over the last two years, Snap-on’s organic revenue averaged 2.8% year-on-year declines. Because this number is lower than its two-year revenue growth, we can see that some mixture of acquisitions and foreign exchange rates boosted its headline results.
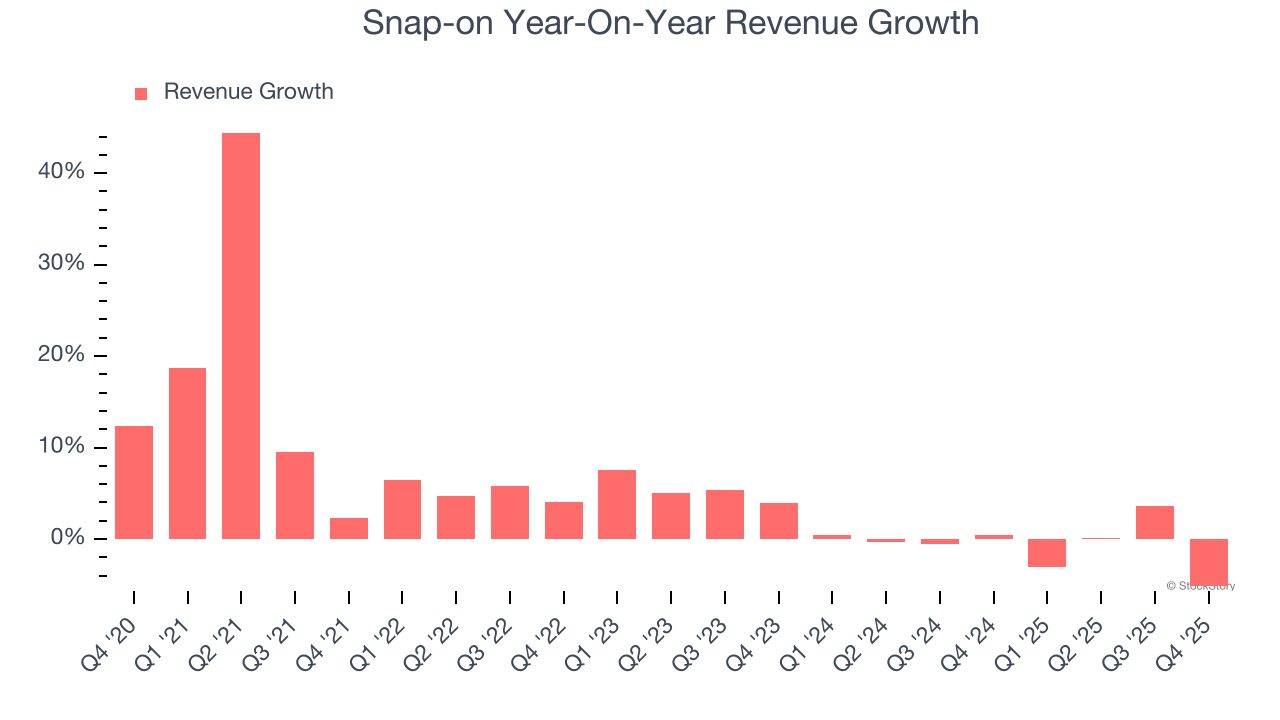
This quarter, Snap-on missed Wall Street’s estimates and reported a rather uninspiring 5.2% year-on-year revenue decline, generating $1.23 billion of revenue.
Looking ahead, sell-side analysts expect revenue to grow 5% over the next 12 months. While this projection implies its newer products and services will spur better top-line performance, it is still below the sector average.
Microsoft, Alphabet, Coca-Cola, Monster Beverage—all began as under-the-radar growth stories riding a massive trend. We’ve identified the next one: a profitable AI semiconductor play Wall Street is still overlooking. Go here for access to our full report.
Snap-on has been a well-oiled machine over the last five years. It demonstrated elite profitability for an industrials business, boasting an average operating margin of 25.6%. This result isn’t surprising as its high gross margin gives it a favorable starting point.
Analyzing the trend in its profitability, Snap-on’s operating margin rose by 1.9 percentage points over the last five years, as its sales growth gave it operating leverage.
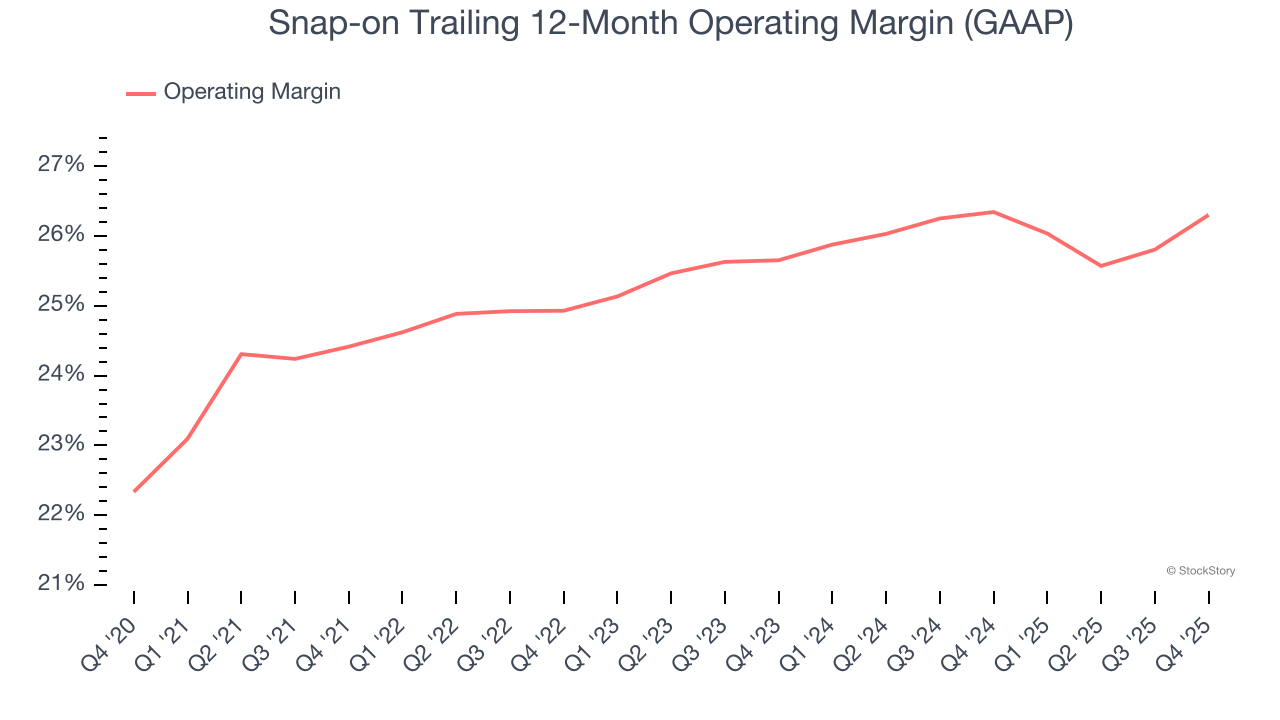
In Q4, Snap-on generated an operating margin profit margin of 27.6%, up 2 percentage points year on year. The increase was encouraging, and because its revenue and gross margin actually decreased, we can assume it was more efficient because it trimmed its operating expenses like marketing, R&D, and administrative overhead.
We track the long-term change in earnings per share (EPS) for the same reason as long-term revenue growth. Compared to revenue, however, EPS highlights whether a company’s growth is profitable.
Snap-on’s EPS grew at a solid 10.9% compounded annual growth rate over the last five years, higher than its 5.1% annualized revenue growth. This tells us the company became more profitable on a per-share basis as it expanded.
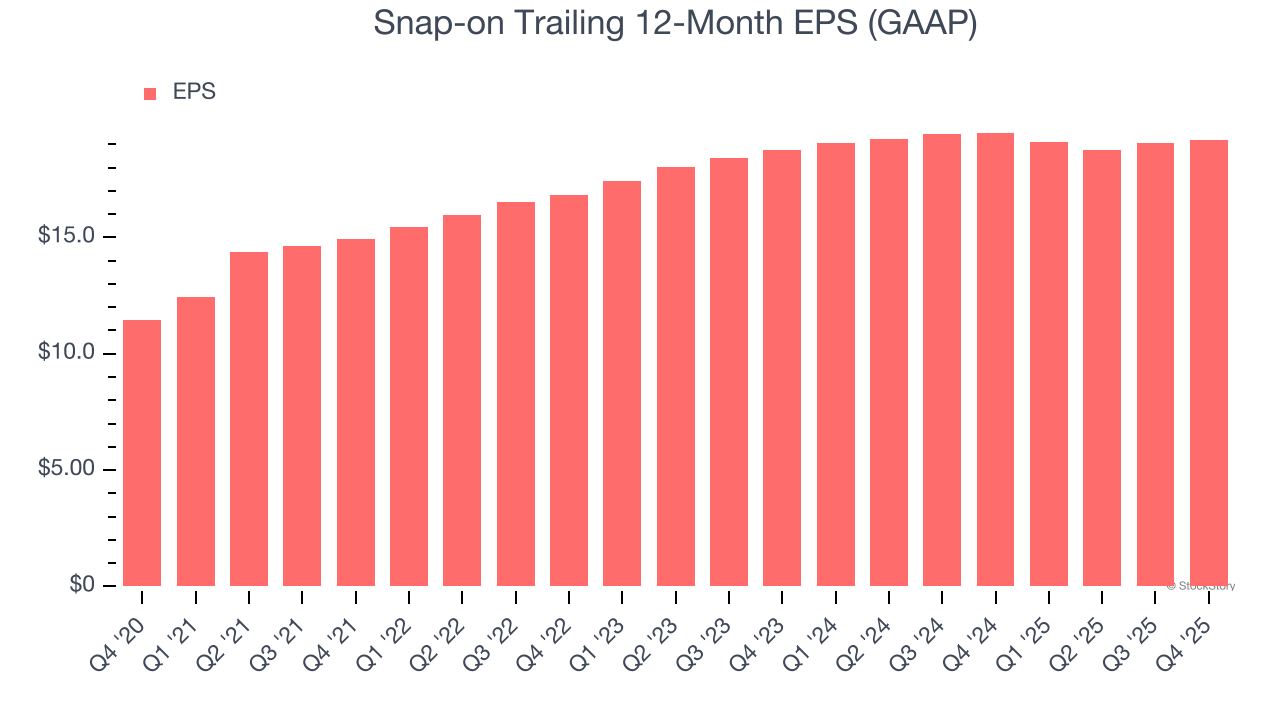
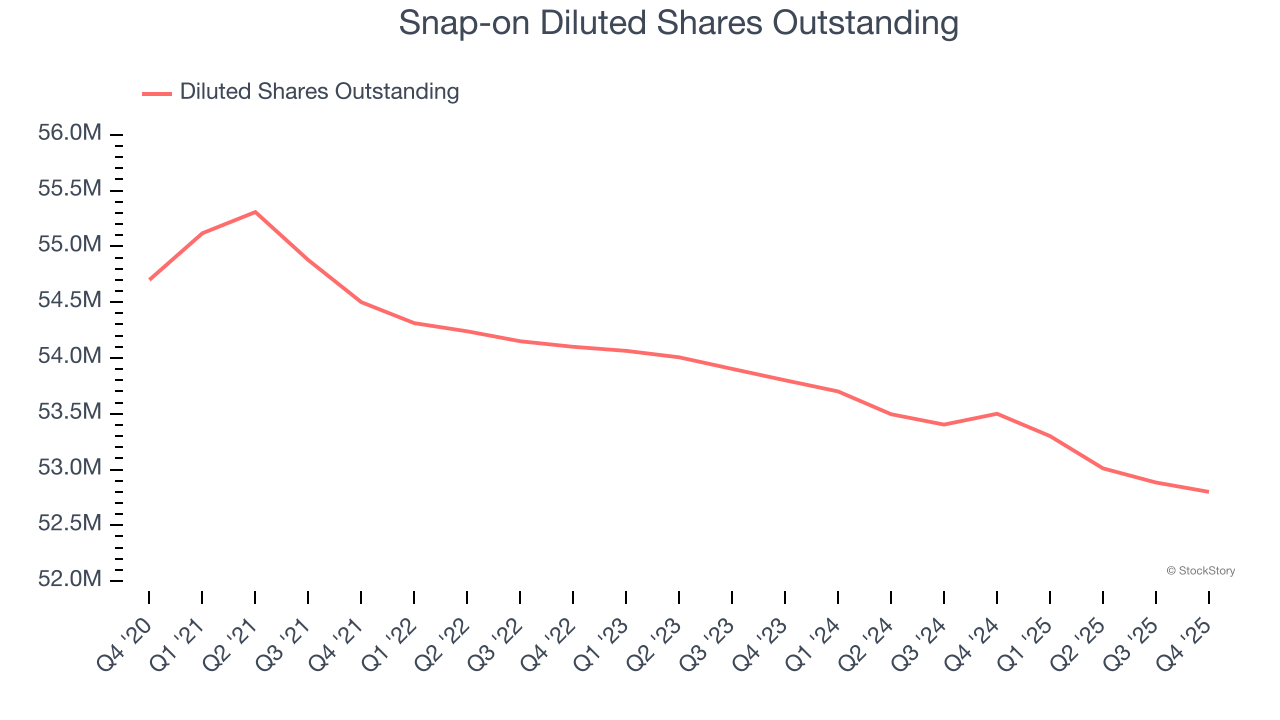
We can take a deeper look into Snap-on’s earnings quality to better understand the drivers of its performance. As we mentioned earlier, Snap-on’s operating margin expanded by 1.9 percentage points over the last five years. On top of that, its share count shrank by 3.5%. These are positive signs for shareholders because improving profitability and share buybacks turbocharge EPS growth relative to revenue growth.
Like with revenue, we analyze EPS over a shorter period to see if we are missing a change in the business.
For Snap-on, its two-year annual EPS growth of 1.2% was lower than its five-year trend. We hope its growth can accelerate in the future.
In Q4, Snap-on reported EPS of $4.94, up from $4.82 in the same quarter last year. This print was close to analysts’ estimates. Over the next 12 months, Wall Street expects Snap-on’s full-year EPS of $19.19 to grow 6.3%.
It was good to see Snap-on narrowly top analysts’ organic revenue expectations this quarter. On the other hand, its revenue missed. Overall, this quarter could have been better. The stock remained flat at $381.37 immediately after reporting.
The latest quarter from Snap-on’s wasn’t that good. One earnings report doesn’t define a company’s quality, though, so let’s explore whether the stock is a buy at the current price. If you’re making that decision, you should consider the bigger picture of valuation, business qualities, as well as the latest earnings. We cover that in our actionable full research report which you can read here (it’s free).
| Jul-23 | |
| Jul-23 | |
| Jul-23 | |
| Jul-09 | |
| Jun-25 | |
| Jun-09 | |
| May-28 | |
| May-05 | |
| Apr-30 | |
| Apr-29 | |
| Apr-24 | |
| Apr-23 | |
| Apr-23 | |
| Apr-23 | |
| Apr-16 |
Join thousands of traders who make more informed decisions with our premium features. Real-time quotes, advanced visualizations, alerts, and much more.
Learn more about Finviz Elite