|
|
|

|
|||||
|
|
|
Amcor Plc AMCR reported second-quarter fiscal 2026 (ended Dec. 31, 2025) adjusted earnings per share (EPS) of 86 cents, which beat the Zacks Consensus Estimate of 83 cents. The bottom line grew 7.5% from the year-ago quarter. While the results benefited from gains related to the Berry acquisition, persistent volume declines continued to pressure both revenue and overall profits.
Including special items, the company reported net earnings per share of 38 cents compared with 56 cents in the prior-year quarter.
Total revenues surged 68% year over year to $5.45 billion in the reported quarter. The top line, however, missed the Zacks Consensus Estimate of $5.55 billion.
Around 66% of the growth was attributed to the acquisition. The volume was down 3% from the year-ago quarter while price/mix had no impact on sales. Amcor’s volume growth has been in the negative territory for the past three quarters. Currency had a positive 5% impact.

Amcor PLC price-consensus-eps-surprise-chart | Amcor PLC Quote
The cost of sales surged 68.6% year over year to $4.41 billion. Gross profit soared 66% year over year to $1.04 billion. The gross margin was 19.1% compared with the year-ago quarter’s 19.3%.
SG&A expenses were $584 million, up 98% year over year.
Adjusted operating income was $603 million in the quarter, up 66% from $363 million in the prior-year quarter. The adjusted operating margin was 11.1% compared with 11.2% in the prior-year quarter.
Adjusted EBITDA in the quarter was $826 million, an 83% increase from the $453 million in the prior-year quarter. Adjusted EBITDA margin was 15.2% compared with 14% in the year-ago quarter.
Global Flexible Packaging Solutions: Net sales increased 27% year over year to $3.19 billion. Volume dipped 2% year over year as higher volumes in pet food and meat proteins were offset by lower volumes in other nutrition, liquids and unconverted film and foil. Volumes were lower across North America, Latin America and Europe, somewhat offset by growth in the Asia Pacific. The segment’s volumes have been declining for three consecutive quarters.
Price/mix had a favorable 1% impact on sales and acquisition contributed 24%. Currency had a favorable impact of 4%.
Our model projected net sales of $3.24 billion. We had anticipated a volume decline of 0.9%. Currency impact and price/mix were expected to be a favorable 4.3% and 2.8%, respectively. The impact of acquisitions was projected at 21.7%.
The segment’s adjusted operating income came in at $402 million compared with the prior-year quarter’s $322 million, reflecting $65 million of acquired operating income, favorable cost performance and synergy benefits from the Berry Global acquisition. This was somewhat negated by lower volumes. Our model had projected a figure of $417.6 million.
Global Rigid Packaging Solutions: The segment reported net sales of $2.26 billion in the quarter, marking a 210% surge from the year-ago quarter. The acquisition contributed 212% to the growth and currency had a favorable impact of 10%. These gains were offset by a 6% decline in volumes and unfavorable price/mix impact of 6%.
We had projected net sales at $2.3 billion, indicating a 216.3% year-over-year upsurge, including the positive impacts of the Berry Global acquisition, estimated at 212.7%. We had expected a 3.7% decline in volumes, a price/mix increase of 3.7% and favorable currency impact of 5.3%.
Volumes were higher in pet food, beauty & wellness and specialty 4 containers but offset by weaker performances in healthcare and foodservice. Region-wise, volumes were in line in North America and lower in Europe, partly offset by volume growth across emerging markets, mainly Latin America. The segment’s volumes have been declining for four consecutive quarters.
The segment’s adjusted operating income came in at $228 million compared with the prior-year quarter’s $53 million. This included $165 million of acquired operating income, cost savings and synergy benefits from the Berry Global acquisition, offset by lower volumes. Our model had projected a figure of $224.8 million.
As of Dec. 31, 2025, Amcor had $1,057 million of cash and cash equivalents compared with $827 million as of June 30, 2025. The company generated $370 million of cash in operating activities in the first half of fiscal 2026 compared with $159 million in the year-ago comparable period.
As of Dec. 31, 2025, Amcor’s net debt totaled $14.08 billion, up from $13.27 billion as of June 30, 2025.
Adjusted EPS for fiscal 2026 is expected to be at $4.00-$4.15 (reflecting the one-for-five reverse stock split effected on Jan.14, 2026). The company projects a free cash flow of $1.8-$1.9 billion for fiscal 2026.
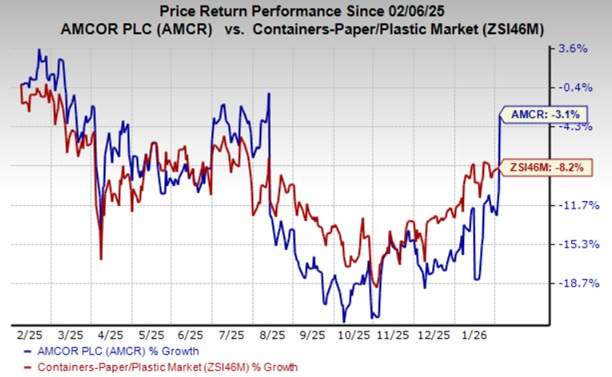
In the past year, AMCR shares have lost 3.1% compared with the industry’s 8.2% fall.
Amcor currently carries a Zacks Rank #3 (Hold). You can see the complete list of today’s Zacks #1 Rank (Strong Buy) stocks here.
Packaging Corporation of America PKG reported adjusted earnings per share of $2.32 in the fourth quarter of 2025, which missed the Zacks Consensus Estimate of $2.41. The bottom line came below Packaging Corp.’s guidance and fell 6% year over year.
Packaging Corp.’s sales in the fourth quarter rose 10.1% year over year to $2.36 billion. The top line missed the Zacks Consensus Estimate of $2.42 billion.
Avery Dennison Corporation AVY delivered adjusted earnings of $2.45 per share in fourth-quarter 2025, beating the Zacks Consensus Estimate of $2.40. The bottom line increased 2.9% year over year.
Avery Dennison’s total revenues moved up 3.9% year over year to $2.27 billion but missed the Zacks Consensus Estimate of $2.29 billion. Avery Dennison expects adjusted EPS between $2.40 and $2.46 for the first quarter of 2026.
Sealed Air Corporation SEE is scheduled to release fourth-quarter 2025 results on March 2. The Zacks Consensus Estimate for Sealed Air’s fourth-quarter 2025 earnings is pegged at 72 cents per share, implying a year-over-year dip of 4%.
The consensus estimate for Sealed Air’s top line is pegged at $1.34 billion, indicating a fall of 2.4% from the prior-year reported figure.
Want the latest recommendations from Zacks Investment Research? Today, you can download 7 Best Stocks for the Next 30 Days. Click to get this free report
This article originally published on Zacks Investment Research (zacks.com).
| Jul-15 | |
| Jul-09 | |
| Jul-09 | |
| Jul-08 | |
| Jul-07 | |
| Jul-01 | |
| Jun-29 | |
| Jun-22 | |
| Jun-19 | |
| Jun-17 | |
| Jun-16 | |
| Jun-15 | |
| Jun-15 | |
| Jun-10 | |
| Jun-04 |
Join thousands of traders who make more informed decisions with our premium features. Real-time quotes, advanced visualizations, alerts, and much more.
Learn more about Finviz Elite