


One of the most powerful combinations on Finviz is finally here.
If you're an Elite member, you can now access your Stock Screens directly inside Advanced Charts on Finviz – check it out:
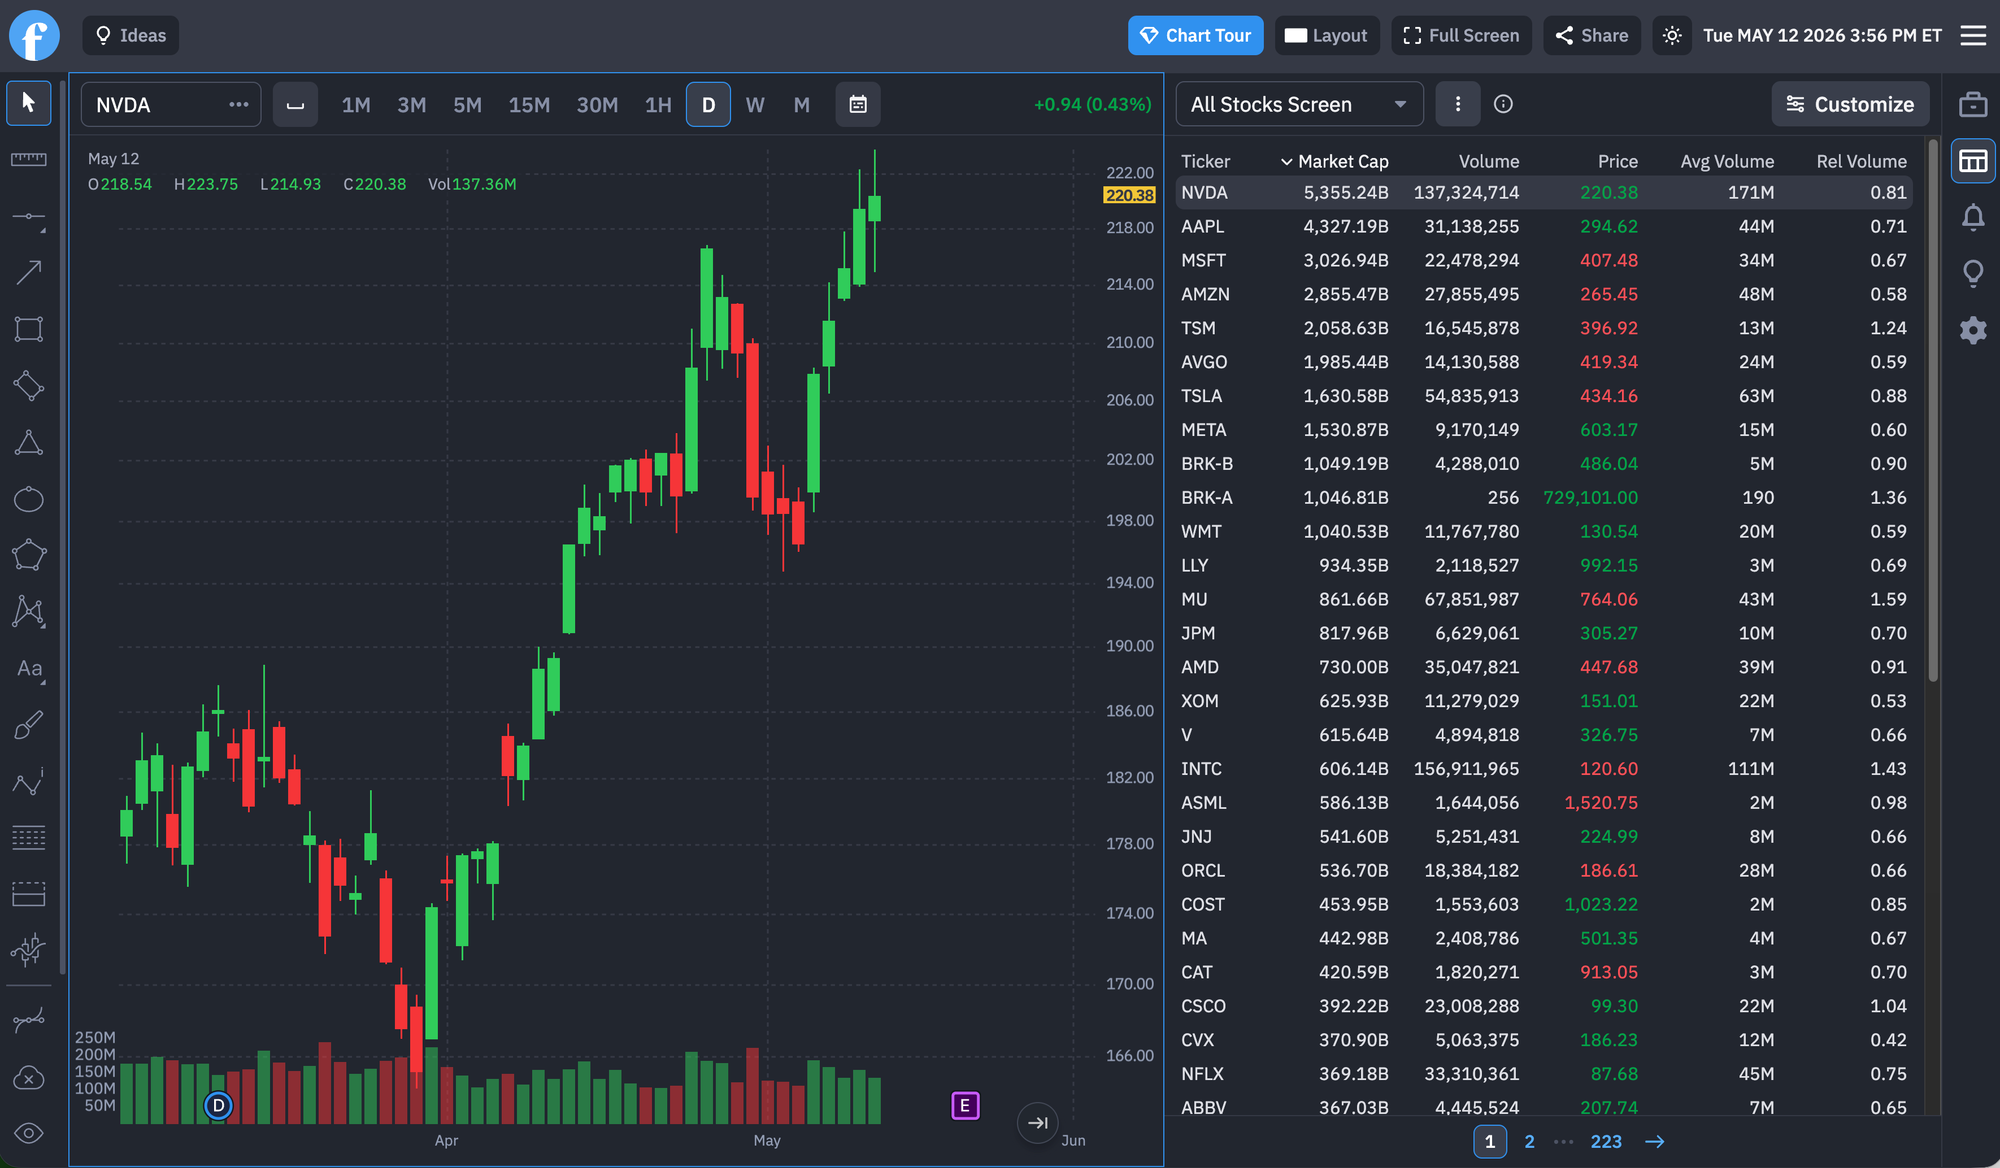
Finviz Screens and Charts
Previously, screens and charting lived in separate experiences – Screens here, and for Elite members, Advanced Charts here. Now, they can be used side-by-side as the workflow is unified into a single experience designed for speed, focus, and execution.
With the new Screener integration inside Advanced Charts, you can instantly pull up filtered lists of stocks directly from the right-side panel and analyze them without leaving the charting environment.
A Faster Trading Workflow
This update removes one of the biggest friction points in market research: constantly switching tabs from Screens and Charts. Here's how it now works:
- Create a stock screen and save it using our new Saving feature
- Open Advanced Charts
- Access the screen instantly from the side panel by clicking the screener icon
- Move through opportunities chart-by-chart in seconds or switch through your saved screens
For traders who analyze dozens or even hundreds of stocks per session, this creates a dramatically more efficient process. Check out this screenshot:
What’s New
Inside Advanced Charts, traders can now:
- Access stock screens directly from the chart layout
- Switch between screened tickers instantly by clicking a stock in the list and watching the chart update
- Create custom columns in the screen, sort them, reorder them, and build a workflow that matches your needs
- Save, edit, and manage your Screens and they'll instantly sync everywhere on Finviz, including the Advanced Charting interface
Built for Modern Market Research
Advanced Charts on Finviz were designed to combine clean visuals, speed, and actionable market intelligence.
Adding Screener integration directly into charts transforms the experience into a more complete research terminal where scanning and chart analysis work together seamlessly.
This update is especially useful for:
- Momentum traders
- Swing traders
- Breakout traders
- Day traders
- Long-term investors researching setups
- Traders monitoring earnings movers or unusual volume
We're excited to see how all the traders and investors globally use this new tool, and we'll have many more updates and features on the way.
Stay tuned!
Finviz team