|
|
|

|
|||||
|
|
|
Freight Delivery Company RXO (NYSE:RXO) fell short of the markets revenue expectations in Q4 CY2025, with sales falling 11.9% year on year to $1.47 billion. Its non-GAAP loss of $0.07 per share was 67.7% below analysts’ consensus estimates.
Is now the time to buy RXO? Find out by accessing our full research report, it’s free.
RXO Chairman and CEO Drew Wilkerson said, “In the fourth quarter, tightening in the freight market accelerated, driven by continued reductions in truckload capacity. This impacted our buy rates and squeezed our Brokerage gross margin. While demand remained soft, we have significant sales momentum. The Brokerage late-stage pipeline for new business grew by more than 50% year-over-year, and our Managed Transportation business was awarded more than $200 million of freight under management in the fourth quarter.”
With access to millions of trucks, RXO (NYSE:RXO) offers full-truckload, less-than-truckload, and last-mile deliveries.
Reviewing a company’s long-term sales performance reveals insights into its quality. Any business can put up a good quarter or two, but the best consistently grow over the long haul. Thankfully, RXO’s 11.3% annualized revenue growth over the last five years was impressive. Its growth beat the average industrials company and shows its offerings resonate with customers.
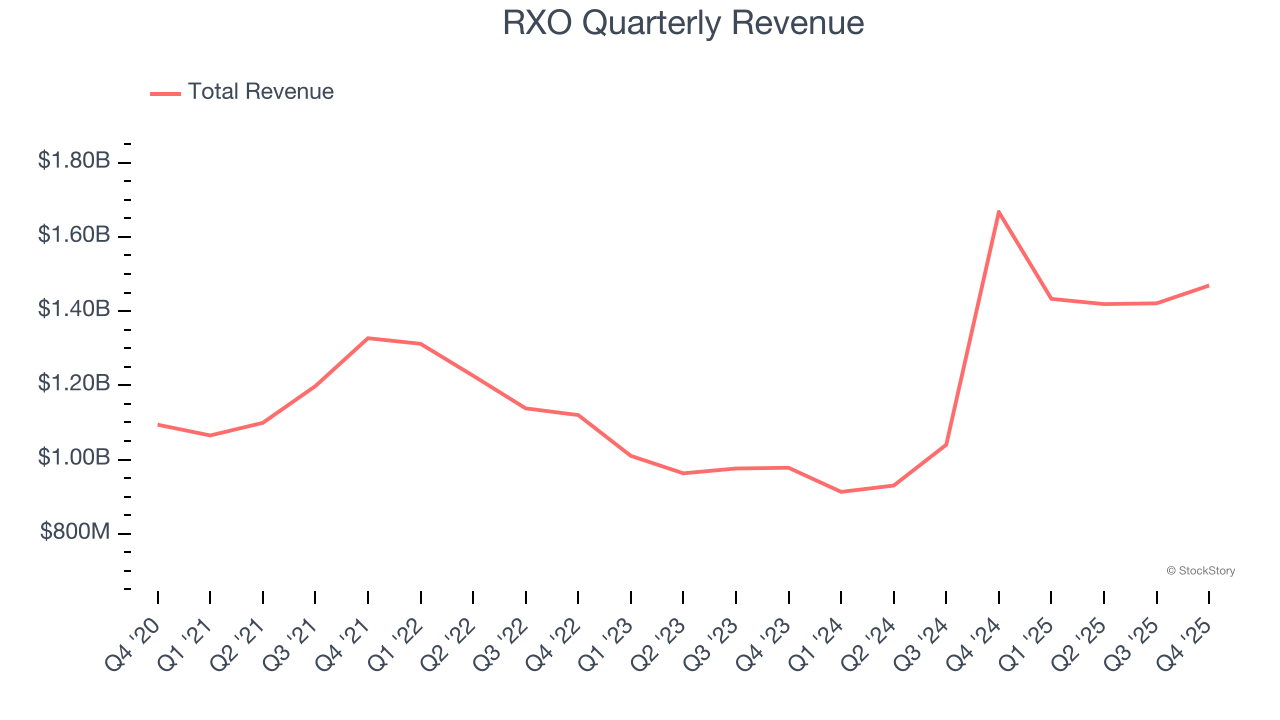
We at StockStory place the most emphasis on long-term growth, but within industrials, a half-decade historical view may miss cycles, industry trends, or a company capitalizing on catalysts such as a new contract win or a successful product line. RXO’s annualized revenue growth of 20.9% over the last two years is above its five-year trend, suggesting its demand was strong and recently accelerated.
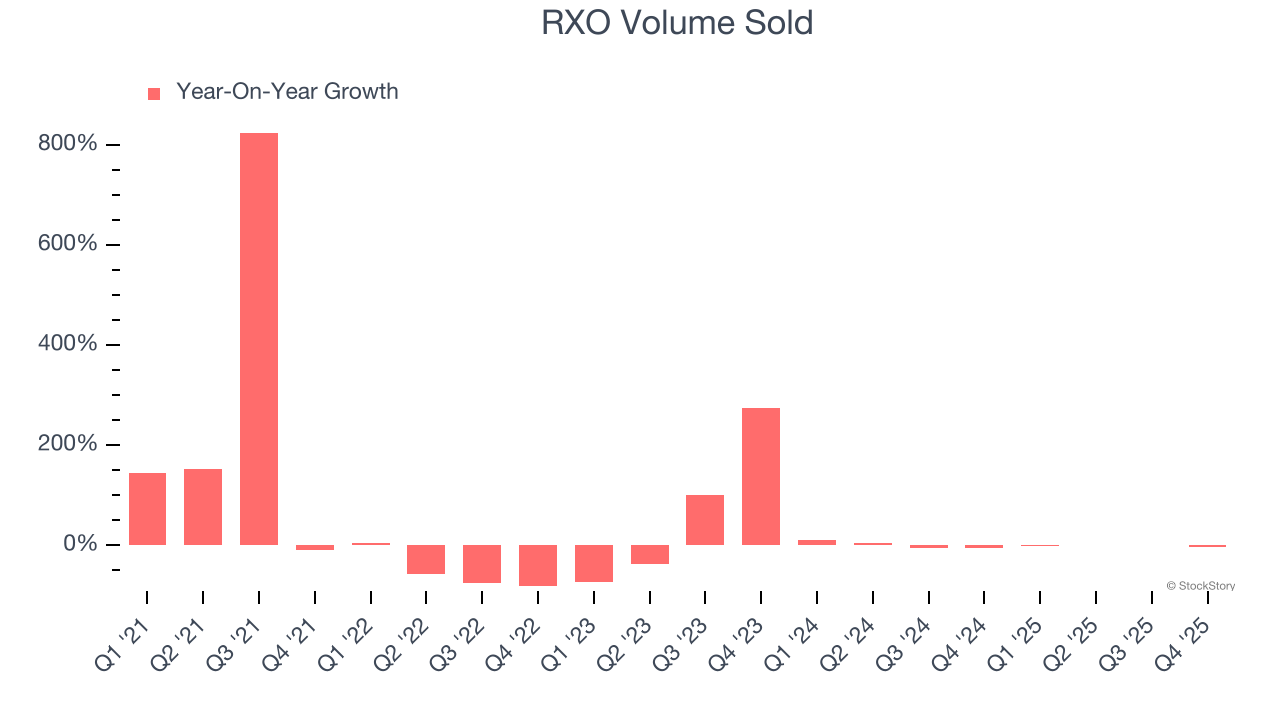
We can dig further into the company’s revenue dynamics by analyzing its number of units sold. Over the last two years, RXO’s units sold were flat. Because this number is lower than its revenue growth, we can see the company benefited from price increases.
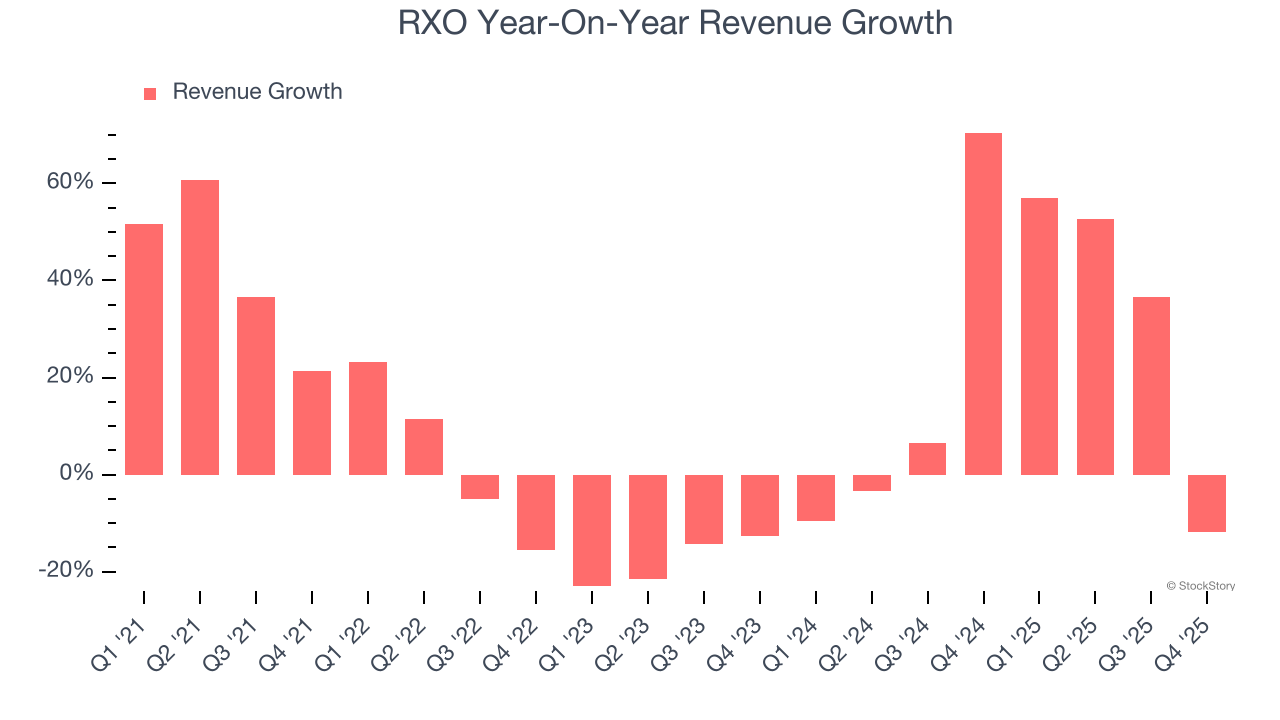
This quarter, RXO missed Wall Street’s estimates and reported a rather uninspiring 11.9% year-on-year revenue decline, generating $1.47 billion of revenue.
Looking ahead, sell-side analysts expect revenue to grow 2.7% over the next 12 months, a deceleration versus the last two years. This projection doesn't excite us and implies its products and services will see some demand headwinds.
Software is eating the world and there is virtually no industry left that has been untouched by it. That drives increasing demand for tools helping software developers do their jobs, whether it be monitoring critical cloud infrastructure, integrating audio and video functionality, or ensuring smooth content streaming. Click here to access a free report on our 3 favorite stocks to play this generational megatrend.
RXO was roughly breakeven when averaging the last five years of quarterly operating profits, inadequate for an industrials business. This result isn’t too surprising given its low gross margin as a starting point.
Looking at the trend in its profitability, RXO’s operating margin decreased by 5.3 percentage points over the last five years. This raises questions about the company’s expense base because its revenue growth should have given it leverage on its fixed costs, resulting in better economies of scale and profitability. RXO’s performance was poor no matter how you look at it - it shows that costs were rising and it couldn’t pass them onto its customers.
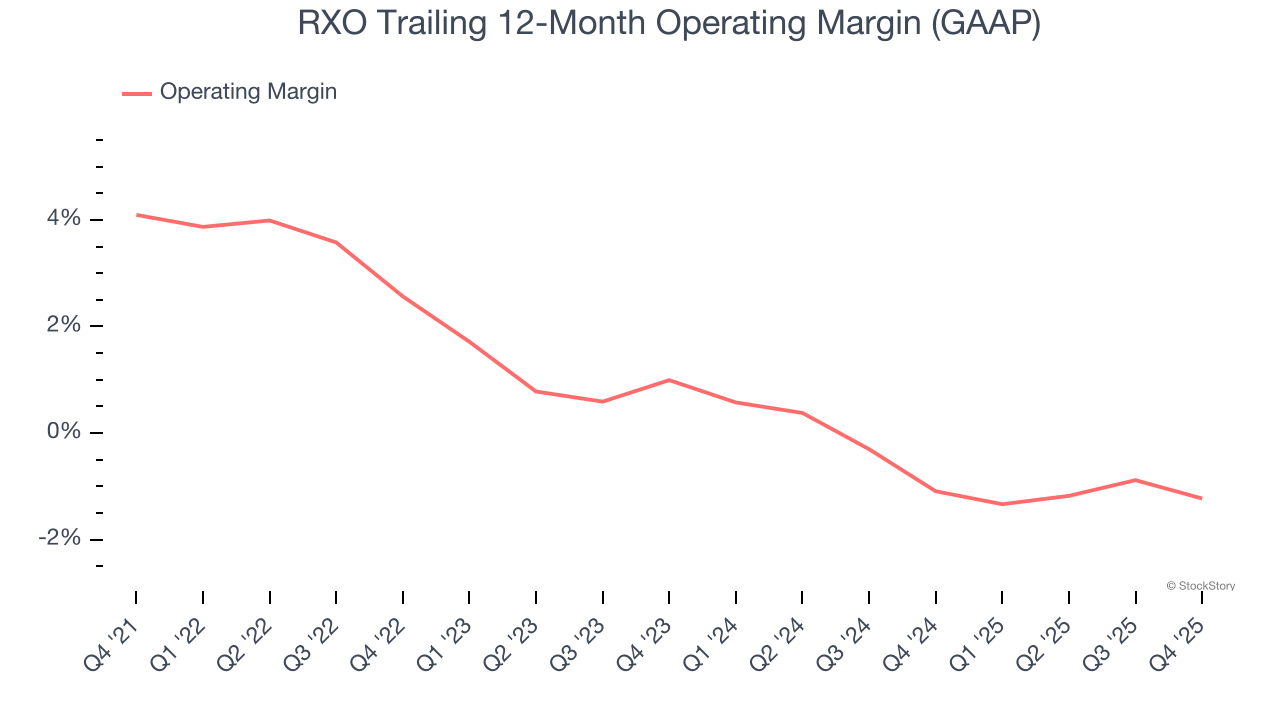
In Q4, RXO generated an operating margin profit margin of negative 2.9%, down 1.4 percentage points year on year. Since RXO’s operating margin decreased more than its gross margin, we can assume it was less efficient because expenses such as marketing, R&D, and administrative overhead increased.
We track the long-term change in earnings per share (EPS) for the same reason as long-term revenue growth. Compared to revenue, however, EPS highlights whether a company’s growth is profitable.
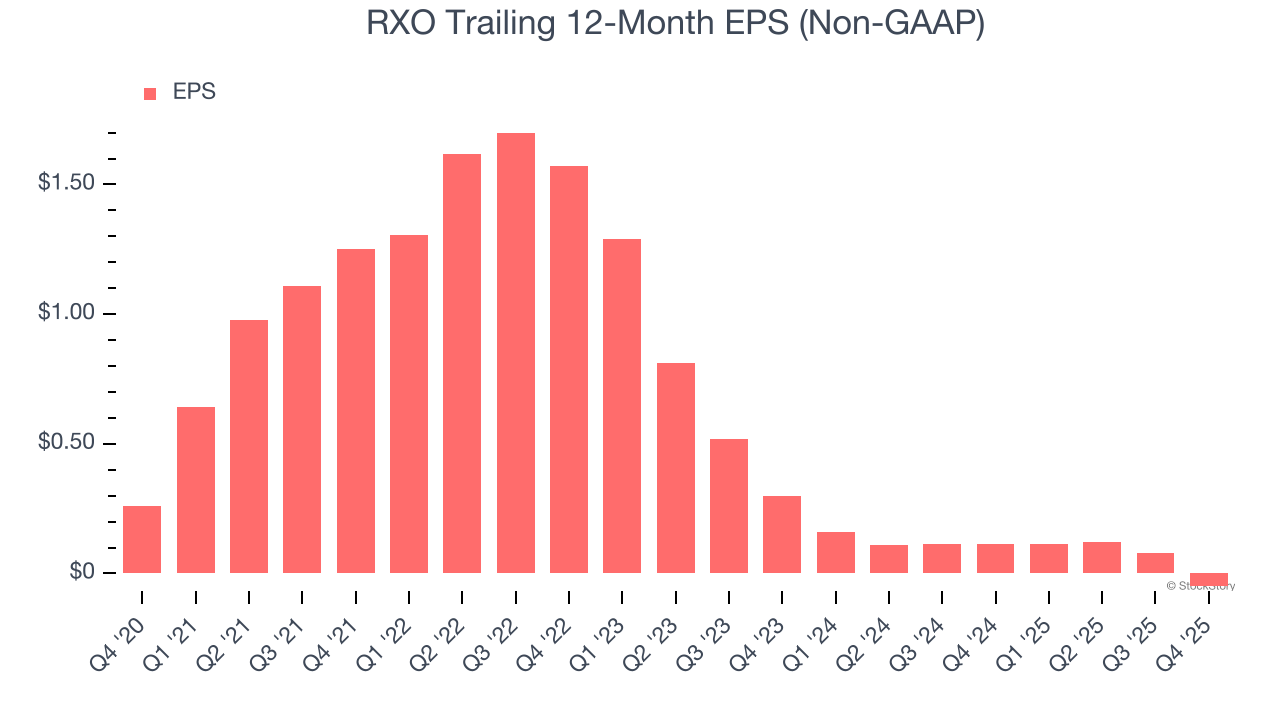
Sadly for RXO, its EPS declined by 17% annually over the last five years while its revenue grew by 11.3%. This tells us the company became less profitable on a per-share basis as it expanded.
Diving into the nuances of RXO’s earnings can give us a better understanding of its performance. As we mentioned earlier, RXO’s operating margin declined by 5.3 percentage points over the last five years. This was the most relevant factor (aside from the revenue impact) behind its lower earnings; interest expenses and taxes can also affect EPS but don’t tell us as much about a company’s fundamentals.
Like with revenue, we analyze EPS over a shorter period to see if we are missing a change in the business.
For RXO, its two-year annual EPS declines of 47.2% show it’s continued to underperform. These results were bad no matter how you slice the data.
In Q4, RXO reported adjusted EPS of negative $0.07, down from $0.06 in the same quarter last year. This print missed analysts’ estimates. Over the next 12 months, Wall Street is optimistic. Analysts forecast RXO’s full-year EPS of negative $0.05 will flip to positive $0.08.
We struggled to find many positives in these results. Its EBITDA missed and its EPS fell short of Wall Street’s estimates. Overall, this was a weaker quarter. The stock traded down 9% to $15.09 immediately after reporting.
RXO’s latest earnings report disappointed. One quarter doesn’t define a company’s quality, so let’s explore whether the stock is a buy at the current price. If you’re making that decision, you should consider the bigger picture of valuation, business qualities, as well as the latest earnings. We cover that in our actionable full research report which you can read here (it’s free).
| Jul-14 | |
| Jul-14 | |
| Jul-13 | |
| Jul-02 | |
| Jun-29 | |
| Jun-29 | |
| Jun-08 | |
| May-26 | |
| May-20 | |
| May-20 | |
| May-19 | |
| May-15 | |
| May-14 | |
| May-11 | |
| May-07 |
Join thousands of traders who make more informed decisions with our premium features. Real-time quotes, advanced visualizations, alerts, and much more.
Learn more about Finviz Elite