|
|
|

|
|||||
|
|
|
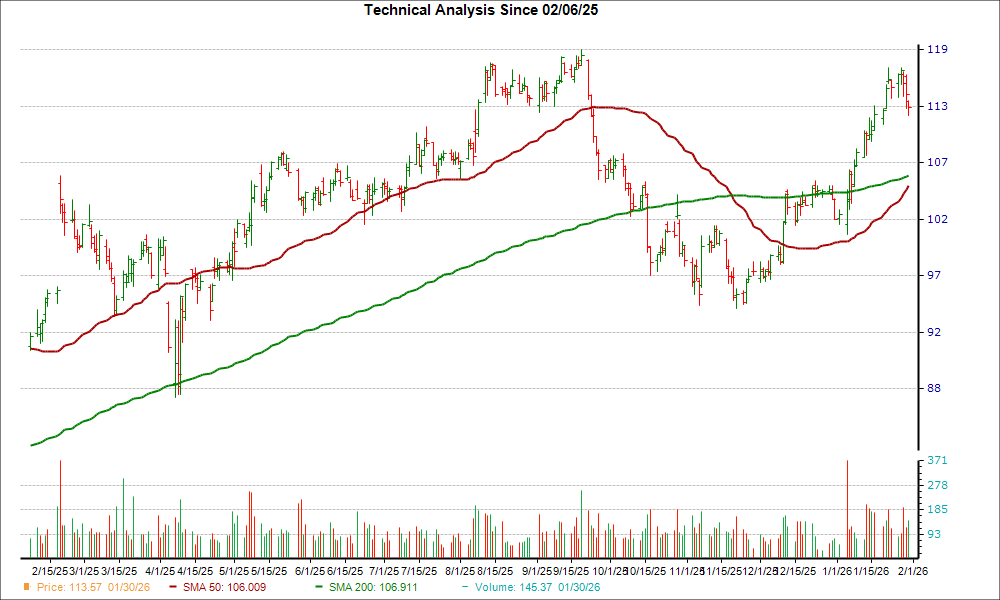
After reaching an important support level, RB Global, Inc. (RBA) could be a good stock pick from a technical perspective. RBA recently experienced a "golden cross" event, which saw its 50-day simple moving average breaking out above its 200-day simple moving average.
A golden cross is a technical chart pattern that can signify a potential bullish breakout. It's formed from a crossover involving a security's short-term moving average breaking above a longer-term moving average, with the most common moving averages being the 50-day and the 200-day, since bigger time periods tend to form stronger breakouts.
Golden crosses have three key stages that investors look out for. It starts with a downtrend in a stock's price that eventually bottoms out, followed by the stock's shorter moving average crossing over its longer moving average and triggering a trend reversal. The final stage is when a stock continues the upward climb to higher prices.
A golden cross contrasts with a death cross, another widely-followed chart pattern that suggests bearish momentum could be on the horizon.
RBA could be on the verge of a breakout after moving 6.6% higher over the last four weeks. Plus, the company is currently a #2 (Buy) on the Zacks Rank.
The bullish case only gets stronger once investors take into account RBA's positive earnings outlook for the current quarter. There have been 1 upward revision compared to none lower over the past 60 days, and the Zacks Consensus Estimate has moved up as well.
With a winning combination of earnings estimate revisions and hitting a key technical level, investors should keep their eye on RBA for more gains in the near future.
Want the latest recommendations from Zacks Investment Research? Today, you can download 7 Best Stocks for the Next 30 Days. Click to get this free report
This article originally published on Zacks Investment Research (zacks.com).
| Jul-07 | |
| Jun-23 | |
| May-27 | |
| May-18 | |
| May-05 | |
| May-04 | |
| May-01 | |
| Apr-23 | |
| Apr-08 | |
| Mar-16 | |
| Mar-09 | |
| Mar-04 | |
| Feb-26 | |
| Feb-23 | |
| Feb-18 |
Join thousands of traders who make more informed decisions with our premium features. Real-time quotes, advanced visualizations, alerts, and much more.
Learn more about Finviz Elite