Penske Automotive Group (NYSE:PAG) Posts Better-Than-Expected Sales In Q4 CY2025

Global automotive retailer Penske Automotive Group (NYSE:PAG) beat Wall Street’s revenue expectations in Q4 CY2025, but sales were flat year on year at $7.77 billion. Its GAAP profit of $2.83 per share was 6.4% below analysts’ consensus estimates.
Is now the time to buy Penske Automotive Group? Find out by accessing our full research report, it’s free.
Penske Automotive Group (PAG) Q4 CY2025 Highlights:
- Revenue: $7.77 billion vs analyst estimates of $7.60 billion (flat year on year, 2.2% beat)
- EPS (GAAP): $2.83 vs analyst expectations of $3.02 (6.4% miss)
- Adjusted EBITDA: $326 million vs analyst estimates of $347.1 million (4.2% margin, 6.1% miss)
- Operating Margin: 3.5%, in line with the same quarter last year
- Same-Store Sales fell 4% year on year (4.7% in the same quarter last year)
- Market Capitalization: $10.83 billion
Company Overview
With a diverse global network spanning the US, UK, Canada, Germany, Italy, Japan, and Australia, Penske Automotive Group (NYSE:PAG) operates automotive and commercial truck dealerships across the globe, selling new and used vehicles while providing service, parts, and financing options.
Revenue Growth
A company’s long-term sales performance can indicate its overall quality. Any business can put up a good quarter or two, but the best consistently grow over the long haul.
With $30.73 billion in revenue over the past 12 months, Penske Automotive Group is one of the larger companies in the consumer retail industry and benefits from a well-known brand that influences purchasing decisions. However, its scale is a double-edged sword because it’s harder to find incremental growth when you’ve penetrated most of the market. To expand meaningfully, Penske Automotive Group likely needs to tweak its prices or enter new markets.
As you can see below, Penske Automotive Group grew its sales at a sluggish 3.4% compounded annual growth rate over the last three years.
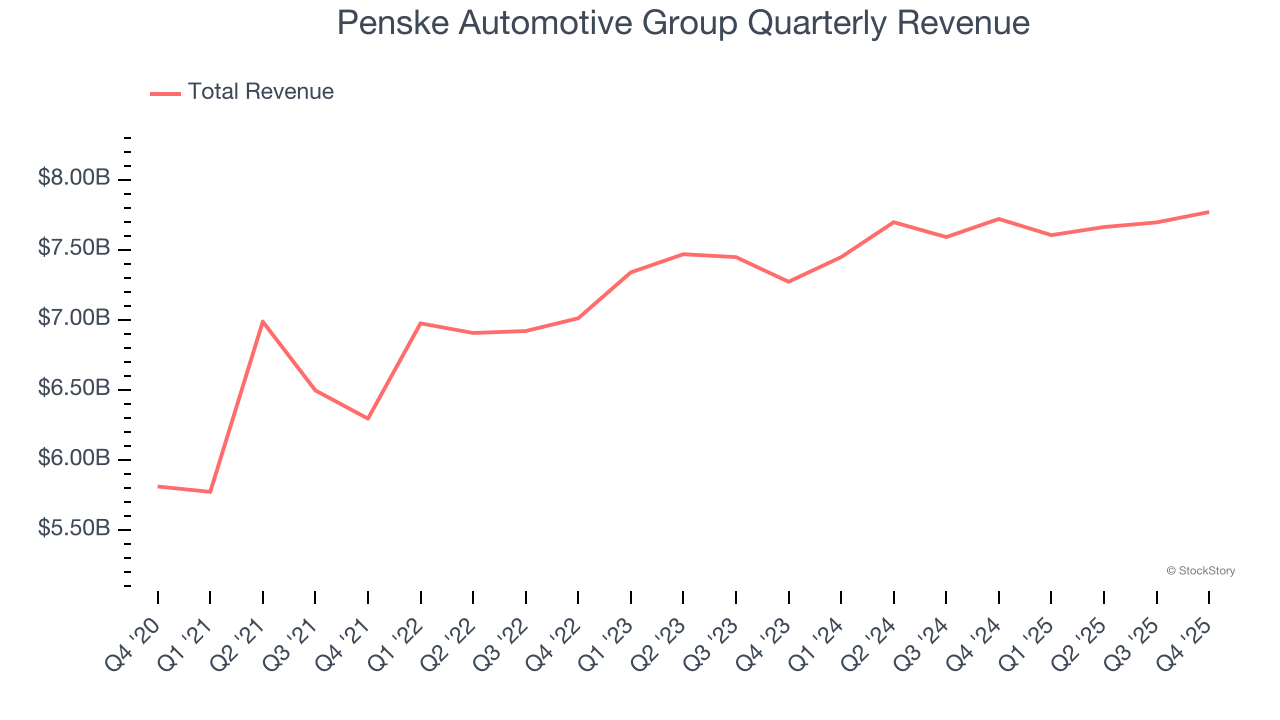
This quarter, Penske Automotive Group’s $7.77 billion of revenue was flat year on year but beat Wall Street’s estimates by 2.2%.
Looking ahead, sell-side analysts expect revenue to remain flat over the next 12 months, a slight deceleration versus the last three years. This projection doesn't excite us and implies its products will face some demand challenges.
While Wall Street chases Nvidia at all-time highs, an under-the-radar semiconductor supplier is dominating a critical AI component these giants can’t build without. Click here to access our free report one of our favorites growth stories.
Store Performance
Number of Stores
A retailer’s store count often determines how much revenue it can generate.
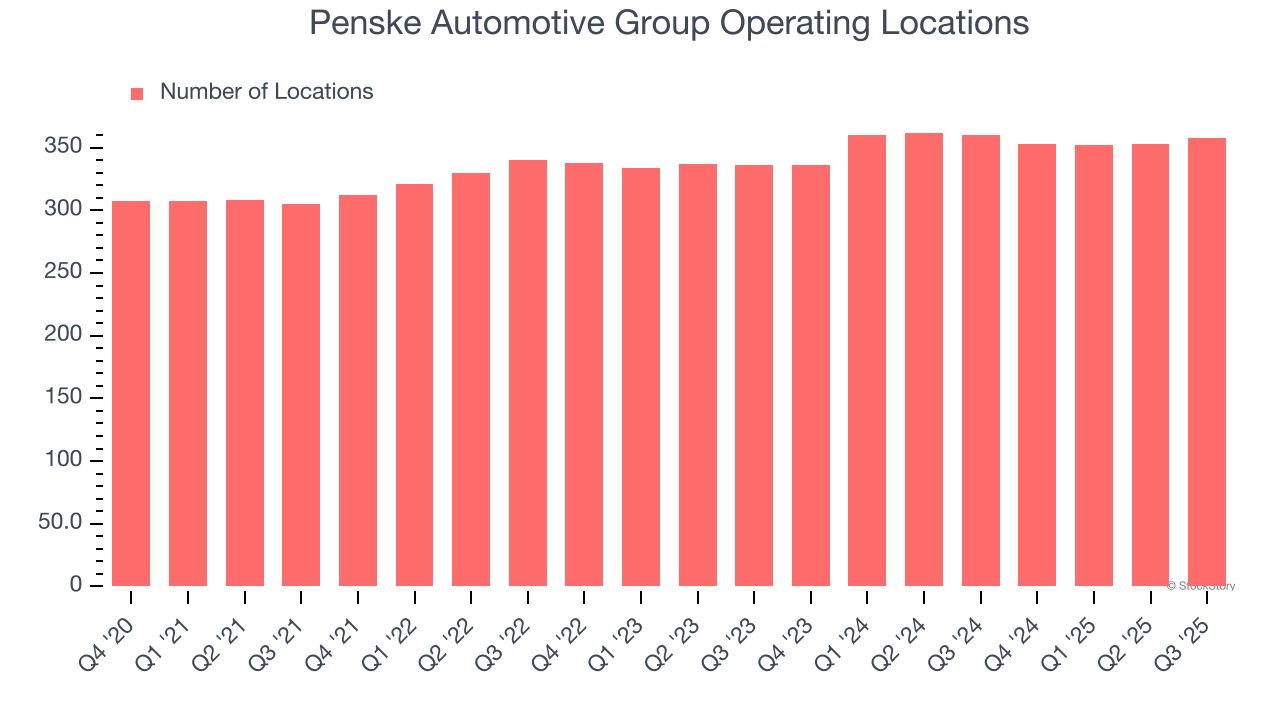
Penske Automotive Group opened new stores quickly over the last two years, averaging 3.1% annual growth, faster than the broader consumer retail sector.
When a retailer opens new stores, it usually means it’s investing for growth because demand is greater than supply, especially in areas where consumers may not have a store within reasonable driving distance.
Note that Penske Automotive Group reports its store count intermittently, so some data points are missing in the chart below.
Same-Store Sales
The change in a company's store base only tells one side of the story. The other is the performance of its existing locations and e-commerce sales, which informs management teams whether they should expand or downsize their physical footprints. Same-store sales is an industry measure of whether revenue is growing at those existing stores and is driven by customer visits (often called traffic) and the average spending per customer (ticket).
Penske Automotive Group’s demand within its existing locations has barely increased over the last two years as its same-store sales were flat. Penske Automotive Group should consider improving its foot traffic and efficiency before expanding its store base.
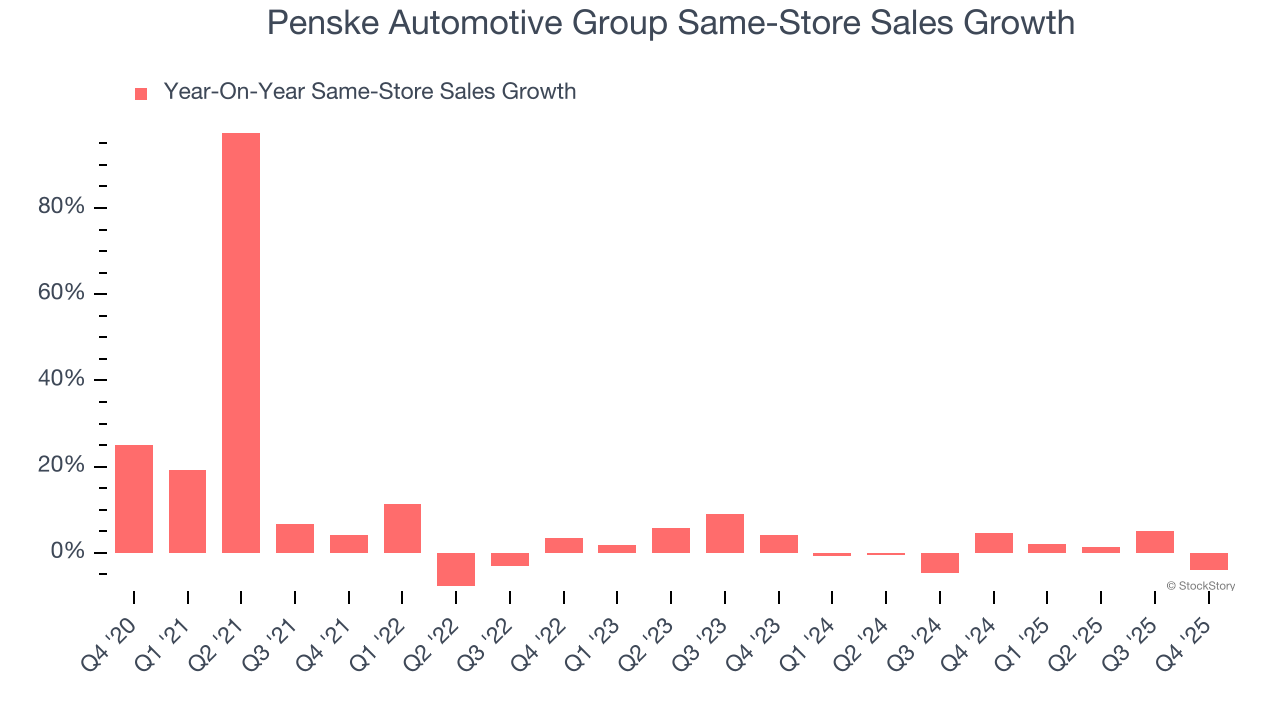
In the latest quarter, Penske Automotive Group’s same-store sales fell by 4% year on year. This decline was a reversal from its historical levels.
Key Takeaways from Penske Automotive Group’s Q4 Results
We enjoyed seeing Penske Automotive Group beat analysts’ revenue expectations this quarter. We were also happy its gross margin narrowly outperformed Wall Street’s estimates. On the other hand, its EBITDA missed and its same-store sales fell slightly short of Wall Street’s estimates. Overall, this was a weaker quarter. The stock remained flat at $164.40 immediately following the results.
Big picture, is Penske Automotive Group a buy here and now? We think that the latest quarter is only one piece of the longer-term business quality puzzle. Quality, when combined with valuation, can help determine if the stock is a buy. We cover that in our actionable full research report which you can read here (it’s free).
Mentioned In This Article
Latest News
| Oct-09 | |
| Oct-08 | |
| Oct-08 | |
| Sep-23 | |
| Aug-27 | |
| Aug-21 | |
| Aug-19 | |
| Aug-10 | |
| Aug-10 | |
| Jul-29 | |
| Jul-29 | |
| Jul-29 | |
| Jul-29 | |
| Jul-24 | |
| Jul-23 |
