|
|
|

|
|||||
|
|
|
The Home Depot Inc. HD has reported fourth-quarter fiscal 2025 results, wherein the bottom line beat the Zacks Consensus Estimate, while the top line missed the same. However, sales and earnings per share (EPS) declined year over year.
The decline in sales was primarily due to the absence of storm-related activity in the fiscal fourth quarter, which reduced demand in several key categories. Persistent consumer uncertainty and ongoing housing market pressure continued to weigh on home improvement spending, limiting the company’s ability to capture incremental demand in the quarter.
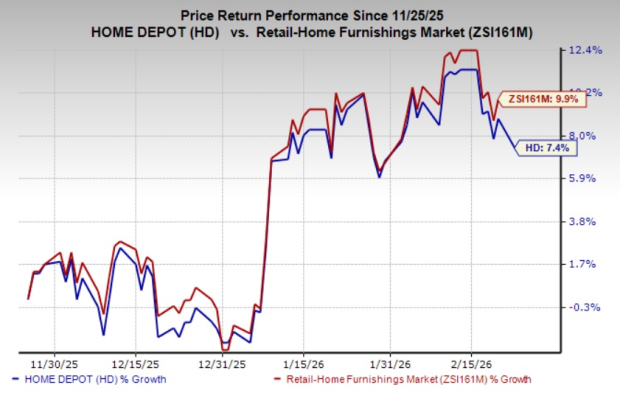
Shares of the Zacks Rank #3 (Hold) company lost 1.4% in the pre-market trading session mainly due to the unimpressive results and a modest earnings and margins outlook. The company’s shares have risen 7.4% in the past three months compared with the industry's 9.9% growth.
Home Depot's adjusted earnings of $2.72 per share decreased 13.1% from $3.13 in the year-ago quarter. However, the bottom line beat the Zacks Consensus Estimate of $2.52 per share.
Net sales declined 3.8% to $38.2 billion from $39.7 billion in the year-ago quarter and missed the Zacks Consensus Estimate of $38.3 billion. Sales in the quarter were pressured by a calendar shift, as the prior-year quarter included an extra week. The 14-week period in fourth-quarter fiscal 2024 contributed $2.5 billion in additional sales, creating a tougher year-over-year comparison for the current quarter. Comparable sales (comps) inched up 0.4% in the fourth quarter of fiscal 2025, with the U.S. comps rising 0.3%. Our model predicted consolidated comps growth of 0.3% for the fiscal fourth quarter.
Customer transactions were 366.5 million, down 8.5% year over year. Average ticket improved 2.4% year over year in the quarter under review.

The Home Depot, Inc. price-consensus-eps-surprise-chart | The Home Depot, Inc. Quote
In dollar terms, gross profit declined 4.4% year over year to $12.5 billion in the fiscal fourth quarter. The gross margin was 32.6%, down 20 basis points (bps) year over year. Our model predicted a 50-bps year-over-year decline in the gross margin to 32.3% for the fiscal fourth quarter.
SG&A expenses of $7.77 billion increased 0.6% from $7.73 billion in the year-ago quarter. As a percentage of sales, SG&A was 20.3%, up roughly 80 bps year over year.
Adjusted operating income was $4.02 billion, down 13.4% year over year, while the operating margin of 10.5% contracted 120 bps year over year.
Our model predicted the SG&A expense rate to increase 70 bps year over year to 20.2%. We anticipated the operating income to decline 15.7% year over year and the operating margin to contract 140 bps to 10.3% for the fiscal fourth quarter.
Home Depot ended fiscal 2025 with cash and cash equivalents of $1.4 billion, long-term debt (excluding current installments) of $46.3 billion, and stockholders’ equity of $12.8 billion. In fiscal 2025, the company generated $16.3 billion of net cash from operating activities.
The company’s board of directors approved a 1.3% increase in the quarterly dividend to $2.33 per share, bringing the annualized payout to $9.32 per share. The increased dividend will be paid out on March 26, 2026, to shareholders of record as of March 12, 2026. This marks the 156th consecutive quarter of cash dividend payments, underscoring the company’s long-standing commitment to returning capital to shareholders.
Management outlined its sales and EPS outlook for fiscal 2026. Home Depot anticipates sales to increase 2.5-4.5% year over year for fiscal 2026, with flat to 2% growth in comps.
HD estimates the gross margin for fiscal 2026 to be 33.1%, with an operating margin of 12.4-12.6%. The company expects an adjusted operating margin of 12.8-13%. HD plans to open 15 stores in fiscal 2026.
Home Depot expects net interest expenses of $2.3 billion for fiscal 2026, and the effective tax rate is anticipated to be 24.3%. The company anticipates a capital expenditure of 2.5% of total sales.
Home Depot anticipates both reported and adjusted EPS between flat and 4% year-over-year growth for fiscal 2026. In fiscal 2025, the company reported EPS of $14.23 and an adjusted EPS of $14.69.
Some better-ranked stocks are American Eagle Outfitters Inc. AEO, Williams-Sonoma Inc. WSM and Boot Barn Holdings Inc. BOOT.
American Eagle is a specialty retailer of casual apparel, accessories and footwear for men and women aged 15-25 years. It currently sports a Zacks Rank #1 (Strong Buy). You can see the complete list of today’s Zacks #1 Rank stocks here.
The Zacks Consensus Estimate for American Eagle’s fiscal 2025 sales indicates growth of 2.6%, from the year-ago reported number, while earnings suggest a year-over-year decline of 20.7%. AEO has a trailing four-quarter earnings surprise of 35.1%, on average.
Williams-Sonoma is a multi-channel specialty retailer of premium quality home products. It carries a Zacks Rank #2 (Buy) at present.
The Zacks Consensus Estimate for Williams-Sonoma’s fiscal 2025 sales indicates growth of 1.9% from the previous year’s reported figure, while the estimate for earnings suggests a year-over-year decline of 1%. WSM has a trailing four-quarter average earnings surprise of 8.6%.
Boot Barn operates as a lifestyle retail chain devoted to western and work-related footwear, apparel and accessories. It currently carries a Zacks Rank of 2.
The Zacks Consensus Estimate for Boot Barn’s current fiscal-year sales and earnings indicates growth of 17.6% and 26%, respectively, from the year-ago reported numbers. BOOT has a trailing four-quarter earnings surprise of 4.9%, on average.
Want the latest recommendations from Zacks Investment Research? Today, you can download 7 Best Stocks for the Next 30 Days. Click to get this free report
This article originally published on Zacks Investment Research (zacks.com).
| Jul-17 | |
| Jul-17 | |
| Jul-15 | |
| Jul-14 | |
| Jul-13 | |
| Jul-13 | |
| Jul-10 | |
| Jul-10 | |
| Jul-10 | |
| Jul-10 | |
| Jul-10 | |
| Jul-09 | |
| Jul-08 | |
| Jul-08 | |
| Jul-08 |
Join thousands of traders who make more informed decisions with our premium features. Real-time quotes, advanced visualizations, alerts, and much more.
Learn more about Finviz Elite