|
|
|

|
|||||
|
|
|
Subscribers to Chart of the Week received this commentary on Sunday, April 19.
There are so many fun nuggets to unearth from this historic Nasdaq Composite (IXIC) win streak. With the help of Senior Quantitative Analyst Rocky White, let’s try to unpack them all, because within the data are some conclusions that can prepare investors for a possibly war-free yet still uncertainty-ridden future.
First, some history. The last time the Nasdaq was on a streak like this (January 1992), I was three years old.
The gains wrought from the streak weren’t just little dink and dunks. It wasn’t death (to bears) by a thousand cuts. Instead, a 3.8% melt up on March 31 set the tone. Since then, there have been six more instances of a 1% or greater move, including Friday’s 1.4% gap.
Here are the longest Nasdaq win streaks in history, sent before the open on Friday:
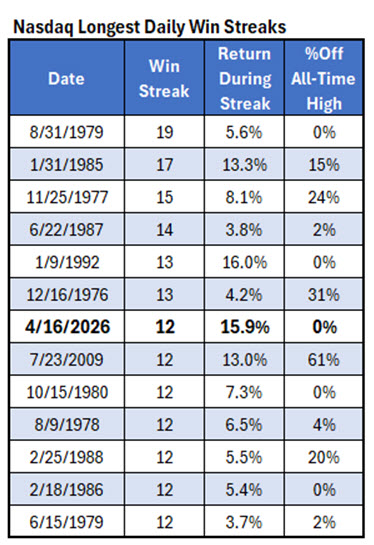
This is not only a historically-long streak, it’s a historically-productive one. The streaks from the 70s and 80s were so incremental. Imagine being positive for 19 straight days yet only up 5.6% over that time frame.
The Nasdaq blew past 22,000 in four days. It blew past 23,000 in two! Not since the Liberation Day lows has there been that quick of a 1,000-point move.
This was the Nasdaq’s best 13-day start to a quarter in history. The only one close was the Covid rally from Q2 of 2020.
Advanced Micro Devices (AMD) was in lockstep with the Nasdaq every step of the way, the 13-day win streak its longest run since May 2005. AMD was trading around $20 back then.
This current run culminated in a record high of $281.05 on Friday, during which AMD added over $101 billion in market cap.
Intel (INTC) and Nvidia (NVDA) rattled off respective nine and 10-day heaters, and the iShares Semiconductor ETF (SOXX) ran out of gas only on Thursday.
Rocky’s got the data to help plan ahead.
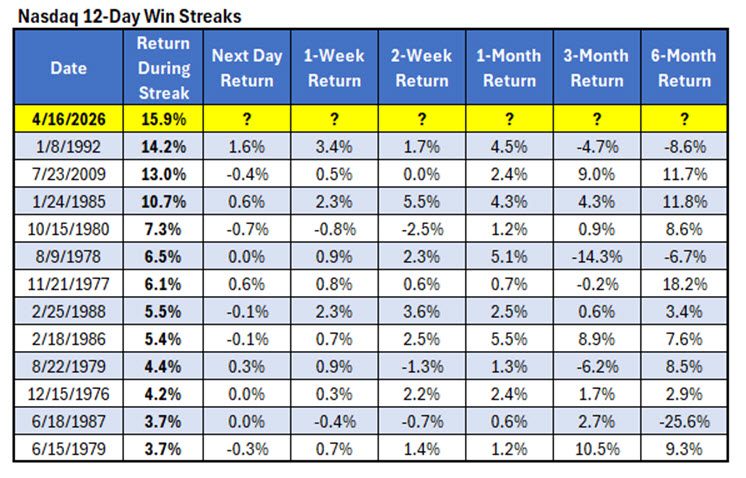
2009 is the best litmus test, but even that’s ancient history. The upside is still there though; the Nasdaq was higher across one, three, and six-month returns.
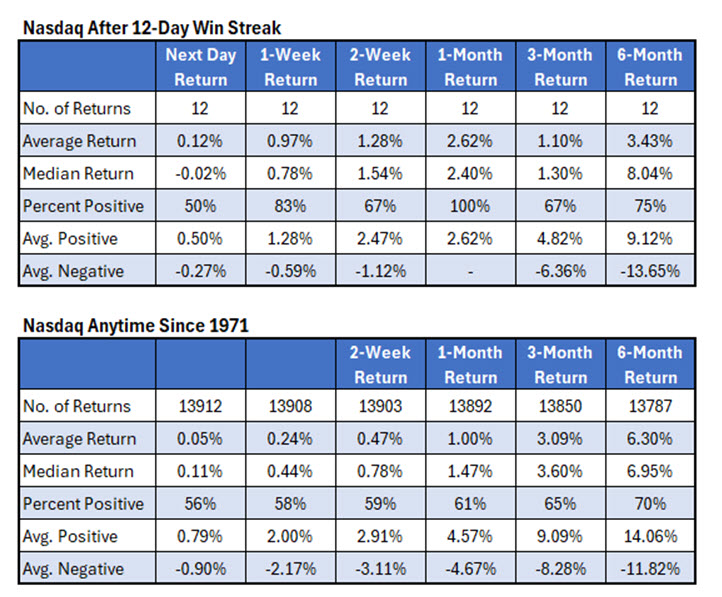
One and two weeks later, streaks result in bullish returns that outpace anytime, but the average anytime returns eventually overtake the streak after that. The most important takeaway is that the Nasdaq doesn’t completely pack it in and drive off a cliff after these runs.
The sample size discrepancy bothered me a little, so I had Rocky pull the data for 11-day win streaks as well.
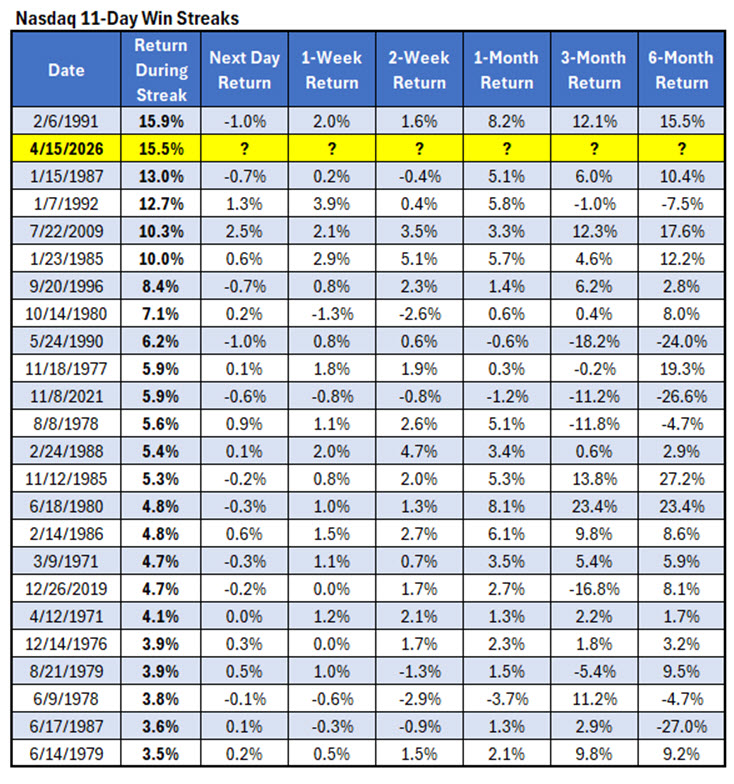
Twenty-four instances are a larger sample size, and the most exciting part? When the streak was 11 days and the return during the streak was at least 10%, looking at one-month returns, there were five returns, all positive, ranging from 3.3% to 8.2% with an average of 5.6%.
Because I cannot enjoy things for too long, the next thought in my brain after seeing the Nasdaq gap higher on Friday was:
Click Here to view the rest on Schaeffer’s Substack!
| 14 min | |
| 23 min | |
| 1 hour | |
| 1 hour | |
| 1 hour | |
| 2 hours | |
| 2 hours | |
| 2 hours | |
| 2 hours | |
| 2 hours | |
| 2 hours | |
| 2 hours | |
| 3 hours | |
| 3 hours | |
| 3 hours |
Join thousands of traders who make more informed decisions with our premium features. Real-time quotes, advanced visualizations, alerts, and much more.
Learn more about Finviz Elite