|
|
|

|
|||||
|
|
|
LUXEMBOURG / ACCESS Newswire / May 5, 2026 / Ternium S.A. (NYSE:TX) today announced its results for the first quarter ended March 31, 2026.
The financial information contained in this press release is based on Ternium S.A.'s consolidated condensed interim financial statements prepared in accordance with IAS 34 "Interim financial reporting" (IFRS). Interim financial figures are unaudited. The financial and operational information is presented in U.S. Dollars ($) and metric tons, except otherwise indicated. This press release includes certain non-IFRS alternative performance measures such as Adjusted EBITDA, Cash Operating Income, Free Cash Flow and Net Cash. The reconciliation of these figures to the most directly comparable IFRS measures is included in Exhibit I.
First Quarter of 2026 Highlights
Note: Figures compared to fourth quarter of 2025.
Summary of First Quarter of 2026
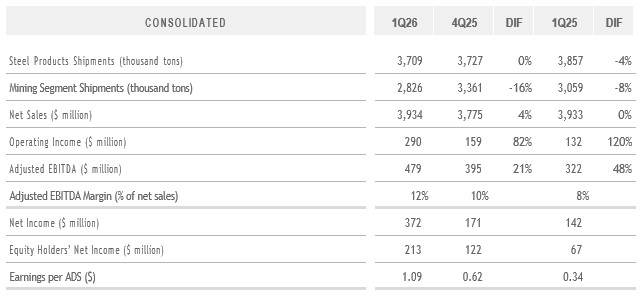
Note: Each American Depositary Share, or ADS, represents 10 shares of Ternium's common stock. Results are based on a weighted average number of shares of common stock outstanding (net of treasury shares) of 1,963,076,776.
First Quarter of 2026 Highlights
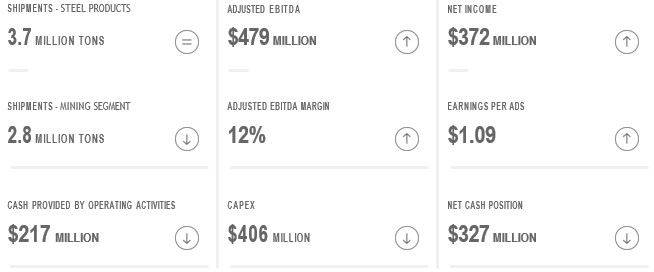
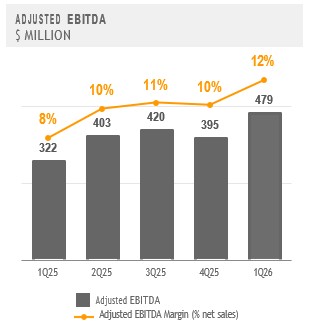
Ternium's Adjusted EBITDA increased sequentially by 21% in the first quarter of 2026, to $479 million. This improvement was primarily driven by higher realized steel prices across the company's main steel markets, partially offset by higher raw material and purchased slab costs. Sales volumes in Mexico gathered pace, supported by better fundamentals in the commercial market. In Brazil, the steel business climate has improved, following the trade measures introduced by the government to promote a balanced competitive environment. Meanwhile, demand in the Southern Region eased, reflecting both a slowdown in Argentina's economic activity and seasonal consumption patterns.
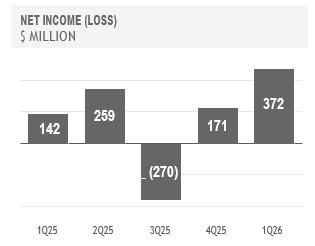
Ternium's net income in the first quarter of 2026 reached $372 million. This result includes deferred tax gains amounting to $132 million and a $48 million loss stemming from the quarterly update of the value of a provision for ongoing litigation related to the acquisition of a participation in Usiminas in 2012.
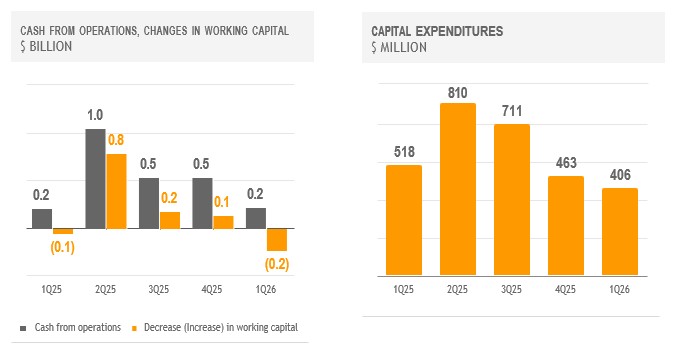
Ternium invested $406 million in the first quarter of 2026, primarily for the expansion of its industrial center in Pesquería, Mexico. The company completed the downstream expansion of the facility and advanced as planned with the ramp-up of a new cold-rolling mill and a new galvanizing line, while also progressing with its upstream expansion program. In this regard, Ternium expects to commence operations in the new steel shop by the end of the year. In addition, the company finalized the previously announced acquisition of 153.1 million ordinary shares of Usiminas from Nippon Steel Corporation and Mitsubishi Corporation for a total consideration of $315 million.
Cash flow from operating activities amounted to $217 million after a $233 million increase in working capital, mostly related to higher trade receivables. Furthermore, Ternium received $150 million from Techgen, a power producer in which it holds a non-controlling interest, following the full repayment and cancellation of its loan.
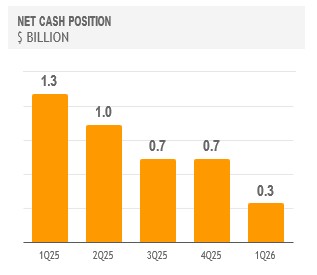
The company's net cash position stood at $327 million at the end of March 2026, compared to $712 million at the end of December 2025.
Outlook
Ternium expects Adjusted EBITDA to increase in the second quarter of 2026 compared to the first quarter, driven by higher shipments and improved margins. Shipments are expected to rise primarily in Mexico and Argentina. Higher revenue per ton, especially in Mexico and Brazil, is anticipated to support the increase in Adjusted EBITDA margin, while higher costs per ton across Ternium's markets should partially offset these gains.
In Mexico, the company expects continued growth in commercial market shipments during the second quarter of 2026, as a significant destocking in the value chain throughout 2025 is giving way to a normalization of apparent demand. In addition, several infrastructure projects are beginning to progress and could contribute additional demand in the coming quarters.
In Brazil, steel consumption remains broadly stable, with resilience in the automotive sector offset by weaker demand in agribusiness-related industries. The government has taken initial measures to defend the local industry against unfair trade, including antidumping duties on cold-rolled and coated products. As these measures gain traction and currently elevated inventory levels of imported material normalize, Usiminas' shipments should begin to improve.
In Argentina, after an initial recovery in 2025, demand in 2026 is growing unevenly. Mining, energy, and agriculture continue to perform well, while construction is improving slightly but remains soft. Metal-mechanical and home appliance sectors are lagging, affected by weak domestic consumption and increased competition from imports.
Analysis of First Quarter of 2026 Results
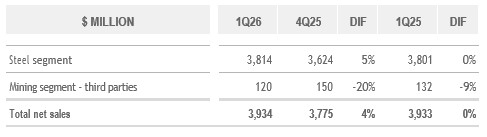
Consolidated Net Sales
Adjusted EBITDA
Adjusted EBITDA in the first quarter of 2026 equals Net Income adjusted to exclude:
Depreciation and amortization;
Income tax results;
Net financial results;
Equity in earnings of non-consolidated companies; and
Provision for ongoing litigation related to the acquisition of a participation in Usiminas.
And adjusted to include the proportional EBITDA in Unigal (70% participation).
Adjusted EBITDA margin equals adjusted EBITDA divided by net sales.
For more information see Exhibit I - Alternative performance measures - "Adjusted EBITDA".
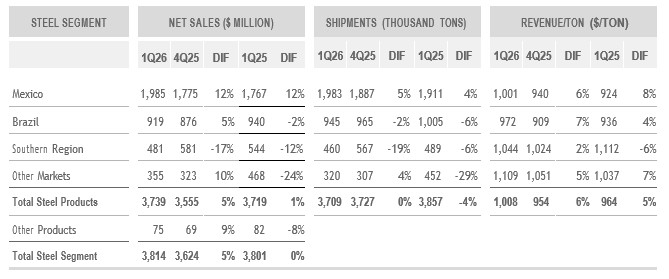
Steel Segment First Quarter of 2026 Results
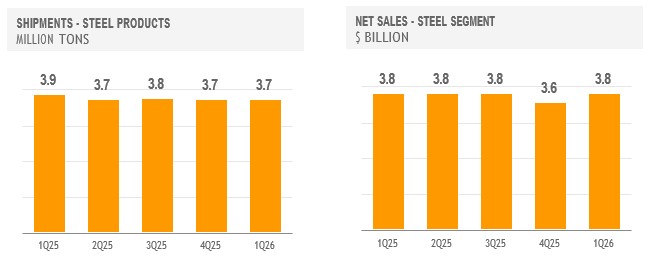
The Steel Segment's net sales increased sequentially in the period mainly as a result of better realized steel prices across Ternium's main steel markets.
On a year-over-year basis, net sales were almost unchanged, as higher realized steel prices were offset by a decline in shipments.
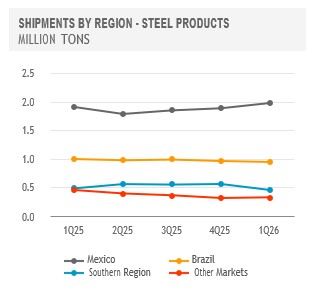
In Mexico, steel shipments increased, with a significant level of activity in the commercial market as a result of more effective defenses against unfairly traded imports, balanced inventories in the value chain and a seasonal rebound in activity.
In Brazil, Usiminas has prioritized profitability over shipment volumes, amid a more volatile scenario for energy and transportation costs. Consequently, steel shipments in the first quarter of 2026 recorded a modest sequential decline.
In the Southern Region, demand for steel products has moderated, reflecting slower activity in Argentina's industrial sector. Additionally, steel shipments fell sequentially in the first quarter of 2026 consistent with seasonally weaker activity.
In Other Markets, shipments in the first quarter of 2026 remained relatively unchanged sequentially, while they declined year-over-year mainly reflecting lower sales in the US market.
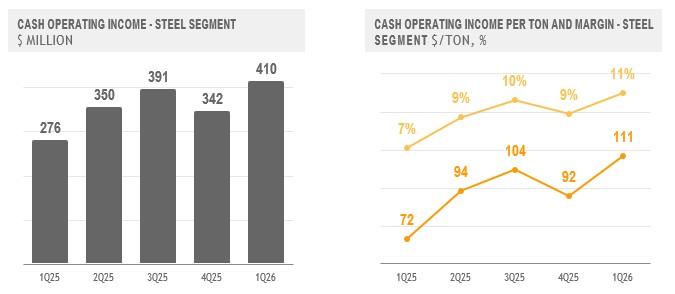
The Steel Segment's Cash Operating Income increased by $68 million sequentially in the first quarter of 2026, mainly reflecting an increase in realized steel prices that was partially offset by higher raw material and purchased slab costs.
Year-over-year, the Steel Segment's Cash Operating Income increased by $134 million in the quarter, as higher margins were partially offset by lower shipments. The margin expansion was supported by higher realized steel prices and lower unit costs. The year-over-year cost reduction reflected both lower raw material and purchased slab prices, as well as the positive impact of the company's continuous efforts to improve efficiency.
Note: For a reconciliation of the Steel Segment's Cash Operating Income and Cash Operating Income per Ton and Margin to the most directly comparable IFRS measures, see Exhibit I - Alternative performance measures - "Cash Operating Income - Steel Segment".
Mining Segment First Quarter of 2026 Results
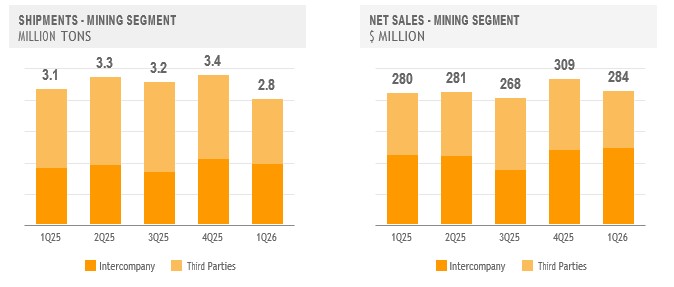
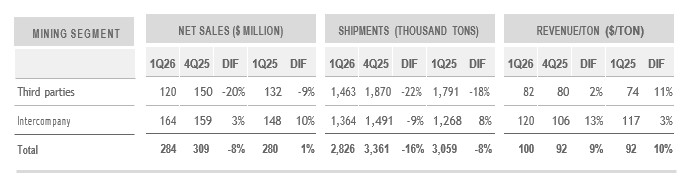
Net sales in the Mining Segment declined sequentially in the first quarter of 2026 driven by lower sales volumes, amid unusually intense rains affecting operations in Brazil, partially offset by higher revenue per ton.
On a year-over-year basis, net sales posted a slight increase, as higher revenue per ton was largely offset by reduced shipment volumes.
The Mining Segment's Cash Operating Income increased sequentially and year-over-year in the first quarter of 2026, supported by higher realized iron ore prices. This was partially offset by lower sales volumes and higher unit costs.
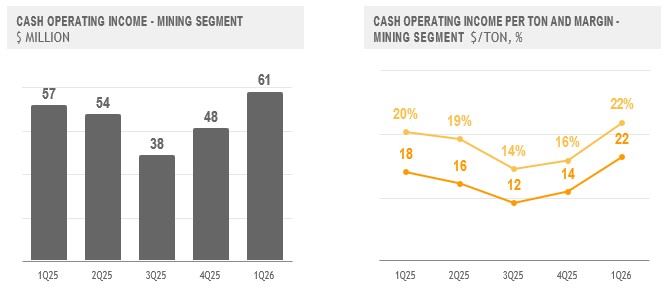
Note: For a reconciliation of the Mining Segment's Cash Operating Income and Cash Operating Income per Ton and Margin to the most directly comparable IFRS measures, see Exhibit I - Alternative performance measures - "Cash Operating Income - Mining Segment".
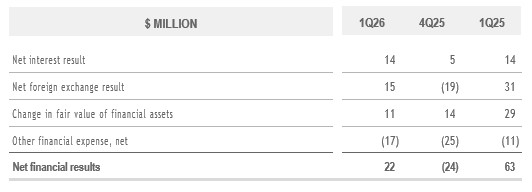
Net Financial Results
Net financial results were a gain of $22 million for the first quarter of 2026, primarily driven by the positive performance of Ternium's financial investments and foreign exchange results. Foreign exchange gains were mainly related to the positive effect of the appreciation of the Brazilian Real and the Mexican Peso against the US Dollar on net long local currency positions at Ternium Brasil and Ternium Mexico, respectively.
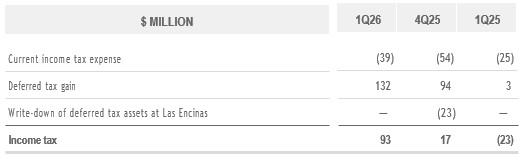
Income Tax Results
Ternium's subsidiaries use the U.S. dollar as their functional currency; as a result, fluctuations between their local currencies and the U.S. dollar lead to the recognition of deferred tax results.
The company recorded a deferred tax gain of $132 million in the first quarter of 2026. This was mainly driven by a reduction in the deferred tax position of Ternium Argentina, reflecting the impact of high local inflation and the appreciation of the Argentine Peso against the US Dollar, as well as a decrease in the deferred tax position of Usiminas, primarily due to the appreciation of the Brazilian Real against the US Dollar.
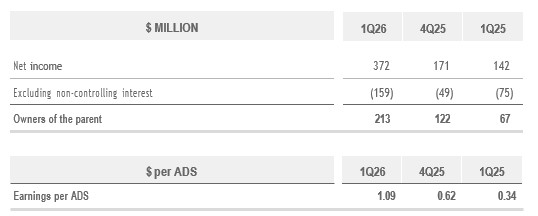
Net Result
In the first quarter of 2026, Ternium's net income amounted to $372 million, including a deferred tax gain of $132 million and a loss of $48 million in connection with the provision for ongoing litigation concerning the acquisition of a participation in Usiminas, on account of interest accruals and the appreciation of the Brazilian Real.
Equity Holder's Net Income was $213 million in the period, or $1.09 per ADS, mainly after accounting for the participation of a 62.5% non-controlling interest in Usiminas and a 37.4% non-controlling interest in Ternium Argentina.
Cash Flow and Liquidity
In the first quarter of 2026, cash from operations amounted to $217 million. Working capital increased by $233 million reflecting a $174 million net increase in trade and other receivables and a $70 million increase in inventories, partially offset by a $11 million net increase in trade payables and other liabilities.
Capital expenditures totaled $406 million, primarily reflecting the progress made in the construction of the new facilities at Ternium's industrial center in Pesquería, Mexico. The company completed the facilities' downstream expansion, with start-up of a new cold rolling mill and a new galvanizing facility, and advanced the construction of a new steel shop.
Alongside the development of its capital expenditure program, in the first quarter of 2026 Ternium acquired 153.1 million ordinary shares of Usiminas for a total consideration of $315 million. In addition, the company received $150 million from Techgen in connection with the full repayment and cancellation of its loan. Techgen is a joint venture company in which Ternium participates together with its affiliates Tenaris and Tecpetrol. It supplies electricity to the company's facilities through a 900-megawatt power plant located in Pesquería, Mexico.
The company's Net Cash position decreased to $327 million at the end of March 2026, compared to Net Cash position of $712 million as of the end of December 2025.
Conference Call and Webcast
Ternium will host a conference call on May 6, 2026, at 8:00am ET in which management will discuss first quarter of 2026 results. A webcast link will be available in the Investor Center section of the company's website at www.ternium.com.
Forward Looking Statements
Some of the statements contained in this press release are "forward-looking statements". Forward-looking statements are based on management's current views and assumptions and involve known and unknown risks that could cause actual results, performance or events to differ materially from those expressed or implied by those statements. These risks include but are not limited to risks arising from uncertainties as to gross domestic product, related market demand, global production capacity, tariffs, cyclicality in the industries that purchase steel products, and other factors beyond Ternium's control.
About Ternium
Ternium is a leading steel producer in the Americas, providing advanced steel products to a wide range of manufacturing industries and the construction sector. We invest in low carbon emissions steelmaking technologies to support the energy transition and the mobility of the future. We also support the development of our communities, especially through educational programs in Latin America. More information about Ternium is available at www.ternium.com.
Income Statement
$ MILLION |
| 1Q26 |
|
| 4Q25 |
|
| 1Q25 |
| |||
Net sales |
|
| 3,934 |
|
|
| 3,775 |
|
|
| 3,933 |
|
Cost of sales |
|
| (3,247 | ) |
|
| (3,171 | ) |
|
| (3,402 | ) |
Gross profit |
|
| 687 |
|
|
| 604 |
|
|
| 531 |
|
Selling, general and administrative expenses |
|
| (390 | ) |
|
| (406 | ) |
|
| (396 | ) |
Other operating expense, net |
|
| (7 | ) |
|
| (39 | ) |
|
| (3 | ) |
Operating income |
|
| 290 |
|
|
| 159 |
|
|
| 132 |
|
Financial expense |
|
| (50 | ) |
|
| (50 | ) |
|
| (54 | ) |
Financial income |
|
| 64 |
|
|
| 56 |
|
|
| 68 |
|
Other financial income (expense), net |
|
| 9 |
|
|
| (29 | ) |
|
| 49 |
|
Equity in earnings of non-consolidated companies |
|
| 14 |
|
|
| 20 |
|
|
| 16 |
|
Provision for ongoing litigation related to the acquisition of a participation in Usiminas |
|
| (48 | ) |
|
| (1 | ) |
|
| (45 | ) |
Profit before income tax results |
|
| 279 |
|
|
| 155 |
|
|
| 165 |
|
Income tax |
|
| 93 |
|
|
| 17 |
|
|
| (23 | ) |
Profit for the period |
|
| 372 |
|
|
| 171 |
|
|
| 142 |
|
Attributable to: |
|
|
|
|
|
|
|
|
|
|
|
|
Owners of the parent |
|
| 213 |
|
|
| 122 |
|
|
| 67 |
|
Non-controlling interest |
|
| 159 |
|
|
| 49 |
|
|
| 75 |
|
Profit for the period |
|
| 372 |
|
|
| 171 |
|
|
| 142 |
|
Statement of Financial Position
$ MILLION |
| MARCH 31, 2026 |
|
| DECEMBER 31, 2025 |
| ||
Property, plant and equipment, net |
|
|
|
|
|
|
|
|
Intangible assets, net |
|
| 1,007 |
|
|
| 1,002 |
|
Investments in non-consolidated companies |
|
| 590 |
|
|
| 563 |
|
Other investments |
|
| 0 |
|
|
| 0 |
|
Deferred tax assets |
|
| 1,216 |
|
|
| 1,039 |
|
Receivables, net |
|
| 778 |
|
|
| 804 |
|
Trade receivables, net |
|
| 5 |
|
|
| 4 |
|
Total non-current assets |
|
| 14,306 |
|
|
| 13,819 |
|
Receivables, net |
|
| 784 |
|
|
| 985 |
|
Derivative financial instruments |
|
| 25 |
|
|
| 43 |
|
Inventories, net |
|
| 4,173 |
|
|
| 4,094 |
|
Trade receivables, net |
|
| 1,804 |
|
|
| 1,536 |
|
Other investments |
|
| 1,525 |
|
|
| 1,600 |
|
Cash and cash equivalents |
|
| 1,617 |
|
|
| 1,531 |
|
Total current assets |
|
| 9,928 |
|
|
| 9,788 |
|
Non-current assets classified as held for sale |
|
| 8 |
|
|
| 8 |
|
Total assets |
|
| 24,242 |
|
|
| 23,615 |
|
Statement of Financial Position (cont.)
$ MILLION |
| MARCH 31, 2026 |
|
| DECEMBER 31, 2025 |
| ||
Capital and reserves attributable to the owners of the parent |
|
|
|
|
|
|
|
|
Non-controlling interest |
|
| 4,309 |
|
|
| 4,203 |
|
Total equity |
|
| 16,506 |
|
|
| 16,148 |
|
Provisions |
|
| 615 |
|
|
| 586 |
|
Deferred tax liabilities |
|
| 25 |
|
|
| 24 |
|
Non current tax liabilities |
|
| 15 |
|
|
| 13 |
|
Other liabilities |
|
| 961 |
|
|
| 956 |
|
Trade payables |
|
| 1 |
|
|
| 1 |
|
Lease liabilities |
|
| 146 |
|
|
| 138 |
|
Borrowings |
|
| 2,199 |
|
|
| 1,815 |
|
Total non-current liabilities |
|
| 3,963 |
|
|
| 3,533 |
|
Provision for ongoing litigation related to the acquisition of a participation in Usiminas |
|
| 575 |
|
|
| 528 |
|
Current income tax liabilities |
|
| 48 |
|
|
| 39 |
|
Other liabilities |
|
| 403 |
|
|
| 640 |
|
Trade payables |
|
| 2,078 |
|
|
| 2,073 |
|
Derivative financial instruments |
|
| 3 |
|
|
| 1 |
|
Lease liabilities |
|
| 50 |
|
|
| 49 |
|
Borrowings |
|
| 615 |
|
|
| 604 |
|
Total current liabilities |
|
| 3,773 |
|
|
| 3,934 |
|
Total liabilities |
|
| 7,736 |
|
|
| 7,467 |
|
Total equity and liabilities |
|
| 24,242 |
|
|
| 23,615 |
|
Statement of Cash Flows
$ MILLION |
| 1Q26 |
|
| 4Q25 |
|
| 1Q25 |
| |||
Result for the period |
|
| 372 |
|
|
| 171 |
|
|
| 142 |
|
Adjustments for: |
|
|
|
|
|
|
|
|
|
|
|
|
Depreciation and amortization |
|
| 181 |
|
|
| 210 |
|
|
| 184 |
|
Income tax accruals less payments |
|
| (130 | ) |
|
| (42 | ) |
|
| (50 | ) |
Equity in earnings of non-consolidated companies |
|
| (14 | ) |
|
| (20 | ) |
|
| (16 | ) |
Provision for ongoing litigation related to the acquisition of a participation in Usiminas |
|
| 48 |
|
|
| 1 |
|
|
| 45 |
|
Interest accruals less payments / receipts, net |
|
| (7 | ) |
|
| (8 | ) |
|
| 9 |
|
Changes in provisions |
|
| 1 |
|
|
| (6 | ) |
|
| 3 |
|
Changes in working capital |
|
| (233 | ) |
|
| 135 |
|
|
| (55 | ) |
Net foreign exchange results and others |
|
| 0 |
|
|
| 68 |
|
|
| (56 | ) |
Impairment of Las Encinas' mining assets |
|
| - |
|
|
| 19 |
|
|
| - |
|
Net cash provided by operating activities |
|
| 217 |
|
|
| 528 |
|
|
| 207 |
|
Capital expenditures and advances to suppliers for PP&E |
|
| (406 | ) |
|
| (463 | ) |
|
| (518 | ) |
Decrease (increase) in other investments |
|
| 88 |
|
|
| (48 | ) |
|
| 243 |
|
Proceeds from the sale of property, plant & equipment |
|
| 1 |
|
|
| 0 |
|
|
| 1 |
|
Dividends received from non-consolidated companies |
|
| 1 |
|
|
| 28 |
|
|
| 1 |
|
Recovery of loans from non-consolidated companies |
|
| 150 |
|
|
| - |
|
|
| - |
|
Acquisition of additional participation in Usiminas |
|
| (315 | ) |
|
| - |
|
|
| - |
|
Acquisition of business - purchase consideration |
|
| (24 | ) |
|
| - |
|
|
| - |
|
Acquisition of business - cash acquired |
|
| 4 |
|
|
| - |
|
|
| - |
|
Repayment of additional paid in capital |
|
| - |
|
|
| (5 | ) |
|
| - |
|
Net cash used in investing activities |
|
| (502 | ) |
|
| (488 | ) |
|
| (273 | ) |
Dividends paid in cash to company's shareholders |
|
| - |
|
|
| (177 | ) |
|
| - |
|
Dividends paid in cash to non-controlling interest |
|
| (6 | ) |
|
| (7 | ) |
|
| - |
|
Finance lease payments |
|
| (14 | ) |
|
| (14 | ) |
|
| (20 | ) |
Proceeds from borrowings |
|
| 406 |
|
|
| 461 |
|
|
| 573 |
|
Repayments of borrowings |
|
| (39 | ) |
|
| (78 | ) |
|
| (385 | ) |
Net cash provided by financing activities |
|
| 346 |
|
|
| 186 |
|
|
| 167 |
|
Increase in cash and cash equivalents |
|
| 61 |
|
|
| 226 |
|
|
| 101 |
|
Exhibit I - Alternative Performance Measures
These non-IFRS measures should not be considered in isolation of, or as a substitute for, measures of performance prepared in accordance with IFRS. These non-IFRS measures do not have a standardized meaning under IFRS and, therefore, may not correspond to similar non-IFRS financial measures reported by other companies.
Adjusted EBITDA
$ MILLION |
| 1Q26 |
|
| 4Q25 |
|
| 1Q25 |
| |||
Net income |
|
| 372 |
|
|
| 171 |
|
|
| 142 |
|
Adjusted to exclude: |
|
|
|
|
|
|
|
|
|
|
|
|
Depreciation and amortization |
|
| 181 |
|
|
| 210 |
|
|
| 184 |
|
Income tax |
|
| (93 | ) |
|
| (17 | ) |
|
| 23 |
|
Net financial results |
|
| (22 | ) |
|
| 24 |
|
|
| (63 | ) |
Equity in earnings of non-consolidated companies |
|
| (14 | ) |
|
| (20 | ) |
|
| (16 | ) |
Provision for ongoing litigation related to the acquisition of a participation in Usiminas |
|
| 48 |
|
|
| 1 |
|
|
| 45 |
|
Impairment of Las Encinas' mining assets |
|
| - |
|
|
| 19 |
|
|
| - |
|
Adjusted to include: |
|
|
|
|
|
|
|
|
|
|
|
|
Proportional EBITDA in Unigal (70%participation) |
|
| 8 |
|
|
| 7 |
|
|
| 6 |
|
Adjusted EBITDA |
|
| 479 |
|
|
| 395 |
|
|
| 322 |
|
Divided by: net sales |
|
| 3,934 |
|
|
| 3,775 |
|
|
| 3,933 |
|
Adjusted EBITDA Margin (%) |
|
| 12 | % |
|
| 10 | % |
|
| 8 | % |
Exhibit I - Alternative Performance Measures (cont.)
Cash Operating Income - Steel Segment
$ MILLION |
| 1Q26 |
|
| 4Q25 |
|
| 1Q25 |
| |||
Operating Income - Management View (Note "Segment Information" to Ternium's Financial Statements as of the corresponding dates) |
|
| 272 |
|
|
| 202 |
|
|
| 244 |
|
Plus/minus differences in cost of sales (IFRS) |
|
| (18 | ) |
|
| (18 | ) |
|
| (116 | ) |
Excluding depreciation and amortization |
|
| 148 |
|
|
| 150 |
|
|
| 142 |
|
Including proportional EBITDA in Unigal(70% participation) |
|
| 8 |
|
|
| 7 |
|
|
| 6 |
|
Cash Operating Income |
|
| 410 |
|
|
| 342 |
|
|
| 276 |
|
Divided by: steel shipments (thousand tons) |
|
| 3,709 |
|
|
| 3,727 |
|
|
| 3,857 |
|
Cash Operating Income per Ton - Steel |
|
| 111 |
|
|
| 92 |
|
|
| 72 |
|
Divided by: steel net sales |
|
| 3,814 |
|
|
| 3,624 |
|
|
| 3,801 |
|
Cash Operating Income Margin - Steel (%) |
|
| 11 | % |
|
| 9 | % |
|
| 7 | % |
Cash Operating Income - Mining Segment
$ MILLION |
| 1Q26 |
|
| 4Q25 |
|
| 1Q25 |
| |||
|
|
|
|
|
|
|
|
|
|
|
| |
Operating Result - Management View (Note "Segment Information" to Ternium's Financial Statements as of the corresponding dates) |
|
|
|
|
|
|
|
|
|
|
|
|
Plus/minus differences in cost of sales (IFRS) |
|
| 53 |
|
|
| 35 |
|
|
| 17 |
|
Excluding depreciation and amortization |
|
| 33 |
|
|
| 60 |
|
|
| 42 |
|
Impairment of Las Encinas' mining assets |
|
| - |
|
|
| 19 |
|
|
| - |
|
Cash Operating Income |
|
| 61 |
|
|
| 48 |
|
|
| 57 |
|
Divided by: mining shipments (thousand tons) |
|
| 2,826 |
|
|
| 3,361 |
|
|
| 3,059 |
|
Cash Operating Income per Ton - Mining |
|
| 22 |
|
|
| 14 |
|
|
| 18 |
|
Divided by: mining net sales |
|
| 284 |
|
|
| 309 |
|
|
| 280 |
|
Cash Operating Income Margin - Mining (%) |
|
| 22 | % |
|
| 16 | % |
|
| 20 | % |
Exhibit I - Alternative Performance Measures (cont.)
Free Cash Flow
$ MILLION |
| 1Q26 |
|
| 4Q25 |
|
| 1Q25 |
| |||
Net cash provided by operating activities |
|
| 217 |
|
|
| 528 |
|
|
| 207 |
|
Less: capital expenditures and advances to suppliers for PP&E |
|
| (406 | ) |
|
| (463 | ) |
|
| (518 | ) |
Free Cash Flow |
|
| (189 | ) |
|
| 65 |
|
|
| (311 | ) |
Net Cash
$ BILLION |
| MARCH 31, |
|
| DECEMBER 31, 2025 |
|
| MARCH 31, |
| |||
Cash and cash equivalents |
|
| 1.6 |
|
|
| 1.5 |
|
|
| 1.8 |
|
Plus: other investments (current and non-current) |
|
| 1.5 |
|
|
| 1.6 |
|
|
| 1.9 |
|
Less: borrowings (current and non-current) |
|
| (2.8 | ) |
|
| (2.4 | ) |
|
| (2.5 | ) |
Net Cash |
|
| 0.3 |
|
|
| 0.7 |
|
|
| 1.3 |
|
Note: Ternium Argentina's consolidated position of cash and cash equivalents and other investments amounted to $0.8 billion as of March 31, 2026, $0.8 billion as of December 31, 2025, and $1.1 billion as of March 31, 2025.
Sebastián Martí
Ternium - Investor Relations
+1 (866) 890 0443
+54 (11) 4018 8389
www.ternium.com
SOURCE: Ternium S.A.
| May-12 | |
| May-05 | |
| Apr-15 | |
| Mar-31 | |
| Mar-20 | |
| Mar-01 | |
| Feb-19 | |
| Feb-18 | |
| Feb-18 | |
| Feb-18 | |
| Feb-10 | |
| Jan-27 | |
| Jan-22 | |
| Jan-19 | |
| Jan-12 |
Join thousands of traders who make more informed decisions with our premium features. Real-time quotes, advanced visualizations, alerts, and much more.
Learn more about Finviz Elite