Can Stocks Defy the Upcoming Bearish Seasonality?
The S&P 500 Index (SPX) is up a solid 8.5% year to date as we head into August. July was an interesting month though, with the index hovering just below its all-time high without being able to break through. This week, I’ll break down how August usually performs given the year-to-date return and how likely we are to hit an all-time high during the month, given July’s price action.
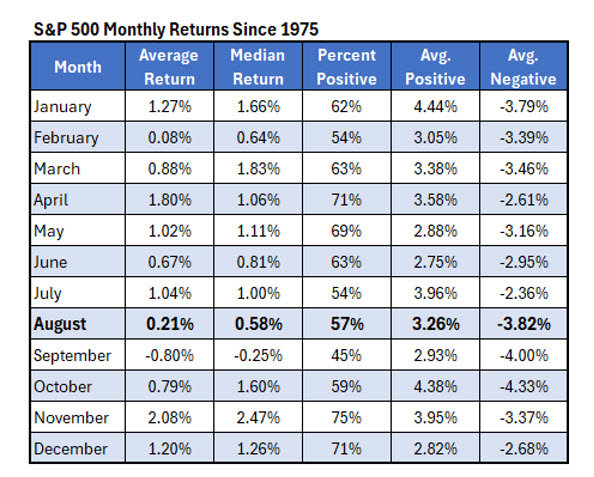
Historically, we are heading into the most bearish two-month period of the year. Since 1975, August has been the third-worst month of the year, with the SPX averaging a return of 0.21%. September has been even weaker, the only month to average a negative return and the only month with fewer than half of the returns positive. This underperformance has been the case in more recent years but there are several stocks that have tended to perform well despite the bearish seasonality.
What to Expect in August
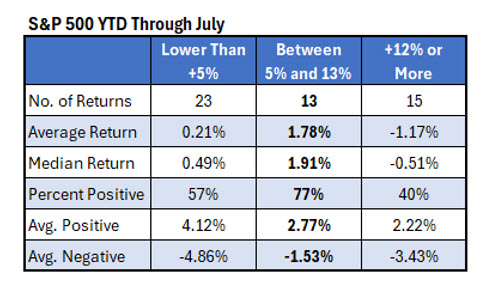
The 8.5% year-to-date return for the SPX is the sweet spot for August. The month has been especially strong when the index has gained between 5% and 13% through the end of July. In those years, August averaged a return of 1.78%, with positive returns 77% of the time.
By comparison, when the SPX gained less than +5%, August averaged a modest 0.21%, with 57% of returns positive. And when the index was up more than 13% year-to-date, it often pulled back, averaging a loss of 1.17% with only 40% of the returns positive.
With the SPX in the middle of the 5% to 13% range, history shows the odds tilted in the bulls’ favor. Hopefully, that trend continues.
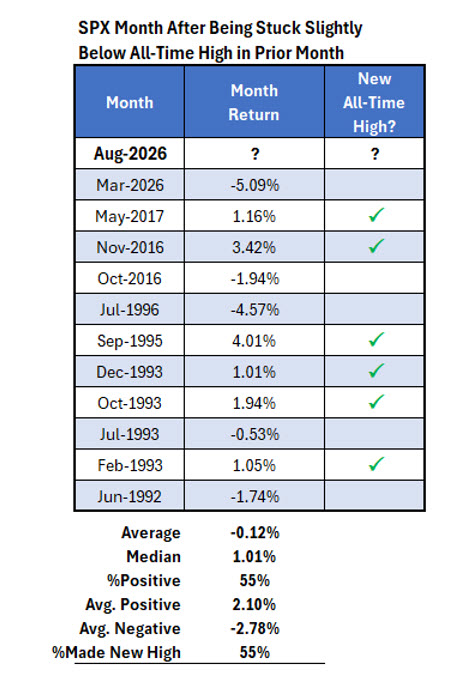
This next table shows all the months where the SPX never closed more than 3% away from its all-time high, but also never made a high during the month. In other words, it wandered sideways just below its all-time high for the entire month.
We saw this earlier in the year, when the SPX made a new high in January and then spent the entire month of February hovering just below that high. The index fell more than 5% in March and did not reach a new high.
Overall, I found 11 previous times this situation occurred, with several of them in the 1990s. The SPX tended to underperform after lingering just below its all-time high for the previous month. The index averaged a slight loss in these months (-0.12%), with 55% of the returns positive. Also, the SPX was able to reach a new high 55% of the time in these situations. Notably, the index never made a new high during the month and then pulled back to a loss for the month. So, if we can just get to that high early in August, it might create a floor for stocks.
Two-Month Periods
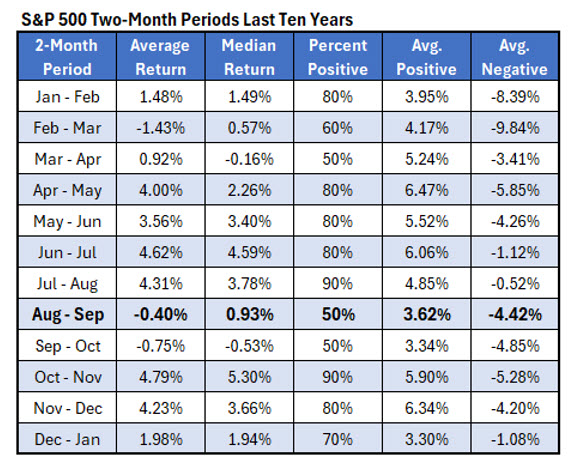
The table below summarizes the SPX returns for two-month periods over the past ten years. Earlier, I noted this has been a bearish part of the year since 1975. The table below shows it’s been a bearish part of the year more recently as well. The SPX has averaged a loss of 0.4% from August through September over the past ten years. Only the February through March period is worse. Also, the index has been positive just half the time over the next two months looking back over the past ten years.
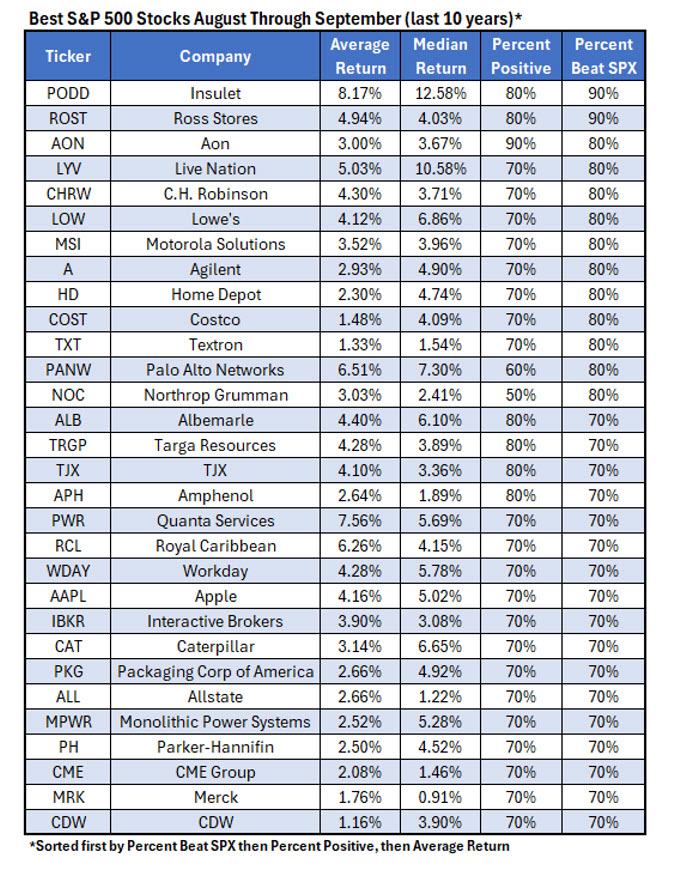
Despite the history of poor performance of the SPX over the next two months, some stocks have done very well. Below is a list of 30 S&P 500 stocks that have outperformed over the next two months, going back ten years. The top two stocks, Insulet (PODD) and Ross Stores (ROST), have beat the SPX in nine of the past ten years from August through September. Interestingly, their year-to-date charts could not be more different. Apple (AAPL) is the only trillion-dollar company to make the list.
Mentioned In This Article
Latest News
| Oct-23 | |
| Oct-23 | |
| Oct-23 | |
| Oct-23 | |
| Oct-23 | |
| Oct-23 | |
| Oct-23 | |
| Oct-23 | |
| Oct-23 | |
| Oct-23 | |
| Oct-23 | |
| Oct-23 | |
| Oct-23 | |
| Oct-23 | |
| Oct-22 |
