Watch for This Key S&P 500 Marker in the Coming Weeks
“Finally! The S&P 500 Index (SPX – 7,757.64) broke out above the 7,300–7,530 stranglehold to its first all-time closing high in eight weeks…The index also closed above two other key levels that I have identified in the past that could tempt profit takers…to the degree the sentiment in the options market, which we can gauge real time, reflects sentiment among other market participants, the breakout should have legs as many might be on the sidelines with the SPX at an all-time high. The sentiment in the options market looks more like a market that is breaking below support levels than breaking out to an all-time high, suggesting there is fuel to sustain the rally.
-Monday Morning Outlook, August 10, 2026
There were significantly less earnings reports last week compared to previous weeks, but that didn’t stop the newsflow. Investors had more macro events to consider, including the ongoing uncertainty with respect to the U.S.-Iran conflict that continues to drive fuel prices higher amid heightening threats from the Trump Administration.
Additionally, there were a series of reports on the economy ranging from consumer price index (CPI) (met expectations), producer price index (PPI) (remained unchanged), jobless claims (worse than expected), and retail sales (also worse than expected). This did not dissuade low-expectation investors, however, who drove the S&P 500 Index (SPX—7,785.76) to a new all-time high.
This comes as the SPX does the unthinkable - with notable mega-cap stocks such as Microsoft (MSFT), Apple (AAPL), Meta Platforms (META), Nvidia (NVDA), Alphabet (GOOGL), and Tesla (TSLA) all either slightly or significantly below their respective all-time highs.
I put unthinkable in italics because the consensus sentiment about a year ago was that without the support of mega-cap stocks, the broader market would be in trouble. Market participants fretted about the risks of a narrow-based rally late last year and gave little thought to more stocks participating that could prolong the bull market. Following the March low, there has been a clear broadening of the rally since mid-May, per the chart immediately below.
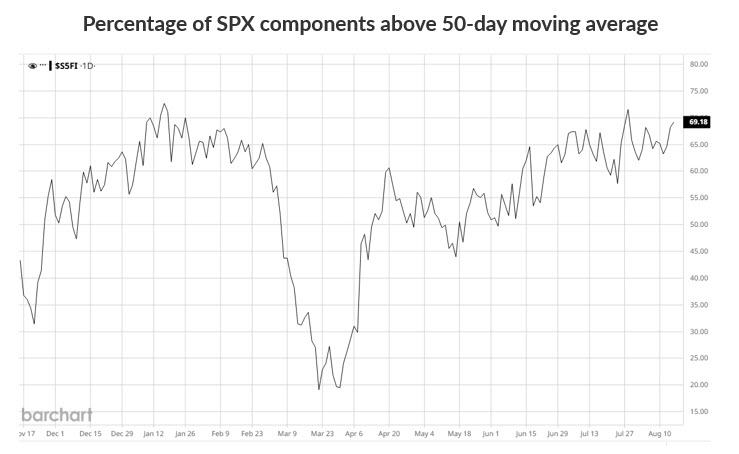
Short-term traders and longer-term market participants grew cautious, as the narrow May-July range unfolded.
The chart immediately below displays the ratio of puts bought (to open) –downside bets - versus calls bought (to open) - or upside bets - on SPX component stocks. Note how this ratio soared as put buying grew relative to call buying during the recent trading range and uncertainty about the Iran-U.S. conflict, plus upcoming Fed and earnings reports.
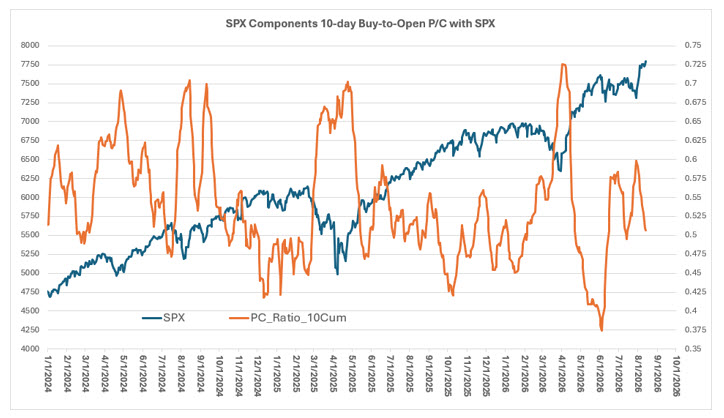
With the July Fed meeting behind us and most companies reporting earnings, buyers have overwhelmed sellers. The SPX broke out to a new all-time high two weeks ago and has continued making headway.
With the SPX buy (to open) put/call volume ratio now declining, it is apparent that sentiment among traders is shifting from caution to more optimism. The ratio indicates though that enthusiasm for stocks has yet to hit an extreme, an indication that there is more sideline money to sustain the breakout.
We will keep the actions of equity option buyers on our radar. If the SPX component buy (to open) put/call ratio moves into territory that indicates extreme optimism, we will likely caution that choppiness or a pullback is a growing probability as mid-term election uncertainty takes center stage. We have not yet reached this scenario.
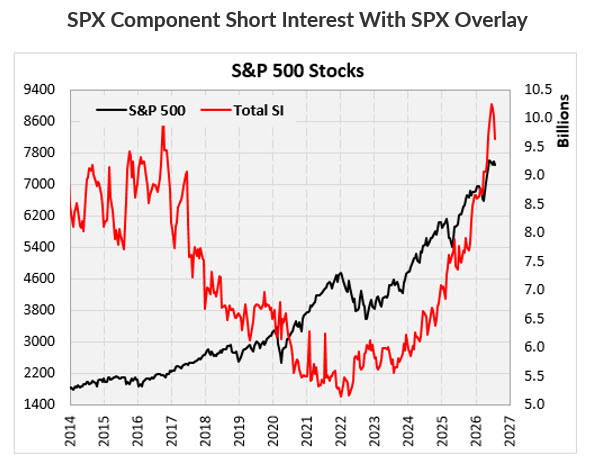
Another sentiment chart that I have been fascinated in since early last year and continue to be fascinated with is SPX component short interest. In early 2025, total short interest on SPX components moved above the Covid-19 high mark as the SPX was hitting all-time highs.
More recently, total short interest on SPX components moved above its 2016 all-time high as the SPX was also in new all-time high territory. If viewing the short interest chart without the SPX overlay, one may have concluded that we were in the grips of a bear market. As such, I have been saying since early 2025 that short-covering potential can put a floor on declines and ignite powerful rallies. Nothing has changed from this bullish takeaway and one need not look any further than how short-covering drove a powerful rally in the market from 2017-2019.
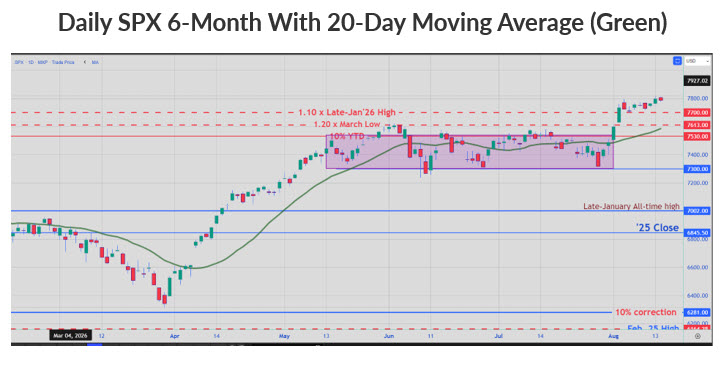
Key levels I am watching on the SPX in the week(s) ahead include the first line of support in the 7,615—7,620 area, which is 20% above the March closing low and site of the June closing high. The SPX’s rising 20-day moving average is moving into this zone too.
With the SPX in all-time high territory, it is more difficult to establish potential resistance levels. One area worth watching, however, is 7,950 to 7,970. The 7,970 level is 350 points above the June closing high. I used 350 points because the distance between the June closing high at 7,620 and June closing low at 7,266 is approximately 350 points, and this mostly defined the range from mid-May through July. The 8,215 level is 20% above last year’s close and could be an area that induces profit-taking.
Todd Salamone is Schaeffer's Senior V.P. of Research.
Continue reading:
Mentioned In This Article
Latest News
| 1 hour | |
| 1 hour | |
| 1 hour | |
| 1 hour | |
| 2 hours | |
| 3 hours | |
| 4 hours | |
| 4 hours | |
| 5 hours | |
| 5 hours | |
| 5 hours | |
| 5 hours | |
| 5 hours | |
| 5 hours | |
| 5 hours |
