Home Depot Posts 4-Year High in Comps: Here's the Catch
Home Depot opened the retail earnings week with the kind of quarter the home improvement group has been waiting two years for.
Sales rose 5.7% to $47.9 billion, comparable sales climbed 1.7%, and adjusted earnings reached $4.92 against $4.68 a year ago. Both lines cleared the bar comfortably: the Zacks Consensus Estimate called for $4.71 in EPS on $47.5 billion in revenue, putting the earnings surprise near 4.5% and the revenue surprise just under 1%.
Shares rose roughly 1.7% in pre-market trading. After a long stretch in which this sector’s results ranged from flat to disappointing, that reaction feels earned.
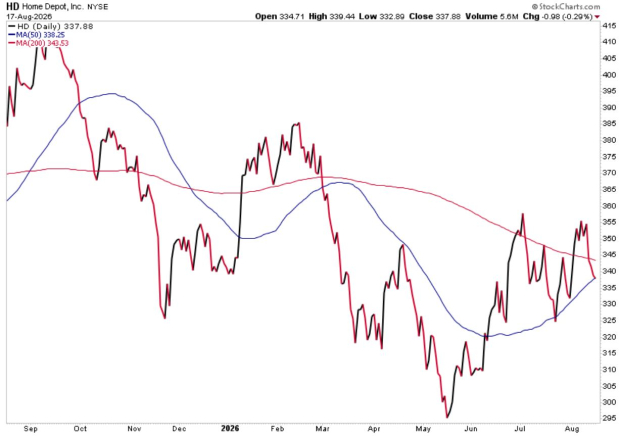
Image Source: StockCharts
The Comp Number Is Genuinely Good
The headline metric is the story. Comparable sales of 1.7% beat expectations for 0.9%, and CFO Richard McPhail noted it was the highest comparable sales figure the company has posted since the third quarter of fiscal 2022. That’s a four-year high, and it marks a real acceleration from the 0.6% comp Home Depot posted in the first quarter and the 1.0% it managed in last year’s second quarter.
Management’s explanation was straightforward. McPhail said results exceeded expectations with “broad based demand across the business as customers continued to engage in smaller projects.” That phrasing matters. The recovery here is not coming from kitchen remodels or additions — it’s coming from customers who are still deferring the big-ticket work but doing more of the small stuff.
The Asterisk: Ticket Is Up, Traffic Is Down
Look one level beneath the comp and the picture gets more complicated. Comparable customer transactions fell 1%, while comparable average ticket rose 2.8%. Total customer transactions declined to 443.2 million from 446.8 million, and average ticket climbed to $92.50 from $90.01.
In other words, the entire comp gain — and then some — came from customers spending more per visit, not from more customers walking through the door. Traffic has now been negative for several quarters running, and the decline actually steepened from the 0.4% drop a year ago.
There’s a second nuance worth flagging. U.S. comparable sales rose 1.3% this quarter, against 1.4% in the year-ago period. So the acceleration in the total comp figure was driven meaningfully by results outside the U.S. store base. The domestic consumer improved, but less dramatically than the headline suggests.
Margins Tell a Mixed Story
Profitability held up but did not expand. Gross profit rose 6.5% to $16.1 billion, lifting gross margin roughly 26 basis points to about 33.7%. But SG&A grew 8.5% — well ahead of the 5.7% sales growth — pushing operating margin down to 14.3% from 14.5%.
The cash story is stronger. Through six months, operating cash flow reached $11.4 billion versus $9.0 billion a year ago, a 27% increase, against capital expenditures of $1.7 billion. That funded $4.6 billion in dividends with room to spare. One item to watch: inventories climbed 8.1% to $26.8 billion, outpacing the 5.7% sales growth — not alarming on its own, but worth tracking if demand cools.
Guidance Reaffirmed, Not Raised
Here’s the discipline that likely tempered an otherwise strong reaction. Despite beating on both lines and posting a four-year high in comps, Home Depot HD reaffirmed rather than raised its fiscal 2026 outlook: total sales growth of 2.5% to 4.5%, comparable sales of flat to 2.0%, and adjusted diluted EPS growth of flat to 4.0% from last year’s $14.69.
The company also disclosed something worth reading carefully. Guidance includes IEEPA tariff refunds, which are expected to partially offset unplanned fuel, energy, and other product input costs throughout the fiscal year. The translation here is that a one-time tariff recovery is helping absorb cost inflation that management did not plan for. That’s a fine outcome, but it isn’t the same as underlying margin strength, and it explains why a beat didn’t produce a raise.
The Read-Through to Lowe’s and the Broader Space
This print sets up an immediate and unusually clean test. Lowe’s LOW reports its own second quarter on Wednesday before the open, with Wall Street looking for revenue of about $26.1 billion and EPS near $4.22, down roughly 3% year over year. Both retailers posted identical 0.6% comps in the first quarter, so Home Depot’s acceleration to 1.7% raises the bar.
But the two are not perfectly comparable, and the divergence could be meaningful. Home Depot’s strength came from smaller projects and higher tickets, with Pro and SRS supporting the mix. Lowe’s skews more toward the DIY customer, and analysts have been trimming estimates ahead of the print. If Lowe’s comps come in soft against Home Depot’s 1.7%, the conclusion is share shift rather than an industry-wide recovery.

Image Source: Zacks Investment Research
For the broader home improvement complex, the readthrough is that conditions are stabilizing rather than inflecting. Housing turnover remains depressed, mortgage rates continue to discourage trade-up activity, and customers are still choosing paint and repairs over renovations. What has changed is that the smaller-project business is now large enough and steady enough to produce positive comps. That’s a floor, and floors matter after two years of searching for one.
Bottom Line
Home Depot entered this report carrying a Zacks Rank #3 (Hold) with a positive Earnings ESP of +1.25% — a setup our model flagged as favorable for a beat, which is exactly what happened.
The practical question now is whether estimates move. Consensus has been essentially flat for 60 days, and with guidance merely reaffirmed, analysts have limited license to push full-year numbers meaningfully above the current $14.99 mark. That likely keeps the rank anchored until management gives them a reason to move.
Overall, this was a solid, encouraging quarter from the sector’s bellwether, and the positive reaction is justified. Just don’t mistake it for a housing recovery. Until transactions turn positive, Home Depot is growing by selling more to fewer customers — a workable formula, but not the one that drives the next leg higher.
Want the latest recommendations from Zacks Investment Research? Today, you can download 7 Best Stocks for the Next 30 Days. Click to get this free report
Lowe's Companies, Inc. (LOW): Free Stock Analysis Report
The Home Depot, Inc. (HD): Free Stock Analysis Report
This article originally published on Zacks Investment Research (zacks.com).
Mentioned In This Article
Latest News
| 1 hour | |
| Oct-16 | |
| Oct-15 | |
| Oct-15 | |
| Oct-15 | |
| Oct-15 | |
| Oct-15 | |
| Oct-15 | |
| Oct-15 | |
| Oct-15 | |
| Oct-15 | |
| Oct-14 | |
| Oct-13 | |
| Oct-12 | |
| Oct-12 |
