What to Make of This Beaten-Down Blue-Chip
Subscribers to Chart of the Week received this commentary on Sunday, August 23.
This week an article out of Bespoke Investment Group caught my eye, in which the firm was revisiting its "diversified dogs" report, which covers a list of the worst S&P 500 Index (SPX) performers in each sector over a 12 month period. The concept of the "big dog" stocks that are historically favored being cast aside due to a long-term spell of underperformance was intriguing. Nike Inc (NYSE:NKE) was the only name to appear in both baskets below, also making Bespoke’s list of the biggest S&P 500 losers over the past 12 months (over the entire bull market since October 2022).
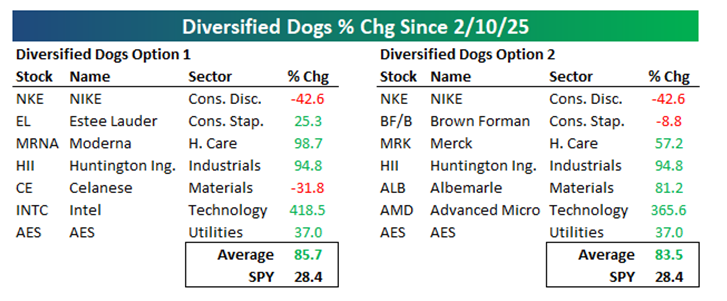
In the chart above, stocks in both columns have managed an average return of more than 80%, with Nike stock’s steep losses padded by the likes of Estée Lauder (EL), Moderna (MRNA), Merck (MRK), Advanced Micro Devices (AMD), and Intel (INTC).
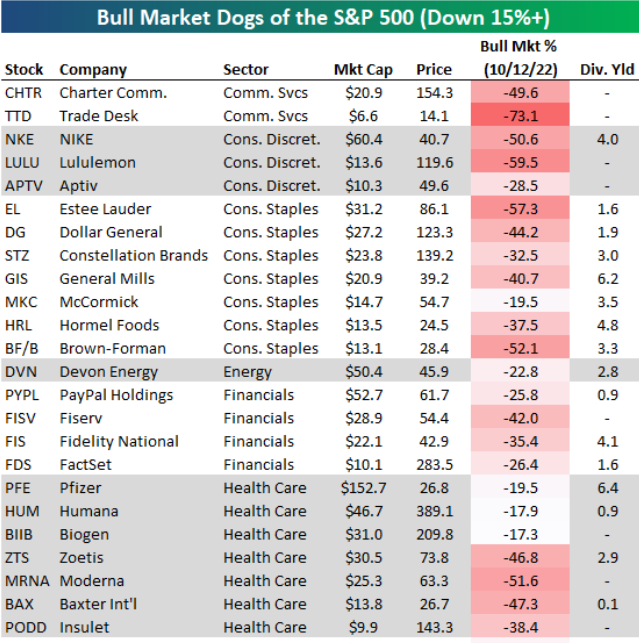
Taking another shovel to the dirt, NKE made the top three worst S&P 500 stocks since the start of the bull market on October 2022. Not only sitting as one of 63 stocks in the red for this time period, Nike also landed itself on the list of the 34% of names that were down 15% or more. But nobody with a market cap as imposing as Nike ($60 billion), so why is this big fish swimming in the red with the minnows?
So, what does this mean for NKE?
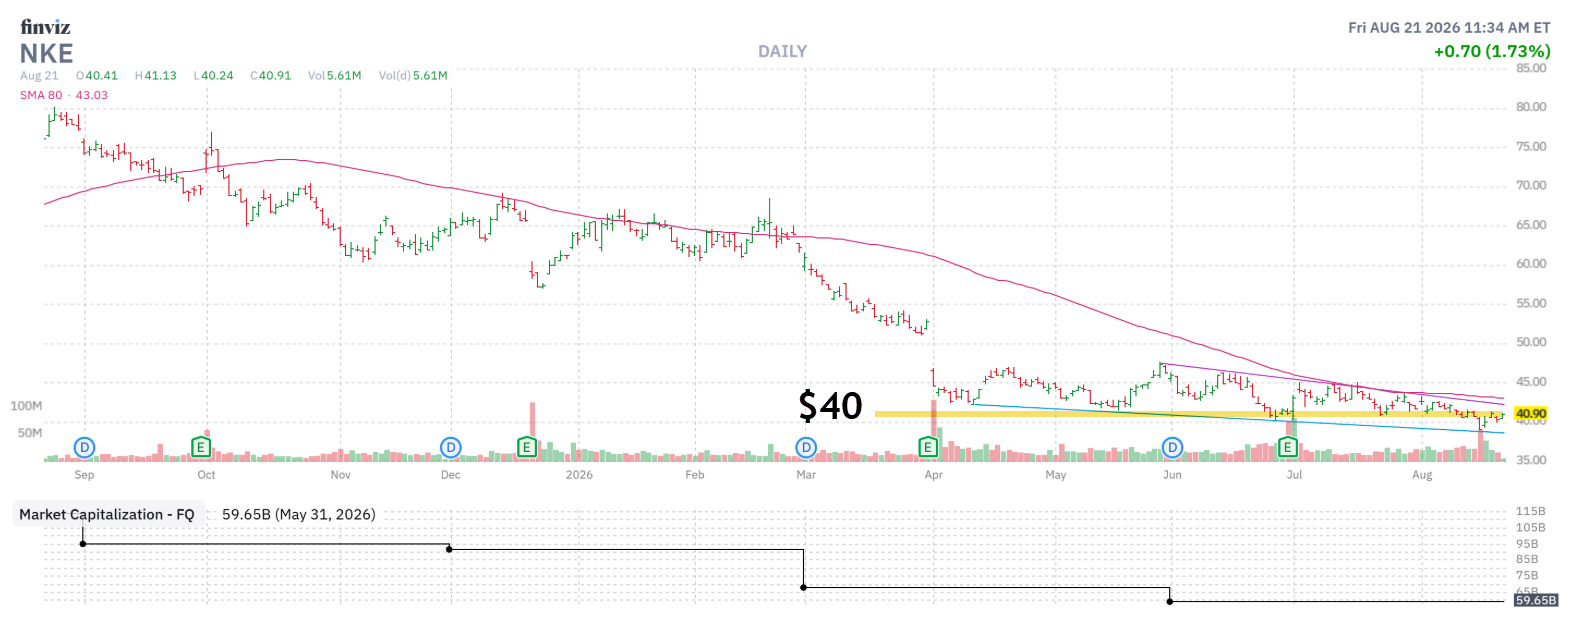
Nike stock has been consolidating around the $40 area since suffering a 15.5% post-earnings bear gap on April 1, but overhead resistance at the 50-day moving average has thwarted numerous breakout attempts since October.
As noted by Schaeffer’s Senior Market Analyst Chris Prybal, Nike’s Jordan unit accounts for about $10-$15 billion of the $60 billion market cap. However, it operates on a much higher efficiency level than its umbrella brand. Jordan Brand brings in around 55% to 60% of gross profit margins on average, vastly outperforming Nike’s core brand average of just over 40%. A spinoff of the Air Jordan brand could value at a market value of up to $20 billion or more.
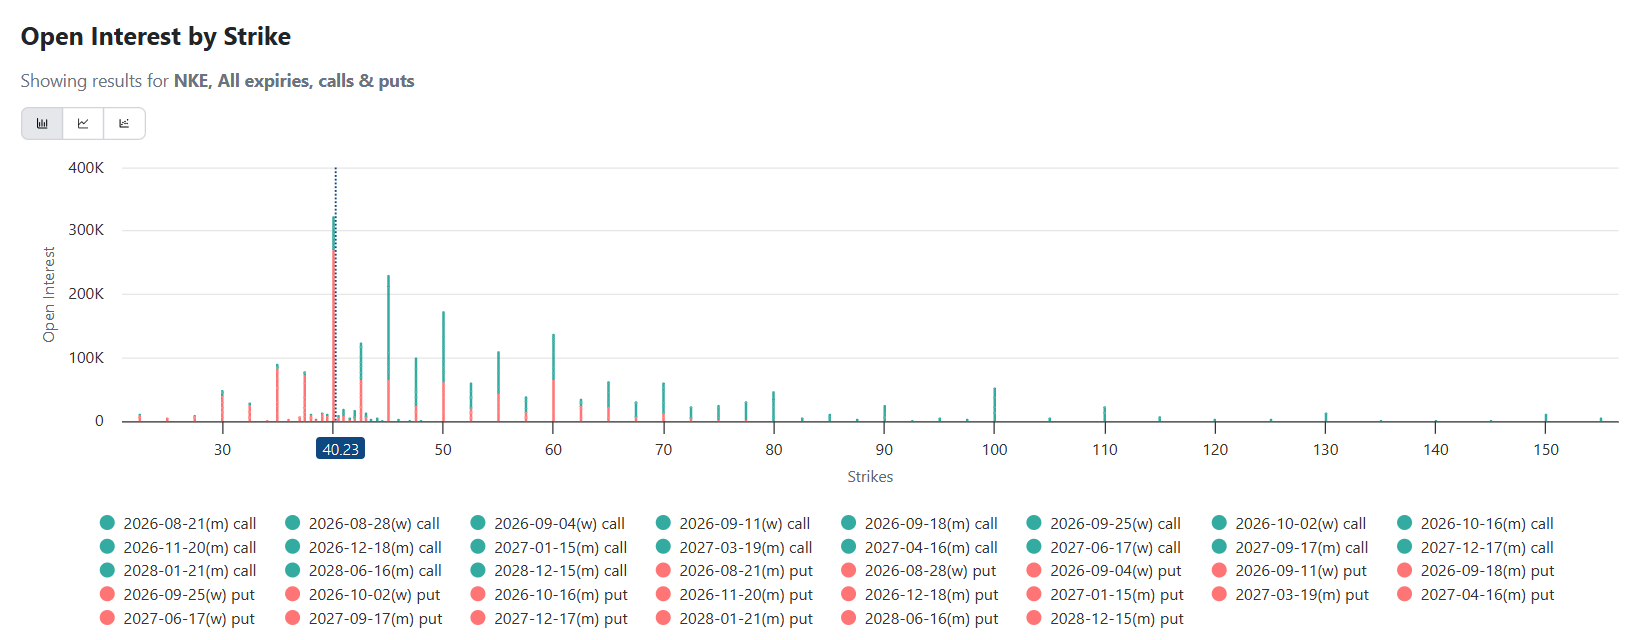
The $40 level also marks the largest open interest (OI) strike, as well as the largest individual strike per option. The 45 strike holds the biggest call open interest, suggesting any break below could amplify hedging.
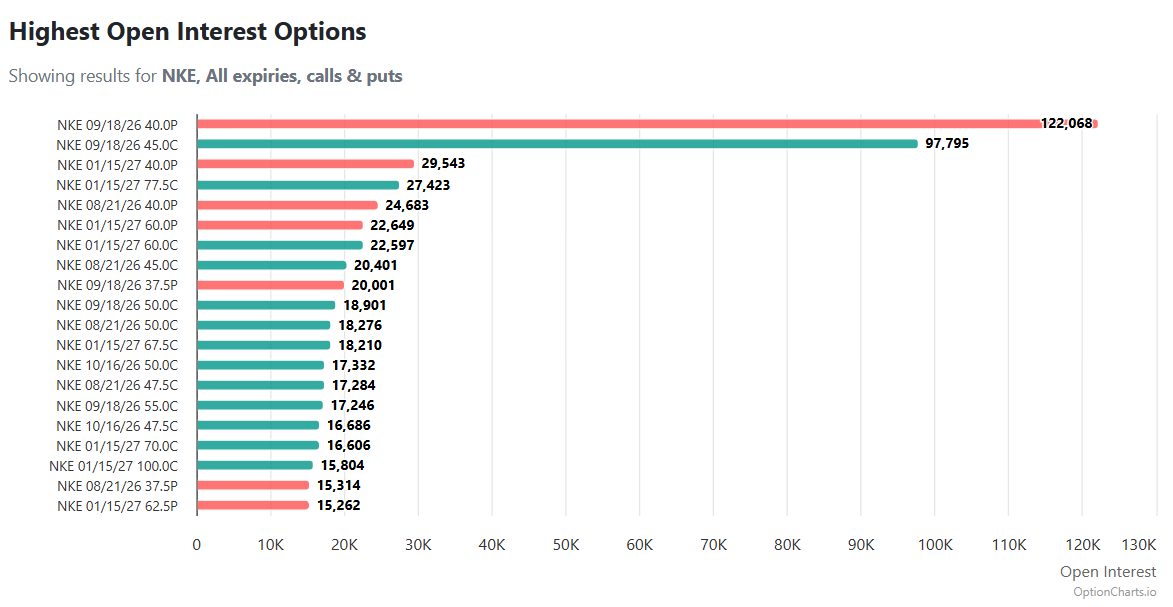
During Nike’s summer of consolidation, the stock’s 14-Day Relative Strength Index (RSI) never drifted too far into "oversold" territory. Maybe there’s another leg lower in the next month or so until earnings season. But maybe the round-number $40 is where the downtrend stops. If this support holds up, the launchpad from here after another solid post-earnings reaction could shake loss the 19 analysts on the fence with "hold" ratings. Everyone loves a comeback story, and investors may be eager to get in on the ground level.
Regardless, Nike stock is priced affordably, per its Schaeffer's Volatility Index (SVI) of 33%, which stands higher than just 15% of all other readings from the past year, implying that near-term option traders are pricing in relatively low volatility expectations.
In other words, if you want to maintain a bullish setup for NKE while CEO Elliott Hill continues to unsuccessfully attempt a multi-year turnaround strategy, holding $40 looks like the most sensible approach.
Mentioned In This Article
Latest News
| 33 min | |
| 5 hours | |
| 6 hours | |
| Oct-08 | |
| Oct-08 | |
| Oct-08 | |
| Oct-08 | |
| Oct-08 | |
| Oct-08 | |
| Oct-07 | |
| Oct-06 | |
| Oct-06 | |
| Oct-06 | |
| Oct-06 | |
| Oct-06 |
