East West Bancorp Edges Past Estimates As Record Core Earnings Run Into A Heavier Reserve Build And A Shrinking Book Value
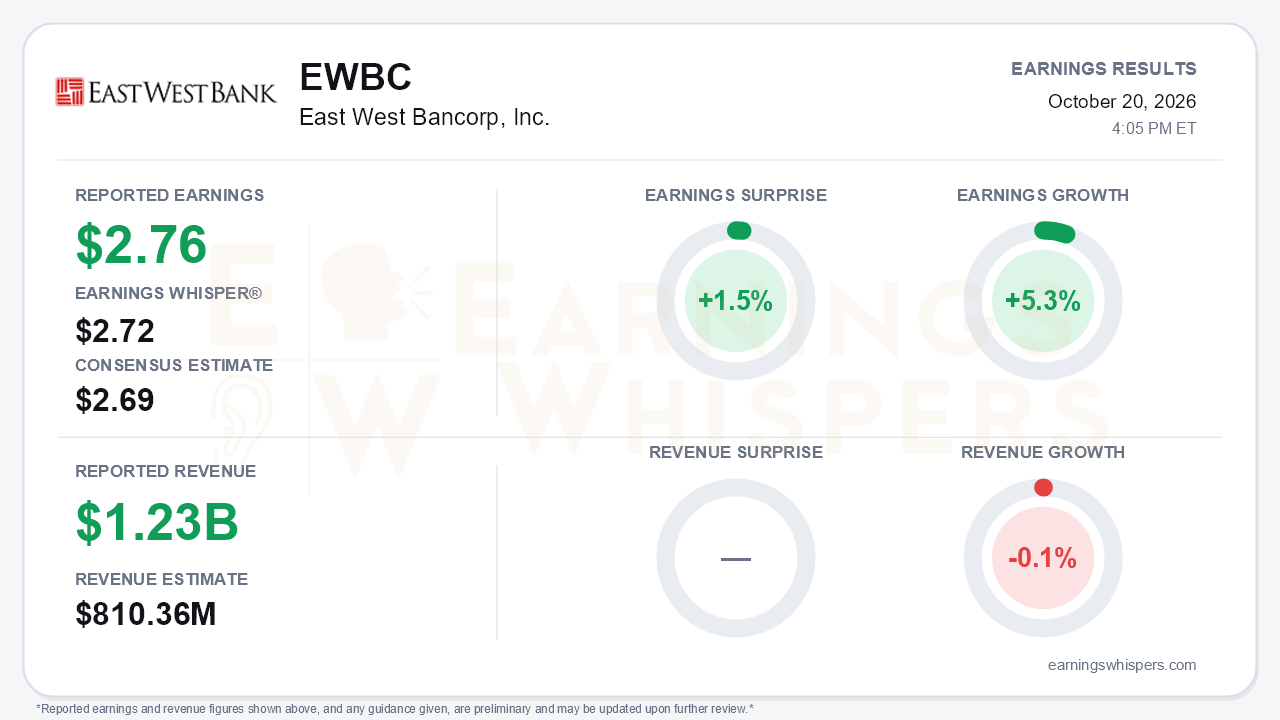
East West Bancorp delivered another clean beat. It reported third-quarter earnings of $2.76 per share against a $2.69 consensus and a $2.72 Earnings Whisper number, a 1.5% surprise. Earnings grew 5.3% year over year. Management described the quarter as "record-breaking" across revenue, net interest income, pre-tax pre-provision income, net income and diluted EPS. Loans reached a record $59.7 billion and deposits a record $71.5 billion. The core earnings engine is strong. The central tension is how much of that strength reaches the bottom line, and the balance sheet, given rising caution about credit.
One reporting conflict needs flagging up front. The normalized revenue figure is $1.229 billion, which beat the $810.36 million consensus by 51.6% and was down 0.1% year over year. The bank's own release reports total revenue of $823 million, up 4% sequentially and 6% year over year. The two numbers are clearly measured on different bases. Investors should not read the 51.6% surprise as a 50% blowout in underlying business activity. Measured against the bank's own $823 million figure, the top-line result looks like a solid, modest beat.
The quality of the quarter is best seen in the spread between operating and net results:
- **Pre-tax, pre-provision income** (a non-GAAP measure) rose 8% both sequentially and year over year, to $540 million.
- **Net income** rose only 4% year over year, to $382 million.
- **Reported diluted EPS** in the release is up 4% from $2.65.
The gap reflects management's decision to "further bolster" the allowance for loan losses "given continued uncertainty in the economic outlook," even though it called asset quality "resilient." Returns moved in a similar direction. Return on average common equity improved 29 basis points sequentially to 16.3% but was down 114 basis points from a year ago. Return on tangible common equity, also non-GAAP, was 17.2% versus 18.5% a year earlier.
The balance sheet also moved the wrong way sequentially. Book value per share fell 2% to $65.97, and the tangible common equity ratio slipped 39 basis points to 10.02%. The release does not explain the decline, and analysts will want an answer.
The funding story remains the strongest pillar. Noninterest-bearing demand deposits grew nearly 15% year over year, which management credited to its small-business checking strategy. Fee income was up 11% through the first nine months, helped by commercial deposit account fees. Context from the second-quarter call tempers the deposit headline, however. At that time, noninterest-bearing deposits were growing 19% year over year, and management cautioned that roughly $200-250 million of tariff-refund inflows might prove transient. A move from 19% to roughly 15% growth is still healthy, but it is a deceleration.
A usable third-quarter conference-call transcript was not available for this review. As a result, we cannot confirm whether management updated full-year guidance on the October 20 call. The trajectory before this quarter was clearly upward:
- **Net interest income growth guidance** rose from 5-7% to 6-8%, then to 7-9%, over the first half.
- **Loan growth guidance** rose to 6-8%.
- **Net charge-off guidance** improved to 15-25 basis points.
- **Expense growth guidance** was narrowed to 8-9%, which effectively lifted the low end.
The risks flagged last quarter are the ones to monitor now. Second-quarter net charge-offs jumped to 19 basis points from 9. Nonperforming assets rose to 29 basis points, and C&I criticized loans ticked higher. Management also pointed to repricing pressure on $13 billion of CDs rolling in the third quarter at 3.60-3.75%. The third-quarter reserve build fits that more defensive posture.
Investors entered the report with tempered enthusiasm. Earnings Whispers sentiment remained positive but weakened, falling from 0.31 to 0.19. Shares were $128.27, down 3.1% from the open following the July report, despite a quarter of record results. The stock still sits about 4.8% above its 200-day moving average of $122.40, so the longer-term trend has not broken. Price trend readings are neutral and the AVWAP trend is negative, consistent with a stock that has drifted rather than rewarded good news.
The bottom line is that East West produced a genuine but narrow beat built on record pre-provision earnings and excellent deposit franchise economics. That beat was partly absorbed by a deliberate reserve build and accompanied by sequential erosion in book value and capital ratios. Bulls can point to 8% PTPP growth, near-15% DDA growth and a guidance track record that has only moved higher. Bears have legitimate ammunition in decelerating deposit growth, year-over-year return compression and management's own heightened credit caution. Until the full-year outlook and credit trends are confirmed, the market's lukewarm reception looks more like a demand for evidence than a rejection of the story.
Read our earnings preview for East West Bancorp, Inc.: https://www.earningswhispers.com/article/EWBC/20403
This earnings review was originally published on Earnings Whispers.
This article is for informational purposes only and is not investment advice. Earnings Whispers and its staff may hold positions in the securities mentioned. It was generated automatically, with the help of AI, from Earnings Whispers and company data, and checked by Earnings Whispers before publication.
Mentioned In This Article
Latest News
| 2 hours | |
| Oct-20 | |
| Oct-20 | |
| Oct-20 | |
| Sep-17 | |
| Aug-21 | |
| Aug-03 | |
| Jul-22 | |
| Jul-21 | |
| Jul-21 | |
| Jul-21 | |
| Apr-22 | |
| Apr-22 | |
| Apr-21 | |
| Apr-21 |
