Rush Street Interactive Faces A Margin Test After Raised Guidance Failed To Stop A 36% Slide
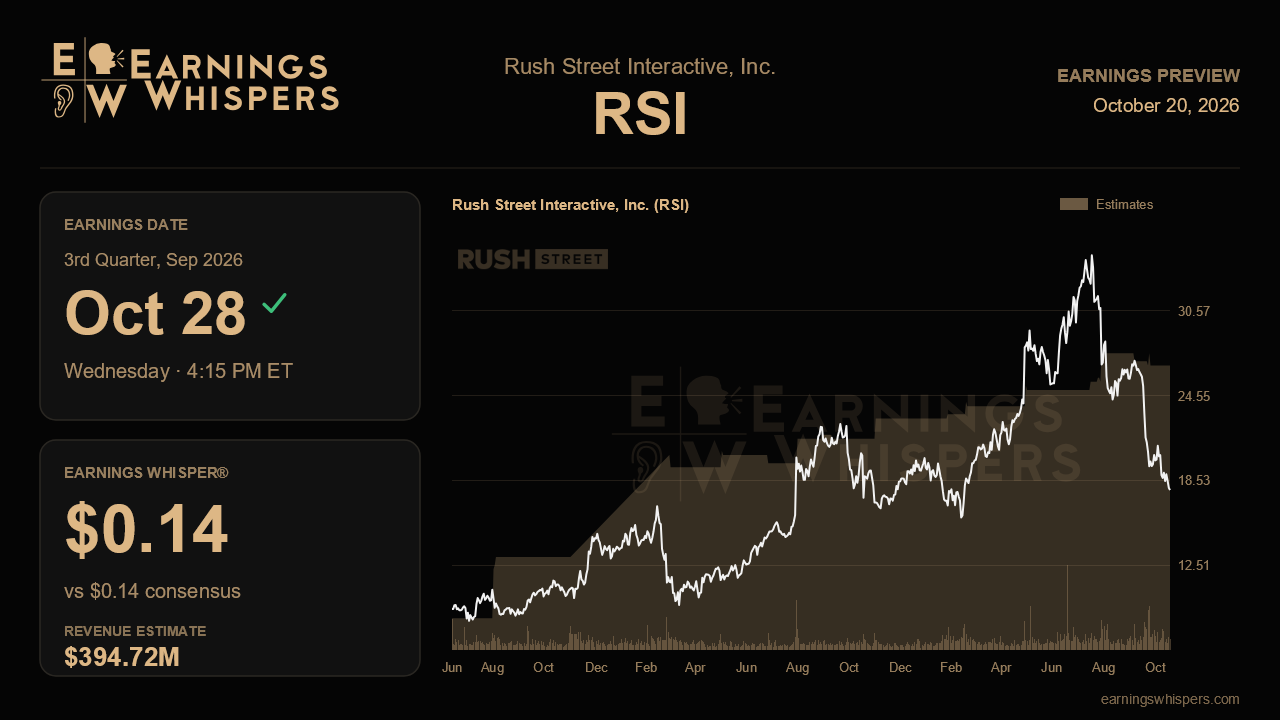
Rush Street Interactive heads into its third-quarter report with a striking disconnect. Management raised its full-year revenue outlook meaningfully last time, yet the stock has lost more than a third of its value since then while the S&P 500 edged higher. When the company reports after the close on October 28, the question is not whether the business is growing. Wall Street already assumes it is, and briskly. The question is whether the profit line can show enough leverage to persuade a skeptical market that the growth is worth paying for.
The consensus calls for non-GAAP earnings of $0.14 per share on revenue of about $394.7 million. The revenue figure represents roughly 42% growth from the $277.9 million posted a year ago, a pace few consumer companies can match. Sequentially, though, the estimate is nearly flat against the $393.8 million reported last quarter. That makes the earnings expectation the more demanding part of the setup. Analysts are looking for profit per share to jump from $0.08 last quarter to $0.14 on essentially unchanged revenue, which implies a substantial improvement in margins. The earnings whisper sits right at consensus, so the informal bar is no higher than the published one. Still, a forecast that already bakes in sharp operating leverage leaves little room for slippage in marketing spend, promotional costs or game hold.
Guidance adds an interesting wrinkle. Rush Street now expects 2026 revenue of $1.56 billion to $1.60 billion, up from a prior range of $1.49 billion to $1.54 billion. The full-year consensus of $1.53 billion sits below even the low end of the new range. Some of that gap may simply reflect estimates that have not been fully updated, but it also suggests the Street is not yet willing to take management's raised outlook at face value. That creates an opportunity. A quarter that lands at or above revenue expectations and comes with a reaffirmed or higher range would force analysts to close the gap upward. A merely in-line quarter, by contrast, could leave investors wondering whether the raise was front-loaded.
What would validate the bullish narrative is straightforward: revenue at or above the consensus, earnings that confirm margins are expanding as scale builds, and a full-year outlook that holds at the new level or moves higher. What would challenge it is a quarter in which revenue meets estimates but profit falls short, a sign that growth is being bought with heavier spending. A trimmed or narrowed guidance range toward the low end would be an even louder warning given how recently it was lifted.
Sentiment has soured noticeably. Bearish readings have climbed to 51% from 27% heading into the prior report, and the price action reflects that shift. At $18.01, the stock trades well below its 200-day moving average of $23.96 and only about 3% above its post-earnings low of $17.51. The entire trading range since the last report, from $17.51 to $28.93, sits beneath the previous quarter's range of $24.66 to $34.53. That is a stock that has been repriced for disappointment, which can work in either direction. Low expectations make it easier to surprise, but a breach of recent lows on a weak print would confirm the downtrend.
Ultimately, this report hinges on operating leverage. Rush Street has shown it can grow the top line rapidly and has raised its revenue outlook to prove confidence in that trend. Now it needs to demonstrate that flat sequential revenue can still produce a meaningful step up in earnings. If it does, the market's heavy discount may look overdone. If it does not, the raised guidance may start to look like a revenue story without the profits to support it.
This earnings preview was originally published on Earnings Whispers.
This article is for informational purposes only and is not investment advice. Earnings Whispers and its staff may hold positions in the securities mentioned. It was generated automatically, with the help of AI, from Earnings Whispers and company data, and checked by Earnings Whispers before publication.
Mentioned In This Article
Latest News
| Oct-20 | |
| Oct-15 | |
| Oct-14 | |
| Oct-09 | |
| Oct-07 | |
| Oct-02 | |
| Oct-01 | |
| Sep-18 | |
| Sep-14 | |
| Sep-14 | |
| Aug-19 | |
| Aug-10 | |
| Jul-30 | |
| Jul-29 | |
| Jul-28 |
