MIAX Faces A Market-Share And Pricing Test After A 30% Post-Earnings Slide
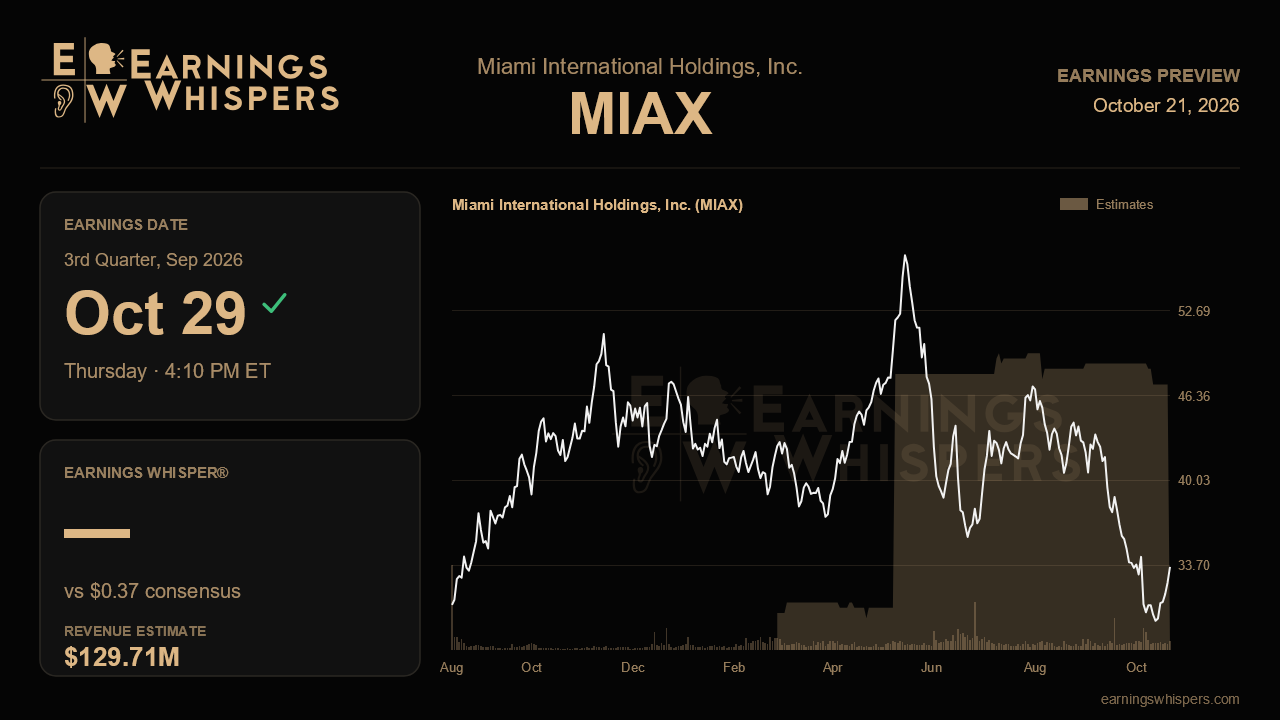
Miami International Holdings heads into its third-quarter report with a split personality. The operating story has rarely looked better: record net revenue, steadily widening margins, a trimmed expense outlook and a live Bloomberg futures franchise. Yet the stock has lost nearly 30% since the last report, while the S&P 500 was essentially flat. That gap suggests the market has fixated on the two numbers management itself flagged as softening, options market share and revenue per contract, and this report should show whether that worry was overdone.
The Street is looking for adjusted earnings of $0.37 per share on revenue of about $129.7 million. The headline growth rates need care. The projected 61.8% revenue decline compares against reported total revenue of $339.8 million a year ago, while the consensus appears to be built on net revenue, which hit a record $141 million last quarter. Measured against the year-ago net revenue of $109 million, the estimate implies growth of roughly 19%, a sharp slowdown from the 35% pace of the second quarter. Likewise, the outsized EPS growth figure mostly reflects a tiny $0.02 base. The more telling comparison is sequential: analysts expect earnings to fall from $0.48, which squares with management's warning that the second quarter's unusually rich pricing would not repeat.
That pricing reset is the first thing to test. Revenue per contract jumped to 12.4 cents last quarter, but management explicitly told analysts not to extrapolate it, guiding the back half toward roughly 10.3 to 11 cents as options regulatory fee reform took effect July 1 and tier and mix effects normalize. A print inside that range would actually validate management's credibility; something near the top would hint that the reset is gentler than feared. The second swing factor is market share, which slid to 16.5% from a fourth-quarter peak of 18.2%. A July rebound to about 17.1% offered some relief, and new listings such as SpaceX and SK Hynix were reportedly capturing above-average share. Holding or building on that rebound would go a long way toward answering the stock's critics.
Cost discipline should cushion any revenue softness. Management lowered its full-year adjusted opex outlook to $260 million to $270 million, even as stock compensation and depreciation guidance crept higher. With adjusted EBITDA margin climbing from 44% to 54% over four quarters, the real question is how much of that gain survives lower pricing. Holding margins in the low 50s would confirm the operating leverage is structural rather than a byproduct of a strong pricing quarter.
The longer-term catalysts deserve a progress check too. The Bloomberg B500 and B100 futures launched in mid-May after earlier delays, with retail broker onboarding underway and an OCC clearing arrangement adding credibility. Futures revenue was flat at $5 million last quarter, so any early volume traction would be meaningful. Fertilizer futures slated for late October and possible updates on perpetual futures could also shape the outlook. A cash pile of $660 million with negligible debt gives the company ample flexibility.
Sentiment has swung from decidedly bearish before the last report to modestly bullish now, even as the shares sit well below their 200-day moving average of $41.79 and only about 12% above their post-earnings low of $29.06. That combination points to a cautiously hopeful but bruised investor base. Ultimately the report hinges on whether pricing lands where management promised and market share stabilizes. If both hold, the selloff will look like an overreaction to a well-telegraphed normalization; if share keeps slipping, the disruptor narrative will face a more serious challenge.
This earnings preview was originally published on Earnings Whispers.
This article is for informational purposes only and is not investment advice. Earnings Whispers and its staff may hold positions in the securities mentioned. It was generated automatically, with the help of AI, from Earnings Whispers and company data, and checked by Earnings Whispers before publication.
Mentioned In This Article
Latest News
| Oct-21 | |
| Oct-21 | |
| Oct-15 | |
| Oct-06 | |
| Oct-01 | |
| Sep-24 | |
| Sep-04 | |
| Sep-01 | |
| Aug-13 | |
| Aug-11 | |
| Aug-05 | |
| Aug-05 | |
| Jul-09 | |
| Jul-07 | |
| Jun-16 |
