SB Financial Edges Past Estimates As Loan Growth And Margin Rebound Collide With An Above-Guide Expense Jump
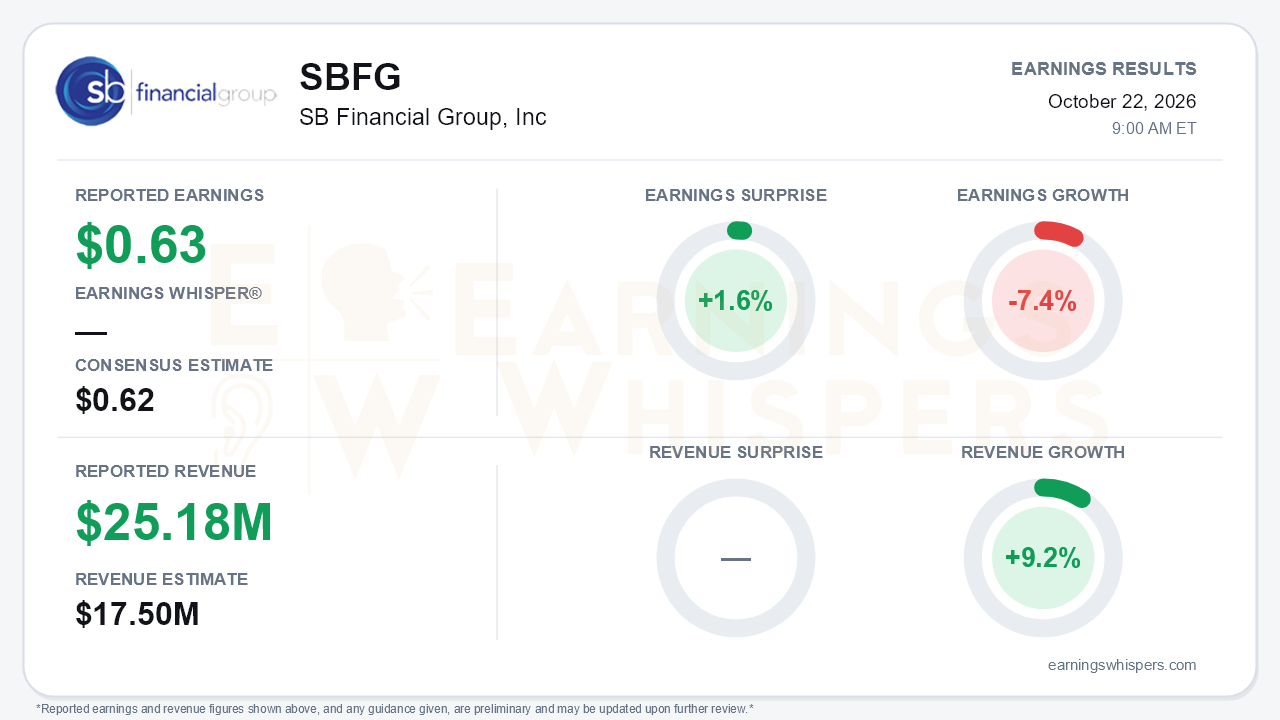
SB Financial Group delivered a narrow beat that hides a messier quarter. The Ohio-based community bank reported third-quarter earnings of $0.63 per share, 1.6% above the $0.62 consensus. On the adjusted basis Earnings Whispers uses, that was 7.4% lower than a year ago. Revenue grew 9.2% year over year to $25.18 million against a $17.5 million consensus, a 43.9% surprise. That surprise needs context. The $25.18 million figure reflects gross interest income plus fee income. The company's own net operating revenue was $18.1 million, up 9.0%, which is only modestly ahead of the consensus figure. The central tension is that the balance sheet and margin finally did what management promised, but expenses ran well past guidance and erased the benefit. Diluted EPS fell from $0.72 in the second quarter.
The quality of the quarter deserves scrutiny. On a GAAP basis, EPS slipped only to $0.63 from $0.64 a year ago. A $43,000 mortgage-servicing-rights recapture flattered this year's quarter, while a $301,000 impairment depressed last year's, so the adjusted comparison is the cleaner read. Noninterest expense rose 14.4% to $13.2 million, against the second-quarter guide of $12.3 to $12.4 million. Three items drove it:
- Salaries and benefits rose $1.1 million year over year on incentive and medical costs.
- Data processing jumped to $1.12 million from $693,000 in the linked quarter, tied to pending client and product conversions.
- Marketing roughly doubled from a year ago.
The efficiency ratio climbed to 72.5% from 67.3% in the second quarter. Pre-tax, pre-provision income fell to $4.9 million from $5.8 million. Year to date, the story still looks good: diluted EPS of $2.04 is up 31.1%, with operating leverage of 1.7 times. But the third quarter broke that pattern.
Underneath the expense noise, core banking momentum improved:
- **Loan growth:** Loans grew $29.2 million sequentially to $1.22 billion. That was the tenth straight quarter of growth and a sharp pickup from the $8.4 million added in the second quarter. Commercial real estate drove it and now makes up 52.5% of the book.
- **Margin:** Net interest margin rebounded to 3.50% from 3.43%, inside the 3.45% to 3.55% range management had flagged.
- **Net interest income:** It rose 8.8% year over year to $13.4 million.
- **Credit:** Quality remains pristine. Nonperforming assets were 0.27% of assets, net charge-offs were $17,000, and reserve coverage of nonperforming loans topped 500%.
- **Dividend:** Management raised the quarterly dividend to $0.165 from $0.16, a signal of confidence in the core franchise.
The forward commentary tilted cautious, however:
- **Margin ceiling:** Management capped the margin at roughly 3.50% to 3.51% and expects a fourth-quarter dip.
- **Mortgage:** Mortgage rates at or above 7% have pushed full-year 2026 originations toward about $280 million. That compares with the $310 to $325 million guided in the first quarter and the roughly $300 million hoped for in the second. Gain-on-sale margins slipped to 1.9% from 2.19%.
- **Deposits:** Deposits fell $8.3 million sequentially on wholesale runoff, despite earlier talk of 3% to 5% quarterly growth. The loan-to-deposit ratio rose to 88.1%.
- **Costs:** The CFO lifted the 2027 expense growth outlook to 4% to 5%, explicitly higher than six months ago.
- **Lagging initiatives:** The $84 million agriculture book and SBA production are behind their original timelines. Columbus still supplies roughly 70% of growth, versus the hoped-for even split.
- **Book value and buybacks:** Tangible book value per share dipped to $18.65 from $19.04 as the unrealized securities loss widened. Buybacks slowed to just 6,700 shares.
The catalysts are real but mostly deferred. The initial 2027 framework calls for:
- high-single-digit loan growth;
- mortgage volume up 10% to 15%, into the low $300 millions;
- two modeled rate hikes, each worth about $600,000 to $700,000 in annualized net interest income per 25 basis points.
The market-disruption campaign has reached about 586 new relationships, roughly 30% of its $500 million goal. De novo offices have grown to $25 million in deposits and $21 million in loans. Management also expects the Fiserv core-platform and credit card outsourcing conversions to drive future efficiency. Bulls will argue the current expense spike is the up-front cost of those savings. That is plausible, but it is not yet visible in the numbers.
The market setup is more complicated than the narrow beat implies. Shares have risen 14.0% since the open after the July report, to about $30.07. That leaves them roughly 24.5% above the 200-day moving average. The ride was volatile: the stock hit an inter-earnings low of $24.37 on September 21, then a 52-week high of $32.93 a week later. It entered the report about 8.7% below that peak. Price to tangible book expanded to 153% at quarter end from 112% a year earlier, so expectations are meaningfully higher than they were. Investor sentiment improved from modestly negative to roughly neutral. Price and AVWAP trends remain positive, while sequential growth and momentum readings are neutral, consistent with a quarter of mixed operating signals.
The bottom line is that SB Financial's banking engine is gaining traction, with faster loan growth, a recovered margin, spotless credit and a higher dividend. But expense discipline slipped at the same moment the stock re-rated. With the margin near its stated ceiling, mortgage volume shrinking and 2027 cost guidance moving up, earnings growth now depends on the conversion savings and disruption-driven growth actually showing up. Until operating leverage returns, bears have legitimate ammunition despite the headline beat.
Read our earnings preview for SB Financial Group, Inc: https://www.earningswhispers.com/article/SBFG/20540
This earnings review was originally published on Earnings Whispers.
This article is for informational purposes only and is not investment advice. Earnings Whispers and its staff may hold positions in the securities mentioned. It was generated automatically, with the help of AI, from Earnings Whispers and company data, and checked by Earnings Whispers before publication.
Mentioned In This Article
Latest News
| Oct-22 | |
| Oct-22 | |
| Sep-25 | |
| Jul-24 | |
| Jul-23 | |
| Jun-26 | |
| Apr-25 | |
| Apr-23 | |
| Mar-27 | |
| Mar-04 | |
| Feb-16 | |
| Jan-30 | |
| Jan-30 | |
| Jan-29 | |
| Jan-29 |
