Mercury General Faces An Underwriting Margin Test As Street Braces For Lower Earnings
Mercury General heads into its third-quarter report with a setup that looks contradictory at first. The top line is still growing, yet Wall Street expects earnings to shrink, and the stock has slid well behind the broader market since the company last reported. For an insurer built mainly on California auto policies, that gap between revenue and profit growth usually points to one question: is the company still pricing its business far enough ahead of claims costs to keep underwriting margins healthy?
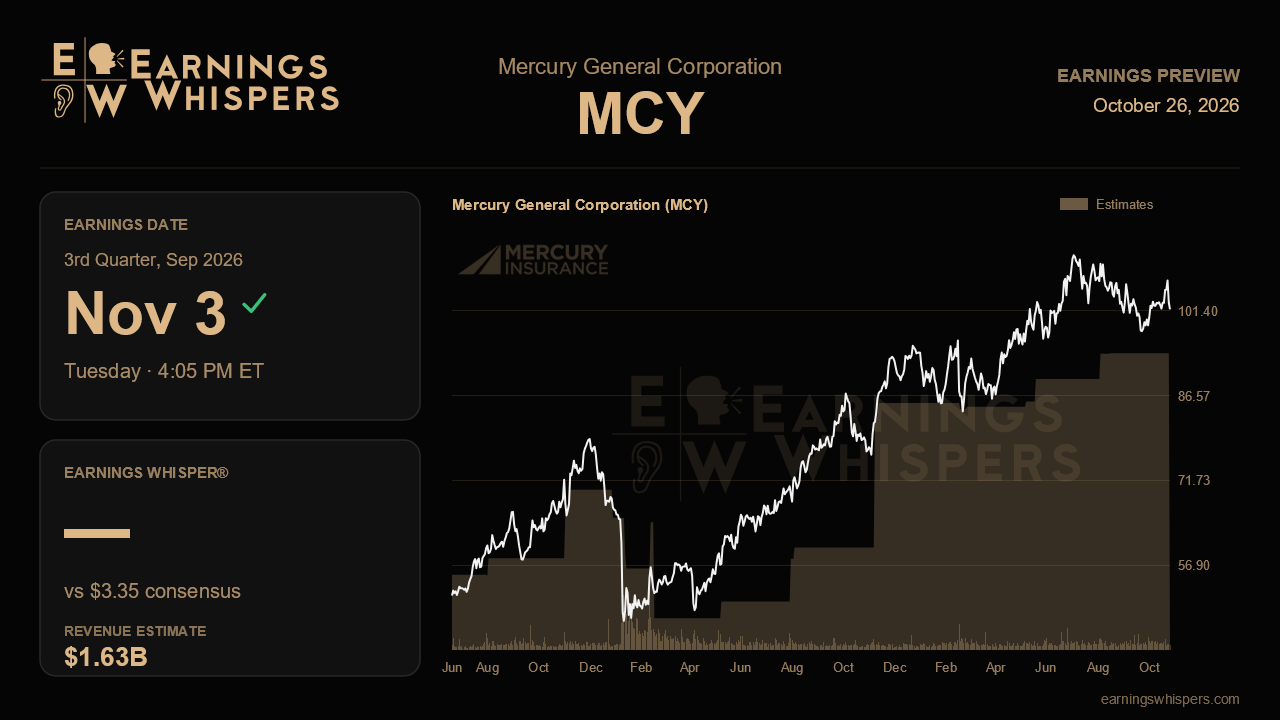
The consensus calls for earnings of $3.35 per share on revenue of about $1.63 billion. That would be a 13.2% drop from the $3.86 earned in the same quarter last year, while revenue would rise a modest 2.8% from $1.58 billion. The sequential picture is just as telling. Last quarter Mercury earned $3.52 per share on $1.68 billion in revenue, so analysts are modeling a step down on both lines. For a property and casualty carrier, a revenue figure that dips from the prior quarter can reflect swings in investment gains rather than any slowdown in premiums, so the composition of the revenue number may matter more than the headline total. Steady growth in earned premium alongside a dip in investment-related items would be a far more comfortable outcome than softness in the core book.
The company has not provided formal guidance, which leaves the Street to anchor on recent trends and on the economics of the auto line itself. That makes the underwriting results the real scorecard. The combined ratio, which compares claims and expenses with earned premium, will show whether the margin compression implied by consensus comes from higher loss costs, a heavier load of weather or catastrophe claims in its homeowners and commercial property lines, or simply a tough comparison against an unusually strong prior year. A combined ratio that holds near recent levels would suggest the expected earnings decline is mostly a function of last year's high bar. Meaningful deterioration, particularly in auto, would raise the harder question of whether pricing is falling behind the cost of repairs and injury claims.
Investor mood has improved even as the share price has weakened. Sentiment heading into this report sits only slightly bearish, a noticeable thaw from the considerably more negative reading ahead of the prior quarter. Meanwhile the stock has fallen 8.4% since the last report, trailing the S&P 500 by about 7 percentage points. That combination suggests the market has already marked down expectations, and that some of the pessimism priced in earlier has eased. A lowered bar can work in a company's favor, but only if the underlying results do not give investors a fresh reason to doubt margins.
Technically, the shares trade around $101.64, in the lower half of the post-earnings range between $96.68 and $112. That leaves the stock roughly 5% above the bottom of the range and well short of any breakout, a position that reflects caution rather than capitulation. A clean report could send it back toward the upper end of the band, while a disappointing underwriting quarter would put the range low, and the prior quarter's trough near $92, back in view.
Ultimately, this quarter comes down to whether the expected profit decline is a matter of comparison or a matter of trend. If Mercury shows premium growth holding up and underwriting margins staying disciplined, the stock's recent underperformance will look like an overreaction. If loss costs are outpacing the pricing it has achieved, the 13% earnings decline the Street expects may prove to be the start of a longer slide rather than a one-quarter dip.
This earnings preview was originally published on Earnings Whispers.
This article is for informational purposes only and is not investment advice. Earnings Whispers and its staff may hold positions in the securities mentioned. It is AI-assisted, based on proprietary Earnings Whispers data and company reports, and edited by Earnings Whispers staff.
Mentioned In This Article
Latest News
| 1 hour | |
| Oct-22 | |
| Oct-20 | |
| Oct-15 | |
| Oct-13 | |
| Oct-08 | |
| Oct-08 | |
| Oct-06 | |
| Sep-29 | |
| Sep-24 | |
| Sep-22 | |
| Sep-17 | |
| Sep-15 | |
| Sep-10 | |
| Sep-10 |
