IMAX Corporation Reports Record Third Quarter 2026 Results
-
IMAX delivers best quarterly financial performance in company history, breaking records across key metrics including:
- Revenue of $175 million, up 64% year-over-year and Gross Margin of $126 million, up 88% year-over-year.
- Strong operating leverage driven profitability with Net Income(1) of $117 million at a record margin of 67% and Adjusted EBITDA(2) of $121 million at a record margin of 69%, up over 2000 basis points year-over-year.
- Net income per diluted share of $1.96, up 430% year-over year and Adjusted EPS(1,2) of $2.21, up 370% year-over-year — both quarterly figures eclipsing any full year result in IMAX history.
- Cash from Operating Activities of $86 million, up 28% year-over-year.
- Company reports record quarterly global box office of $712 million — up +90% over the previous quarterly record of $372 million.
- Christopher Nolan’s The Odyssey makes history as highest grossing IMAX release of all time, with over $550 million in worldwide box office and delivering more than 30% of the film’s global box office.
- Signings for IMAX systems reach over 100 year-to-date — 65% new locations — as sales activity accelerates following the record-breaking performance of The Odyssey and amidst strong pre-sales for December’s Dune: Part Three.
- Dune: Part Three and Chinese release of Avengers: Doomsday kick off promising 2027 slate currently taking shape, with strong Chinese New Year offering led by Wandering Earth 3; Filmed for IMAX releases including Star Wars: Starfighter and Superman sequel Man of Tomorrow; Avengers: Secret Wars; and the IMAX debut of the original Star Wars, presented in IMAX 70mm film for the first time ever.
NEW YORK--(BUSINESS WIRE)--IMAX Corporation (NYSE: IMAX) today reported the best quarterly financial results in company history for the third quarter of 2026, as the global entertainment platform surged to new heights with record global box office in the period.
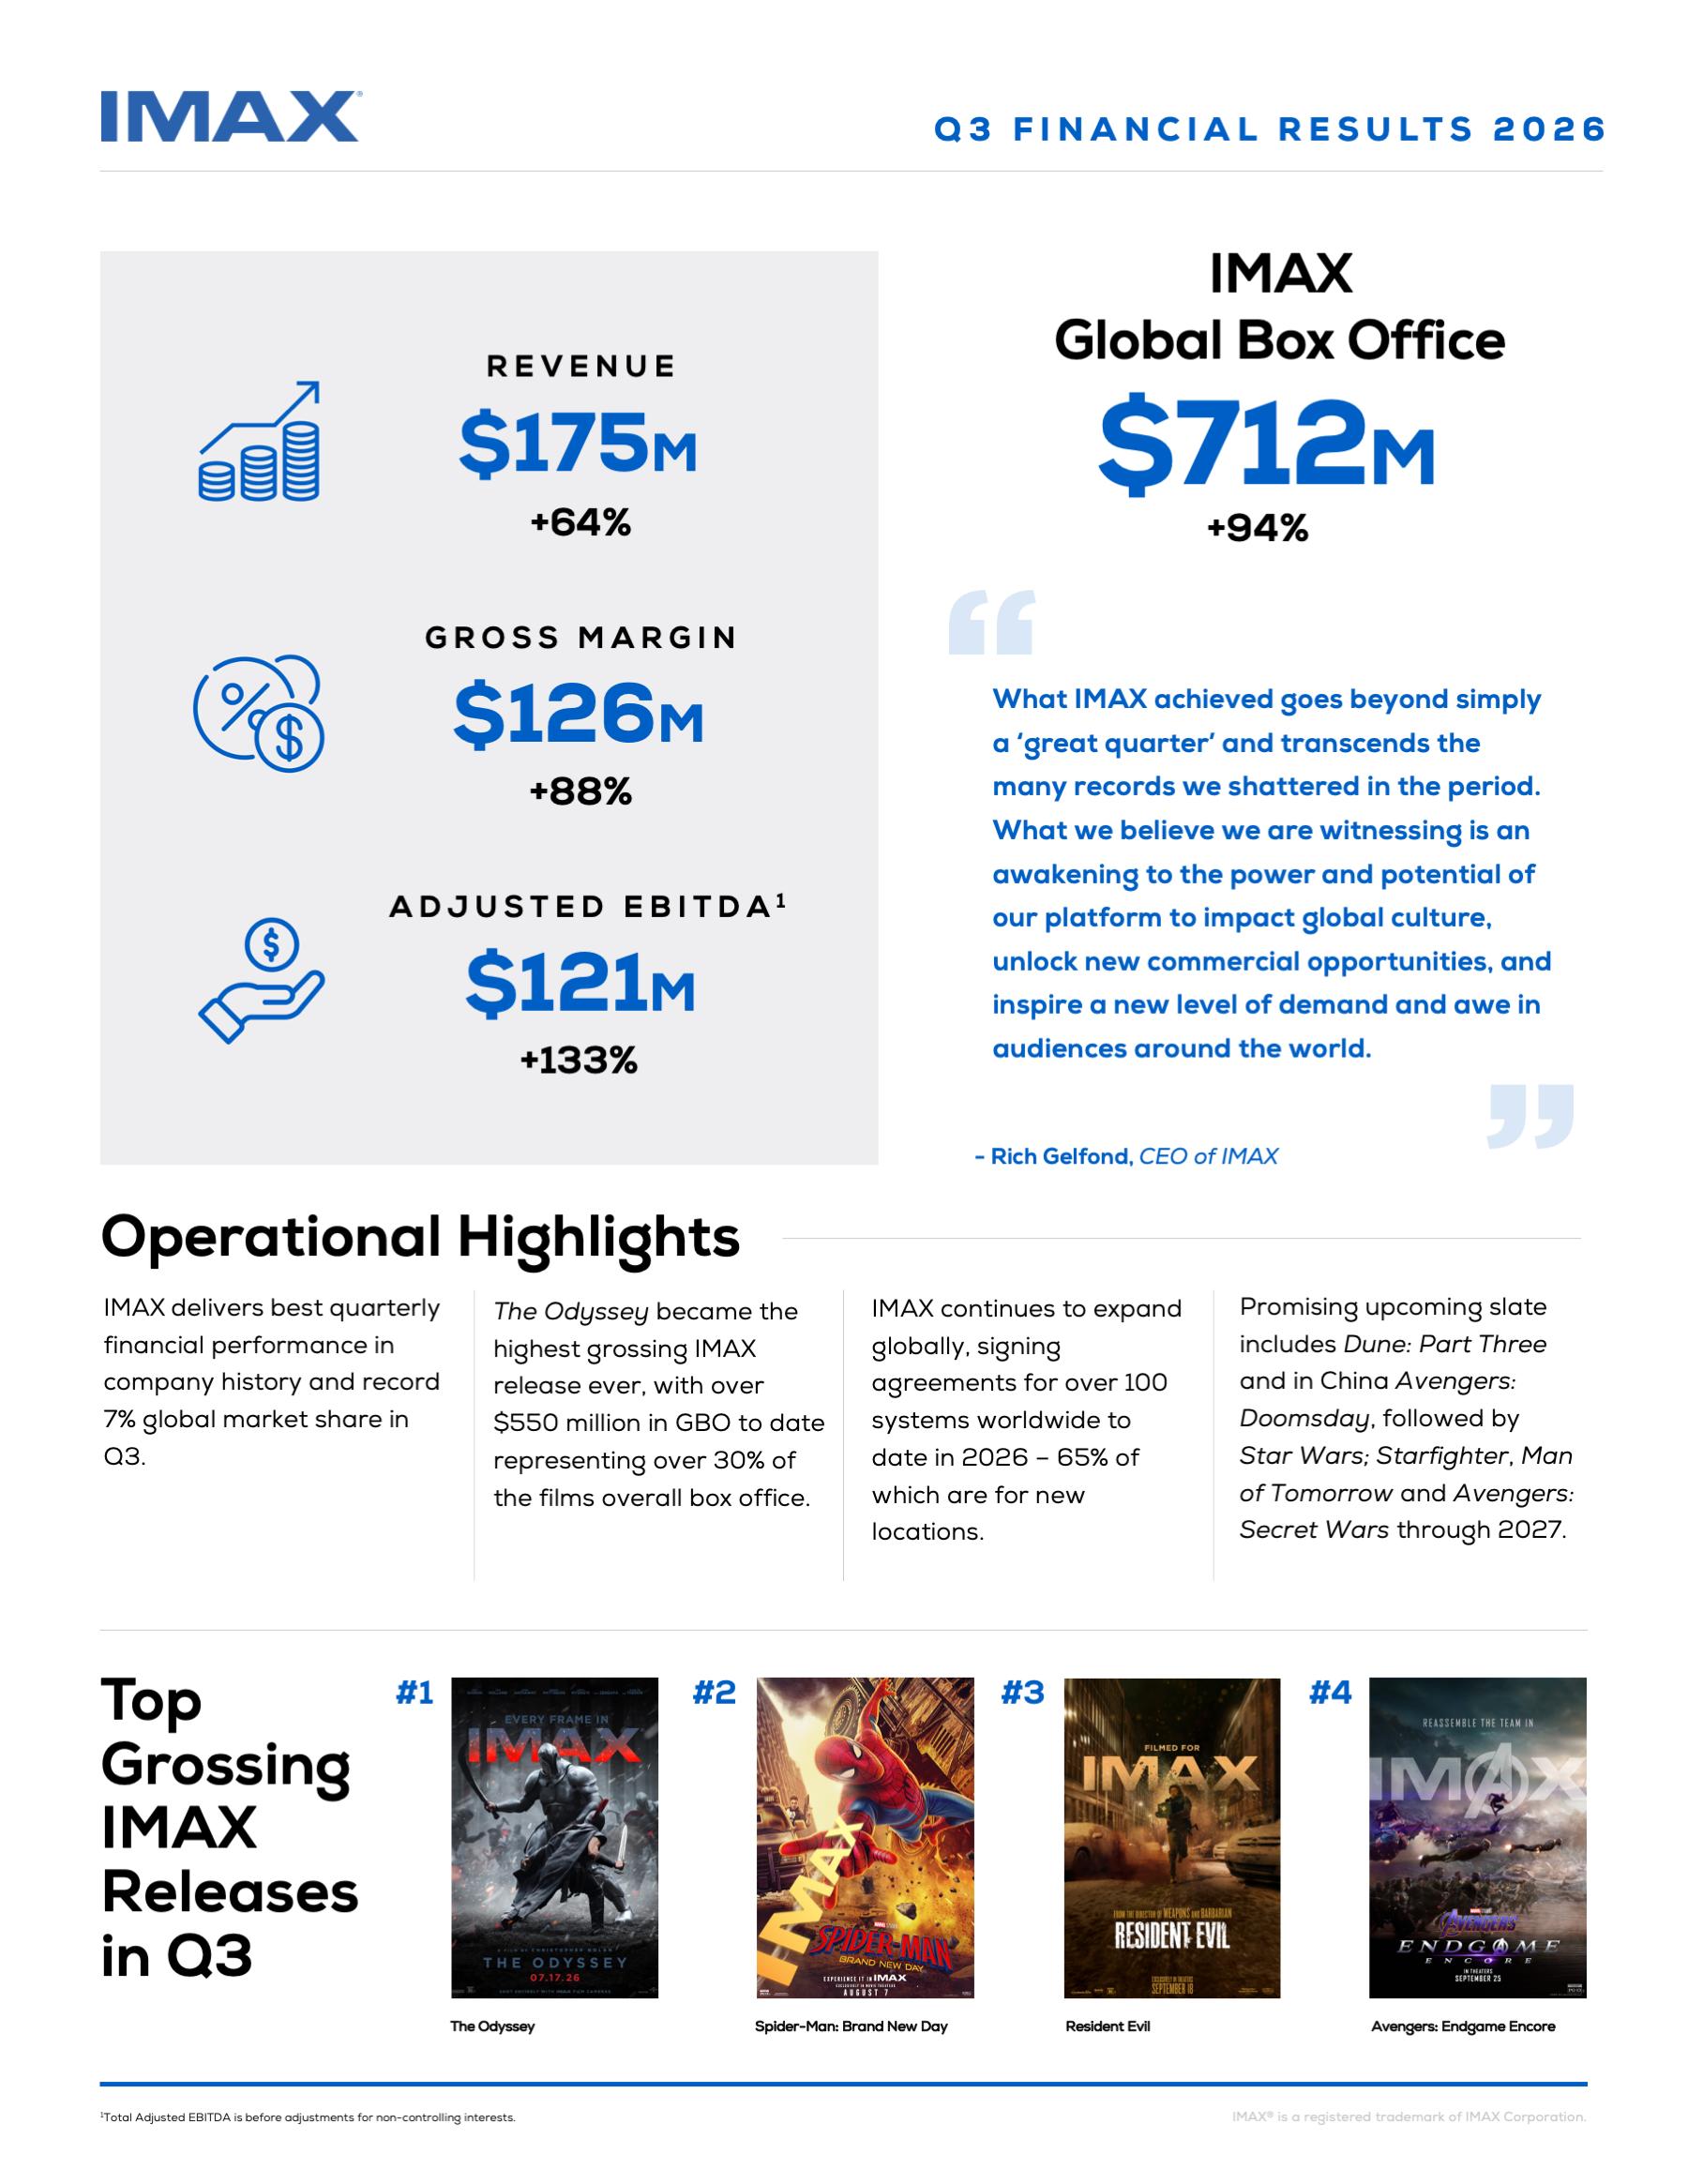
“What IMAX achieved goes beyond simply a ‘great quarter’ and transcends the many records we shattered in the period. What we believe we are witnessing is an awakening to the power and potential of our platform to impact global culture, unlock new commercial opportunities, and inspire a new level of demand and awe in audiences around the world,” said Rich Gelfond, CEO of IMAX Corporation.
“Christopher Nolan’s The Odyssey is a historic cinematic achievement crafted entirely with IMAX technology and its record-breaking success marks a new era of opportunity for our company. The record margins we generated in the quarter demonstrate the unique strength of our model, and the growing value of scarce events and experiences in an increasingly A.I.-driven world underscore a powerful opportunity for our business, as we look ahead to a remarkably strong slate over the next several years.”
“Our momentum is fueling sales activity with exhibitors around the world, with our team delivering more than 100 signings for IMAX systems worldwide year-to-date — including 65% new locations and strong growth across priority Rest of World markets.”
“With the global release of Dune: Part Three and our release of Avengers: Doomsday in China carrying into a very strong 2027 slate, we are excited for the year ahead and confident in our belief that there has never been a better time to be in the IMAX business. This ‘IMAX awakening’ sits inside a bigger culture shift of people around the world — particularly young people — seeking connection, community, and shared experiences that feel bigger than any one person’s screen. IMAX has always delivered these moments, and we believe this trend has only begun to benefit our business.”
| _________________________ | ||
(1) | For the three months ended September 30, 2026, Net income attributable to common shareholders includes $36.7 million ($0.63 per diluted share) of valuation allowance release related to certain Canadian federal and provincial deferred tax assets that are expected to be utilized in future years. | |
(2) | Non-GAAP Financial Measure. See the discussion at the end of this earnings release for a description of the non-GAAP financial measures used herein, as well as reconciliations to the most comparable GAAP amounts. | |
Third Quarter Financial Highlights
| Three Months Ended September 30, (Unaudited) |
| Nine Months Ended September 30, (Unaudited) | |||||||||||||||||||
In millions of U.S. Dollars, except per share data | 2026 |
| 2025 |
|
YoY %
|
| 2026 |
| 2025 |
|
YoY %
| |||||||||||
Total Revenue | $ | 174.6 |
|
| $ | 106.7 |
|
| 64 | % |
| $ | 358.8 |
|
| $ | 285.0 |
|
| 26 | % | |
|
|
|
|
|
|
|
|
|
|
|
| |||||||||||
Gross Margin | $ | 126.3 |
|
| $ | 67.3 |
|
| 88 | % |
| $ | 235.0 |
|
| $ | 174.0 |
|
| 35 | % | |
Gross Margin (%) |
| 72.3 | % |
|
| 63.1 | % |
| 920bps |
|
| 65.5 | % |
|
| 61.1 | % |
| 440bps | |||
|
|
|
|
|
|
|
|
|
|
|
| |||||||||||
Net Income | $ | 117.1 |
|
| $ | 22.6 |
|
| 418 | % |
| $ | 139.1 |
|
| $ | 43.0 |
|
| 223 | % | |
Net Income Margin (%) |
| 67.1 | % |
|
| 21.2 | % |
| 4590bps |
|
| 38.8 | % |
|
| 15.1 | % |
| 2370bps | |||
|
|
|
|
|
|
|
|
|
|
|
| |||||||||||
Net Income Attributable to Common Shareholders | $ | 113.8 |
|
| $ | 20.7 |
|
| 450 | % |
| $ | 133.4 |
|
| $ | 34.2 |
|
| 290 | % | |
Net Income Per Share - Diluted(1) | $ | 1.96 |
|
| $ | 0.37 |
|
| 430 | % |
| $ | 2.35 |
|
| $ | 0.62 |
|
| 279 | % | |
|
|
|
|
|
|
|
|
|
|
|
| |||||||||||
Total Adjusted EBITDA(2)(3) | $ | 120.9 |
|
| $ | 51.8 |
|
| 133 | % |
| $ | 199.4 |
|
| $ | 127.8 |
|
| 56 | % | |
Total Adjusted EBITDA Margin (%)(2)(3) |
| 69.3 | % |
|
| 48.6 | % |
| 2070bps |
|
| 55.6 | % |
|
| 44.9 | % |
| 1070bps | |||
|
|
|
|
|
|
|
|
|
|
|
| |||||||||||
Adjusted Net Income(1)(2) | $ | 127.9 |
|
| $ | 26.2 |
|
| 388 | % |
| $ | 161.7 |
|
| $ | 48.0 |
|
| 237 | % | |
Adjusted Earnings Per Share - Diluted(1)(2) | $ | 2.21 |
|
| $ | 0.47 |
|
| 370 | % |
| $ | 2.84 |
|
| $ | 0.87 |
|
| 226 | % | |
|
|
|
|
|
|
|
|
|
|
|
| |||||||||||
Weighted average shares outstanding (in millions): |
|
|
|
|
|
|
|
|
|
|
| |||||||||||
Basic |
| 55.0 |
|
|
| 53.8 |
|
| 2 | % |
|
| 54.7 |
|
|
| 53.6 |
|
| 2 | % | |
Diluted(4) |
| 58.0 |
|
|
| 55.6 |
|
| 4 | % |
|
| 56.9 |
|
|
| 55.2 |
|
| 3 | % | |
| _________________________ | ||
(1) | Attributable to common shareholders. | |
(2) | Non-GAAP Financial Measure. See the discussion at the end of this earnings release for a description of the non-GAAP financial measures used herein, as well as reconciliations to the most comparable GAAP amounts. | |
(3) | Total Adjusted EBITDA is before adjustments for non-controlling interests. Total Adjusted EBITDA per Credit Facility attributable to common shareholders, excluding non-controlling interests, was $115.2 million and $187.7 million for the three and nine months ended September 30, 2026, respectively (2025 - $48.0 million and $112.7 million, respectively). The Company’s Credit Facility covenant is calculated on a trailing twelve-month basis. | |
(4) | For the three months ended September 30, 2026, the calculation of diluted weighted average shares outstanding includes any shares potentially issuable upon the conversion of the Convertible Notes, as the average market price of the Company’s common shares exceeded the conversion price and the effect was dilutive. The capped call transactions are excluded from the calculation of diluted earnings per share because their effect would be antidilutive. | |
Third Quarter Segment Results(1)
| Content Solutions |
| Technology Products and Services | |||||||||||||||||||
| Revenue |
| Gross Margin |
| Gross Margin % |
| Revenue |
| Gross Margin |
| Gross Margin % | |||||||||||
3Q26 | $ | 94.0 |
|
| $ | 71.7 |
|
| 76 | % |
| $ | 77.3 |
|
| $ | 53.4 |
|
| 69 | % | |
3Q25 |
| 44.8 |
|
|
| 31.9 |
|
| 71 | % |
|
| 60.4 |
|
|
| 34.8 |
|
| 58 | % | |
% change |
| 110 | % |
|
| 125 | % |
|
|
|
| 28 | % |
|
| 53 | % |
|
| |||
|
|
|
|
|
|
|
|
|
|
|
| |||||||||||
YTD26 | $ | 160.0 |
|
| $ | 111.9 |
|
| 70 | % |
| $ | 190.4 |
|
| $ | 119.3 |
|
| 63 | % | |
YTD25 |
| 113.0 |
|
|
| 77.9 |
|
| 69 | % |
|
| 166.7 |
|
|
| 94.1 |
|
| 56 | % | |
% change |
| 42 | % |
|
| 44 | % |
|
|
|
| 14 | % |
|
| 27 | % |
|
| |||
| _________________________ | ||
(1) | Please refer to the Company’s Quarterly Report on Form 10-Q for the period ended September 30, 2026 for additional segment information. | |
Content Solutions Segment
- Third quarter Content Solutions revenues and gross margin increased 110% to $94 million and 125% to $72 million year-over-year, respectively. IMAX’s global platform delivered a record 76% gross margin reflecting the significant incrementality within the IMAX business model as our platform scales and box office increases.
- Third quarter global box office of $712 million marked IMAX’s highest quarterly box office in its history and increased 94% year-over-year leading IMAX to deliver 6.7% of the industry’s third quarter global box office (on less than 1% of worldwide screens). Top grossing third quarter titles included The Odyssey ($538 million) and Spider-Man: Brand New Day ($58 million).
Technology Products and Services Segment
- Third quarter Technology Products and Services revenues and gross margin increased 28% to $77 million and 53% to $53 million year-over-year, respectively, driven by rental revenue growth tied to higher box office and amendments and renewals of existing agreements which more than offset lower systems under sales arrangements installations.
- During the third quarter of 2026, the Company installed 32 systems compared to 38 systems in the third quarter of 2025. Of the quarter’s installs, 15 systems were under sales arrangements, compared to 17 in the prior year.
- Commercial network growth continued with the number of IMAX locations reaching 1,820 systems as of September 30, 2026 compared to 1,759 systems as of September 30, 2025. The Company ended Q3 2026 with a backlog of 409 IMAX systems.
Operating Cash Flow and Liquidity
Net cash provided by operating activities for the nine months ended September 30, 2026 increased 25% year-over-year to $122 million, reflecting higher operating profits and the elevated conversion of profits to cash flow as margins increase.
As of September 30, 2026, the Company’s available liquidity was $641 million. The Company’s liquidity included cash and cash equivalents of $208 million, $375 million in available borrowing capacity under the Company’s revolving credit facility, and $58 million in available borrowing capacity under IMAX China’s revolving facilities. Total debt, excluding deferred financing costs, was $251 million as of September 30, 2026.
In 2025, the Company issued $250 million of 0.750% Convertible Senior Notes due 2030 (“2030 Convertible Notes”). In connection with the pricing of the 2030 Convertible Notes, the Company entered into privately negotiated capped call transactions with a cap price of $57.10 per share of the Company’s common shares.
Share Count and Capital Return
The weighted average basic and diluted shares outstanding in the third quarter of 2026 were 55.0 million and 58.0 million, respectively, compared to 53.8 million and 55.6 million in the third quarter of 2025.
During the third quarter of 2026 and 2025, the Company did not have any repurchases of common shares.
In June 2026, the Company’s Board of Directors approved an extension of its share repurchase program through June 30, 2027. As of September 30, 2026, the Company’s total share repurchase authority was $500.0 million with approximately $237.0 million available under the program.
Supplemental Materials
For more information about the Company’s results, please refer to the IMAX Investor Relations website located at investors.imax.com.
Investor Relations Website
On a monthly basis, the Company posts quarter-to-date box office results on the IMAX Investor Relations website located at investors.imax.com. The Company expects to provide such updates within five business days of month-end, although the Company may change this timing without notice.
The Company may post additional information on the Company’s corporate and Investor Relations websites, which may be material to investors. Accordingly, investors, media and others interested in the Company should monitor the Company’s website in addition to the Company’s press releases, United States Securities and Exchange Commission (the “SEC”) or in Canada, the System for Electronic Data Analysis and Retrieval (“SEDAR+”) filings and public conference calls and webcasts, for additional information about the Company. References to our website address and domain names throughout this release are for informational purposes only, or to fulfill specific disclosure requirements of the SEC’s rules or The New York Stock Exchange Listing Standards. These references are not intended to, and do not, incorporate the contents of our websites by reference into this release.
Conference Call
The Company will host a conference call today at 8:30 AM ET to discuss its third quarter 2026 financial results. This call is being webcast and can be accessed at investors.imax.com. To access the call via telephone, interested parties should pre-register at: https://register-conf.media-server.com/register/BIf4fcc885e18b4fce9844ecee1efeb2fb and you will be provided with a dial-in number and unique PIN. To avoid delays, we encourage participants to dial into the conference call ten minutes ahead of the scheduled start time. A replay of the call will be available via webcast at investors.imax.com.
About IMAX Corporation
IMAX, an innovator in entertainment technology, combines proprietary software, architecture, and equipment to create experiences that take you beyond the edge of your seat to a world you’ve never imagined. Top filmmakers and studios are utilizing IMAX systems to connect with audiences in extraordinary ways, making IMAX’s network among the most important and successful theatrical distribution platforms for major event films around the globe.
IMAX’s principal executive offices are located in Mississauga, Ontario, Canada and New York, New York. As of September 30, 2026, there were 1,887 IMAX systems (1,820 commercial multiplexes, 10 commercial destinations, 57 institutional locations) operating in 91 countries and territories.
Shares of IMAX China Holding, Inc., a subsidiary of IMAX Corporation, trade on the Hong Kong Stock Exchange under the stock code “1970”.
IMAX®, IMAX® 3D, Experience It In IMAX®, The IMAX Experience®, DMR®, Filmed For IMAX®, IMAX Live®, and IMAX Enhanced® are trademarks and trade names of the Company or its subsidiaries that are registered or otherwise protected under laws of various jurisdictions. For more information, visit www.imax.com. You can also connect with IMAX on Instagram (www.instagram.com/imax), Facebook (www.facebook.com/imax), LinkedIn (www.linkedin.com/company/imax), X (www.twitter.com/imax), and YouTube (www.youtube.com/imaxmovies).
Forward-Looking Statements
This earnings release contains forward looking statements that are based on IMAX Corporation (the “Company”) management’s assumptions and existing information and involve certain risks and uncertainties which could affect our future results and cause those results or other outcomes to differ materially from future results expressed or implied by such forward looking statements. In some cases, you can identify these statements by forward-looking words such as “believe,” “expect,” “if,” “may,” “plan,” “potential,” “promising,” “momentum” or the negative or other variations thereon or comparable terminology.
These forward-looking statements include, but are not limited to statements regarding: the Company’s business and technology strategies and measures to implement such strategies, including live events and exclusive content partnerships; the Company’s competitive strengths, differentiation, goals, market opportunity and penetration, including opportunities in and expected growth from international markets, momentum and runway for expansion and growth of business, networks, operations and technology; capital allocation, including with respect to share repurchase programs; the Company’s ability to benefit from and to impact changes in global culture, to unlock new commercial opportunities and to increase demand; the Company’s technological capabilities and the differentiation thereof; future releases of films and other content to the IMAX network, including the timing of such releases, the anticipated box office revenues, and other effects thereof; and plans and references to the future success of the Company and expectations regarding its future operating, financial and technological results.
These forward-looking statements are based on certain assumptions and analyses made by the Company in light of its experience and its perception of historical trends, current conditions and expected future developments, as well as other factors it believes are appropriate in the circumstances. However, whether actual results and developments will conform with the expectations and predictions of the Company is subject to a number of risks and uncertainties, including, but not limited to: risks associated with the Company’s investments, operations and future expansion in foreign jurisdictions, including the impact of economic, political and regulatory policies and laws of the United States, Canada, and China, tariffs and other trade regulations, and economic and trade tensions, trade wars, and geopolitical conflicts; risks related to the Company’s growth and operations in China, including industry conditions to both the Company and its partners; the ability of the Company’s exhibitor customers to fulfill their contractual payment obligations; risks related to the Company’s ability to attract and retain its employee population or the loss of the Company’s key personnel; the performance of IMAX remastered films and other films released to the IMAX network; conditions, changes and developments in the commercial exhibition industry; the Company’s ability to enter into new IMAX theater system agreements and sales and lease agreements and the effects thereof; fluctuations in operating results and cash flow; currency fluctuations and foreign exchange controls; the potential impact of increased competition in the markets within which the Company operates, including competitive actions by other companies; the ability of the Company to respond to change and advancements in technology, including with respect to AI products and AI-generated content; the potential impacts of consolidation among commercial exhibitors and studios; success of brand extensions and new business initiatives; conditions and competition in the in-home (including streaming) and out-of-home entertainment industries; the Company’s ability to identify and pursue new business opportunities (or lack thereof); cybersecurity and data privacy incidents; the Company’s ability to protect its intellectual property and to avoid infringing, misappropriating, or violating the intellectual property rights of others; effects of environmental laws and regulations, including with respect to climate change; weather conditions and natural disasters that may disrupt or harm the Company’s business; effects of the Company’s indebtedness on its cash flow and business activities and the Company’s ability to comply with its debt agreements; general economic, market or business conditions; sustained inflationary pressure; political, economic and social instability and the resulting disruptions to the Company’s operations or supply chain; the Company’s ability to convert system backlog into revenue and cash flows; accuracy of assumptions underlying goodwill impairment assessment and fair value measurements; changes in laws, regulations or accounting principles; any statements of belief and any statements of assumptions underlying any of the foregoing; other factors and risks outlined in the Company’s periodic filings with the United States Securities and Exchange Commission (the “SEC”) or in Canada, the System for Electronic Data Analysis and Retrieval (“SEDAR+”); and other factors, many of which are beyond the control of the Company. Consequently, all of the forward-looking statements made in this earnings release are qualified by these cautionary statements, and actual results or anticipated developments by the Company may not be realized, and even if substantially realized, may not have the expected consequences to, or effects on, the Company. These factors, other risks and uncertainties and financial details are discussed in the Company’s most recent Annual Report on Form 10-K, as may be updated in filings the Company makes from time to time with the SEC, including the Company’s Quarterly Reports on Form 10-Q. The forward-looking statements herein are made only as of the date hereof and the Company undertakes no obligation to update publicly or otherwise revise any forward-looking statements, whether as a result of new information, future events or otherwise.
IMAX Network and Backlog
| Three Months Ended |
| Nine Months Ended | |||||
| September 30, |
| September 30, | |||||
| 2026 |
| 2025 |
| 2026 |
| 2025(1) | |
System Signings(2): |
|
|
|
|
|
|
| |
Sales Arrangements | 12 |
| 15 |
| 62 |
| 49 | |
Traditional JRSA | 8 |
| 4 |
| 17 |
| 93 | |
Total IMAX System Signings | 20 |
| 19 |
| 79 |
| 142 | |
(1) Includes 70 traditional JRSA systems with AMC Entertainment in 2025. | ||||||||
| (2) System signings include new signings of 8 in Q3 2026, 47 in YTD 2026, 18 in Q3 2025 and 81 in YTD 2025. | ||||||||
Three Months Ended |
| Nine Months Ended | ||||||
| September 30, |
| September 30, | |||||
| 2026 |
| 2025 |
| 2026 |
| 2025 | |
System Installations(1): |
|
|
|
|
|
|
| |
Sales Arrangements | 15 |
| 17 |
| 41 |
| 43 | |
Hybrid JRSA | — |
| 1 |
| — |
| 1 | |
Traditional JRSA | 17 |
| 20 |
| 48 |
| 51 | |
Total IMAX System Installations | 32 |
| 38 |
| 89 |
| 95 | |
(1) System installations include new systems installations of 13 in Q3 2026, 38 in Q3 YTD, 23 in Q3 2025 and 55 in YTD 2025. | ||||||||
As of September 30, | ||||
| 2026 |
| 2025 | |
System Backlog: |
|
|
| |
Sales Arrangements | 231 |
| 157 | |
Hybrid JRSA | 5 |
| 94 | |
Traditional JRSA | 173 |
| 227 | |
Total System Backlog(1) | 409 |
| 478 | |
(1) Greater China backlog changes include year-to-date installations along with restructuring of certain contracts resulting in cancellation of backlog for 17 system locations deemed mutually to no longer be beneficial to IMAX and its exhibition customers. | ||||
|
|
|
| |
| As of September 30, | |||
| 2026 |
| 2025 | |
System Network: |
|
|
| |
Commercial Multiplex Systems |
|
|
| |
Sales Arrangements | 937 |
| 854 | |
Hybrid JRSA | 78 |
| 119 | |
Traditional JRSA | 805 |
| 786 | |
Total Commercial Multiplex Systems | 1,820 |
| 1,759 | |
Commercial Destination Systems | 10 |
| 10 | |
Institutional Systems | 57 |
| 60 | |
Total System Network | 1,887 |
| 1,829 | |
IMAX CORPORATION | ||||||||||||||||
CONDENSED CONSOLIDATED STATEMENTS OF OPERATIONS | ||||||||||||||||
(In thousands of U.S. dollars, except per share amounts) | ||||||||||||||||
(Unaudited) | ||||||||||||||||
| Three Months Ended September 30, |
| Nine Months Ended September 30, | |||||||||||||
| 2026 |
| 2025 |
| 2026 |
| 2025 | |||||||||
Revenues |
|
|
|
|
|
|
| |||||||||
Technology sales | $ | 18,876 |
|
| $ | 19,360 |
|
| $ | 58,944 |
|
| $ | 51,726 |
| |
Image enhancement and maintenance services |
| 110,966 |
|
|
| 61,029 |
|
|
| 212,710 |
|
|
| 162,636 |
| |
Technology rentals |
| 41,436 |
|
|
| 23,336 |
|
|
| 78,060 |
|
|
| 61,763 |
| |
Finance income |
| 3,274 |
|
|
| 2,929 |
|
|
| 9,059 |
|
|
| 8,880 |
| |
|
| 174,552 |
|
|
| 106,654 |
|
|
| 358,773 |
|
|
| 285,005 |
| |
Costs and expenses applicable to revenues |
|
|
|
|
|
|
| |||||||||
Technology sales |
| 8,577 |
|
|
| 9,454 |
|
|
| 23,739 |
|
|
| 26,029 |
| |
Image enhancement and maintenance services |
| 32,649 |
|
|
| 23,065 |
|
|
| 78,143 |
|
|
| 63,886 |
| |
Technology rentals |
| 7,024 |
|
|
| 6,864 |
|
|
| 21,882 |
|
|
| 21,041 |
| |
|
| 48,250 |
|
|
| 39,383 |
|
|
| 123,764 |
|
|
| 110,956 |
| |
Gross margin |
| 126,302 |
|
|
| 67,271 |
|
|
| 235,009 |
|
|
| 174,049 |
| |
Selling, general and administrative expenses |
| 39,083 |
|
|
| 34,219 |
|
|
| 106,099 |
|
|
| 102,983 |
| |
Research and development |
| 1,900 |
|
|
| 1,505 |
|
|
| 5,359 |
|
|
| 4,365 |
| |
Amortization of intangible assets |
| 2,467 |
|
|
| 1,906 |
|
|
| 6,659 |
|
|
| 5,446 |
| |
Credit loss expense, net |
| 1,188 |
|
|
| 596 |
|
|
| 2,209 |
|
|
| 287 |
| |
Goodwill impairment |
| 6,788 |
|
|
| — |
|
|
| 6,788 |
|
|
| — |
| |
Restructuring charges and other impairments |
| — |
|
|
| — |
|
|
| 2,294 |
|
|
| 843 |
| |
Income from operations |
| 74,876 |
|
|
| 29,045 |
|
|
| 105,601 |
|
|
| 60,125 |
| |
Realized and unrealized investment gains |
| 38 |
|
|
| 34 |
|
|
| 92 |
|
|
| 99 |
| |
Retirement benefits non-service (expense) recovery |
| (68 | ) |
|
| 17 |
|
|
| (202 | ) |
|
| (186 | ) | |
Interest income |
| 705 |
|
|
| 557 |
|
|
| 1,824 |
|
|
| 2,211 |
| |
Interest expense |
| (1,774 | ) |
|
| (1,832 | ) |
|
| (5,631 | ) |
|
| (5,560 | ) | |
Income before taxes |
| 73,777 |
|
|
| 27,821 |
|
|
| 101,684 |
|
|
| 56,689 |
| |
Income tax recovery (expense) |
| 43,302 |
|
|
| (5,205 | ) |
|
| 37,374 |
|
|
| (13,688 | ) | |
Net income |
| 117,079 |
|
|
| 22,616 |
|
|
| 139,058 |
|
|
| 43,001 |
| |
Net income attributable to non-controlling interests |
| (3,274 | ) |
|
| (1,959 | ) |
|
| (5,625 | ) |
|
| (8,762 | ) | |
Net income attributable to common shareholders | $ | 113,805 |
|
| $ | 20,657 |
|
| $ | 133,433 |
|
| $ | 34,239 |
| |
|
|
|
|
|
|
|
| |||||||||
Net income per share attributable to common shareholders: |
|
|
|
|
|
|
| |||||||||
Basic | $ | 2.07 |
|
| $ | 0.38 |
|
| $ | 2.44 |
|
| $ | 0.64 |
| |
Diluted | $ | 1.96 |
|
| $ | 0.37 |
|
| $ | 2.35 |
|
| $ | 0.62 |
| |
|
|
|
|
|
|
|
| |||||||||
Weighted average shares outstanding (in thousands): |
|
|
|
|
|
|
| |||||||||
Basic |
| 55,023 |
|
|
| 53,788 |
|
|
| 54,698 |
|
|
| 53,561 |
| |
Diluted |
| 58,007 |
|
|
| 55,565 |
|
|
| 56,897 |
|
|
| 55,242 |
| |
|
|
|
|
|
|
|
| |||||||||
Additional Disclosure: |
|
|
|
|
|
|
| |||||||||
Depreciation and amortization | $ | 26,815 |
|
| $ | 30,519 |
|
| $ | 57,735 |
|
| $ | 46,415 |
| |
Amortization of deferred financing costs | $ | 528 |
|
| $ | 508 |
|
| $ | 1,584 |
|
| $ | 1,492 |
| |
Contacts
Investors:
IMAX Corporation, New York
Jennifer Horsley
212-821-0154
jhorsley@imax.com
Media:
IMAX Corporation, New York
Mark Jafar
212-821-0102
mjafar@imax.com
Read full story here
Mentioned In This Article
Latest News
| Nov-06 | |
| Nov-05 | |
| Nov-05 | |
| Nov-05 | |
| Nov-05 | |
| Nov-04 | |
| Nov-03 | |
| Nov-03 | |
| Oct-28 | |
| Oct-25 | |
| Oct-19 | |
| Oct-15 | |
| Oct-14 | |
| Oct-09 | |
| Oct-08 |
